| Param | Original file | Final file |
|---|---|---|
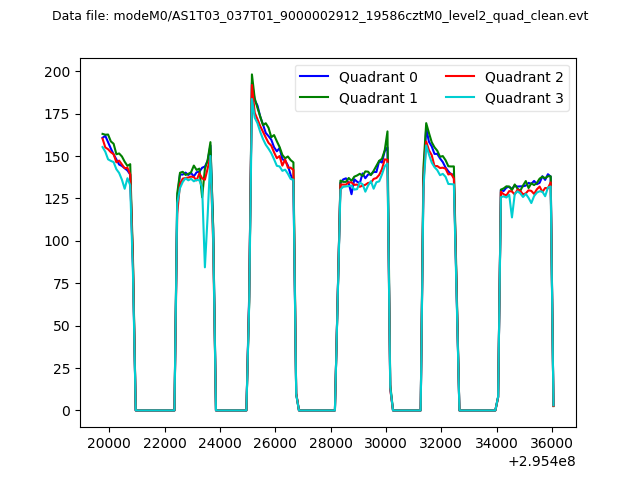
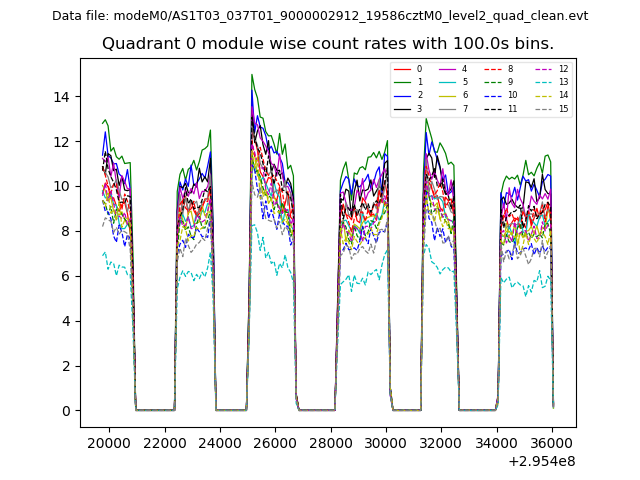
| Filename | modeM0/AS1T03_037T01_9000002912_19586cztM0_level2.evt | modeM0/AS1T03_037T01_9000002912_19586cztM0_level2_quad_clean.evt |
| Size (bytes) | 1,073,897,280 | 204,396,480 |
| Size | 1.0 GB | 194.9 MB |
| Events in quadrant A | 7,160,883 | 1,329,228 |
| Events in quadrant B | 7,192,312 | 1,348,550 |
| Events in quadrant C | 7,008,450 | 1,298,711 |
| Events in quadrant D | 10,229,266 | 1,261,319 |
| Mode M9 | |||
|---|---|---|---|
| Quadrant | BADHDUFLAG | Total packets | Discarded packets |
| A | 0 | 25 | 0 |
| B | 0 | 25 | 0 |
| C | 0 | 25 | 0 |
| D | 0 | 25 | 0 |
| Mode M0 | |||
|---|---|---|---|
| Quadrant | BADHDUFLAG | Total packets | Discarded packets |
| A | 0 | 29745 | 2 |
| B | 0 | 29719 | 2 |
| C | 0 | 29049 | 2 |
| D | 0 | 39352 | 2 |
| Mode SS | |||
|---|---|---|---|
| Quadrant | BADHDUFLAG | Total packets | Discarded packets |
| A | 0 | 280 | 0 |
| B | 0 | 280 | 0 |
| C | 0 | 280 | 0 |
| D | 0 | 280 | 0 |
| Quadrant | Total seconds | Saturated seconds | Saturation percentage |
|---|---|---|---|
| A | 13795 | 169 | 1.225082% |
| B | 13796 | 168 | 1.217744% |
| C | 13796 | 224 | 1.623659% |
| D | 13796 | 799 | 5.791534% |
Noise dominated data is calculated using 1-second bins in cleaned event files. If a bin has >2000 counts, and if more than 50% of those come from <1% of pixels, then it is considered to be noise-dominated and hence unusable.
| Quadrant | # 1 sec bins | Bins with >0 counts | Bins with >2000 counts | High rate bins dominated by noise | Noise dominated (total time) | Noise dominated (detector-on time) | Marked lightcurve |
|---|---|---|---|---|---|---|---|
| A | 16305 | 13797 | 45 | 45 | 0.28% | 0.33% | 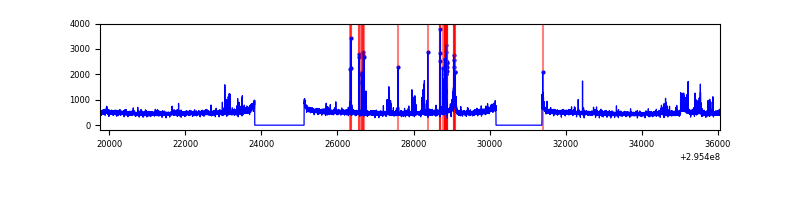 |
| B | 16306 | 13798 | 29 | 29 | 0.18% | 0.21% | 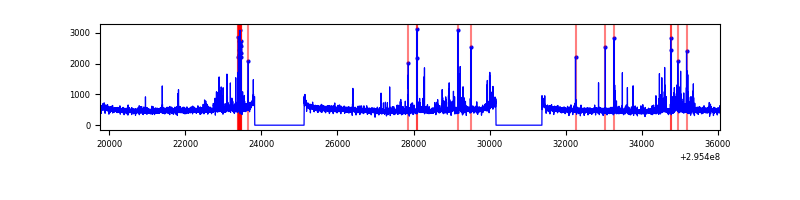 |
| C | 16306 | 13798 | 16 | 16 | 0.10% | 0.12% | 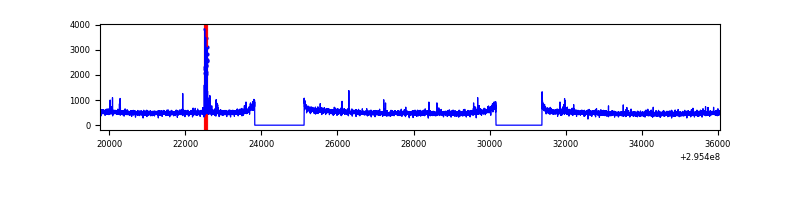 |
| D | 16306 | 13798 | 665 | 665 | 4.08% | 4.82% |  |
Top three noisy pixels from each quadrant. If the there are fewer than three noisy pixels in the level2.evt file, extra rows are filled as -1
| Pixel properties | Quadrant properties | ||||||
|---|---|---|---|---|---|---|---|
| Quadrant | DetID | PixID | Counts | Sigma | Mean | Median | Sigma |
| A | 5 | 16 | 319800 | 929.48 | 1729 | 1698 | 342.2 |
| A | 13 | 210 | 152461 | 440.52 | 1729 | 1698 | 342.2 |
| A | 4 | 2 | 24726 | 67.29 | 1729 | 1698 | 342.2 |
| B | 15 | 32 | 114140 | 358.94 | 1713 | 1674 | 313.3 |
| B | 0 | 197 | 105444 | 331.19 | 1713 | 1674 | 313.3 |
| B | 7 | 220 | 82084 | 256.63 | 1713 | 1674 | 313.3 |
| C | 14 | 238 | 262337 | 685.15 | 1674 | 1688 | 380.4 |
| C | 3 | 233 | 72854 | 187.07 | 1674 | 1688 | 380.4 |
| C | 0 | 207 | 60634 | 154.95 | 1674 | 1688 | 380.4 |
| D | 13 | 104 | 1567817 | 3915.84 | 1667 | 1622 | 400.0 |
| D | 1 | 52 | 1391750 | 3475.64 | 1667 | 1622 | 400.0 |
| D | 7 | 238 | 394876 | 983.22 | 1667 | 1622 | 400.0 |
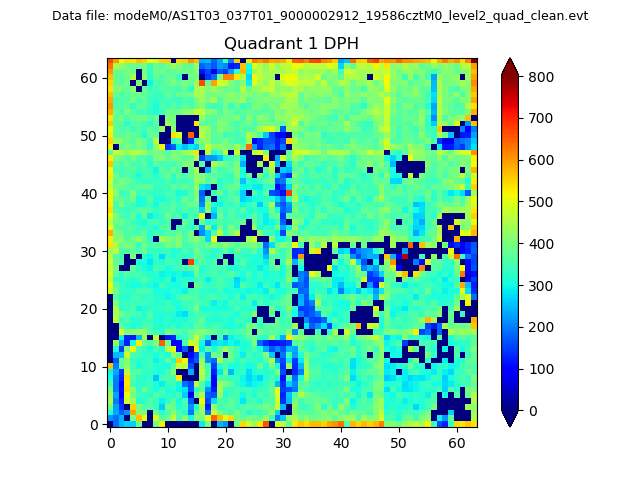
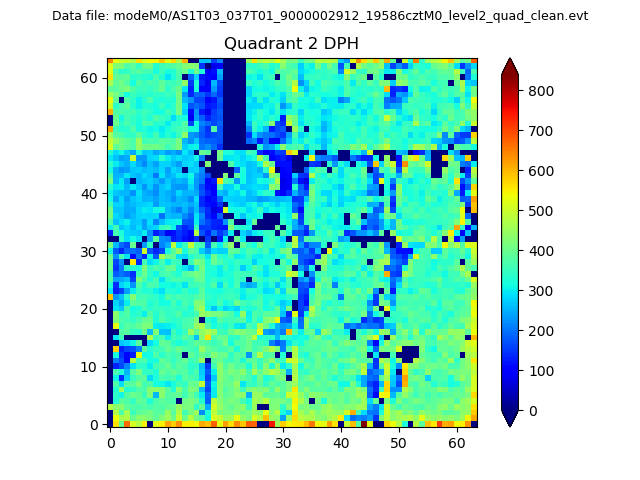
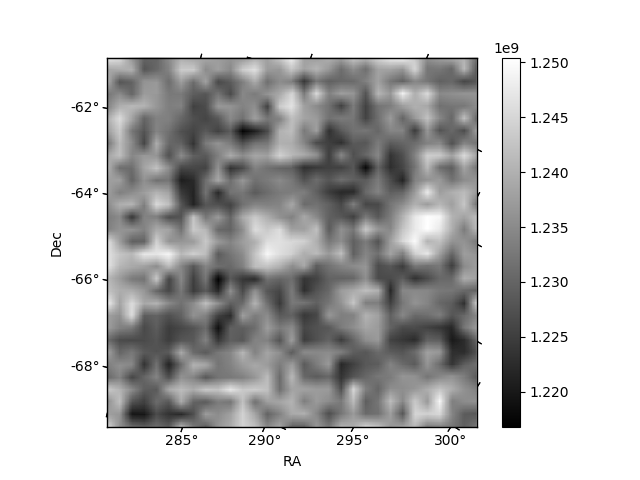
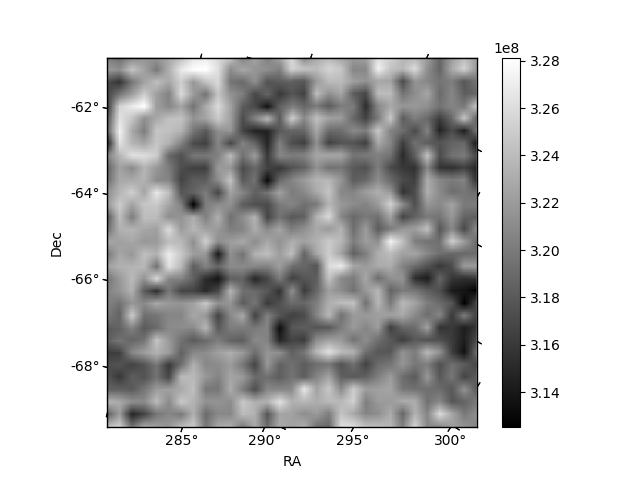
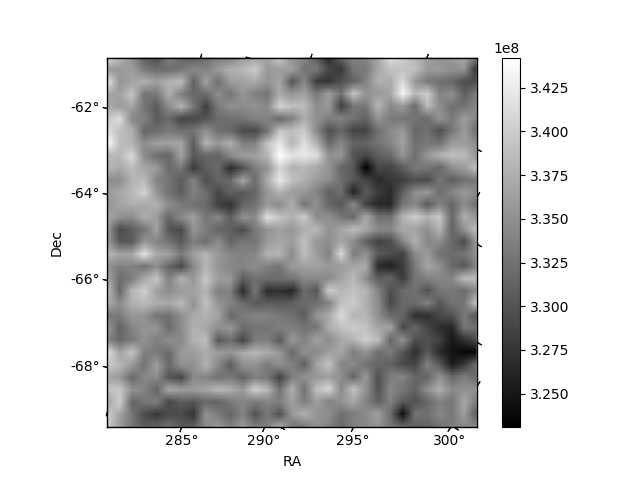
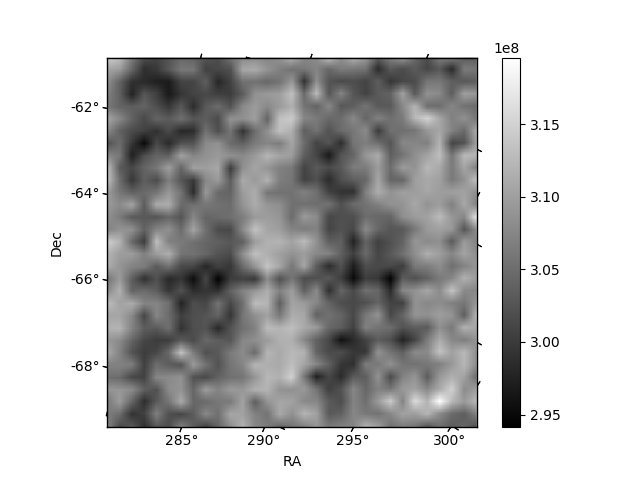
Histogram calculated using DETX and DETY for each event in the final _common_clean file
| Quadrant A | 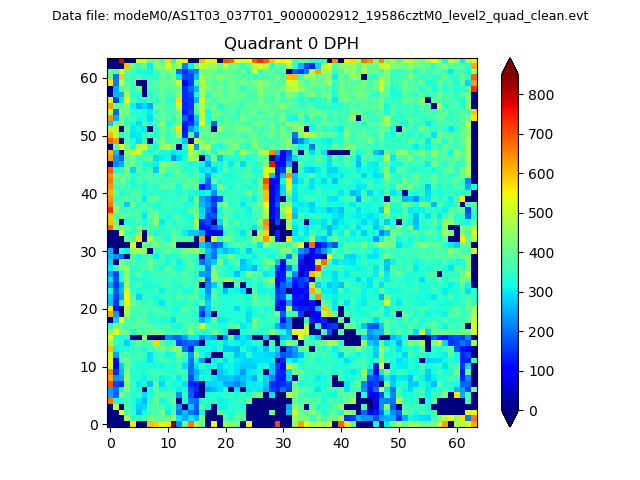 |
 |
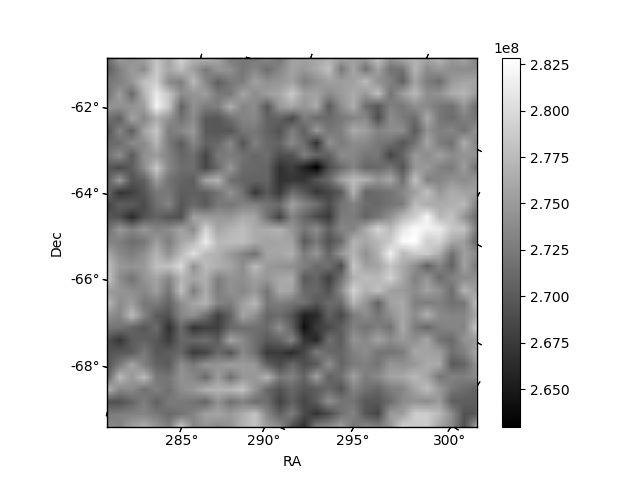
Quadrant B |
|---|---|---|---|
| Quadrant D | 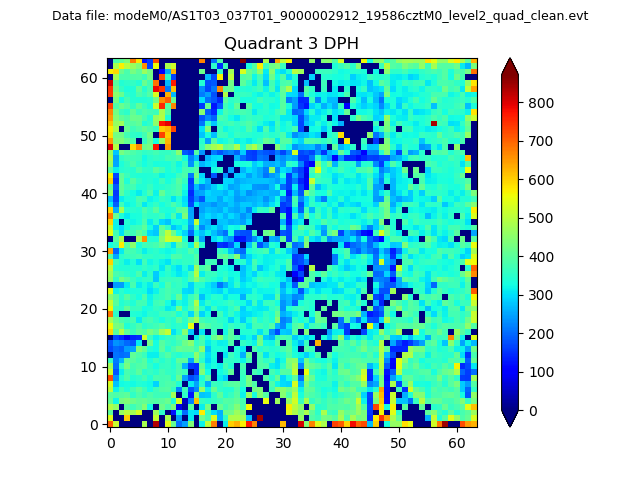 |
 |
Quadrant C |
| Plot type | Count rate plots | Images |
|---|---|---|
| Comparison with Poisson distribution Blue bars denote a histogram of data divided into 1 sec bins. Red curve is a Poisson curve with rate = median count rate of data. |
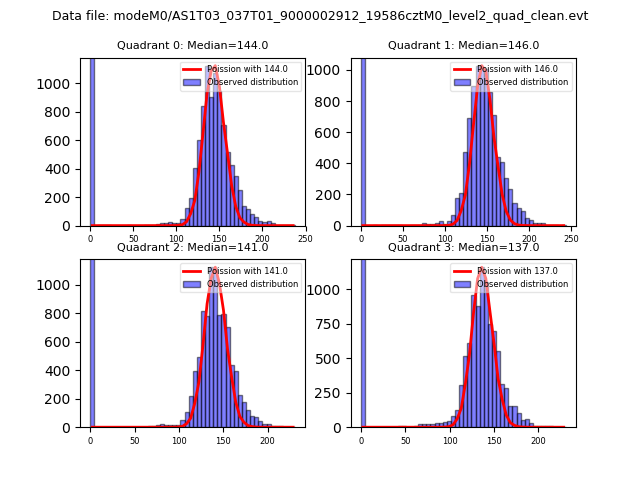 |
 |
| Quadrant-wise count rates Data is divided into 100 sec bins |
 |
|
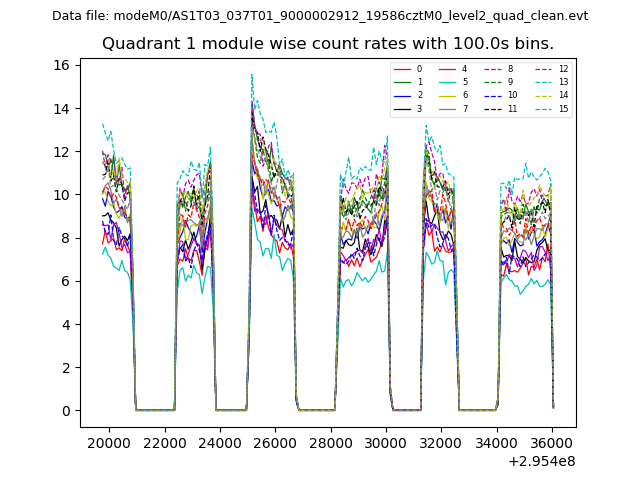
| Module-wise count rates for Quadrant A Data is divided into 100 sec bins |
 |
 |
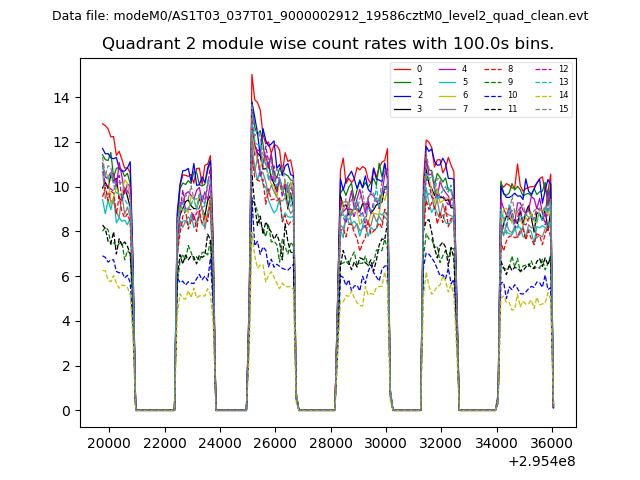
| Module-wise count rates for Quadrant B Data is divided into 100 sec bins |
 |
 |
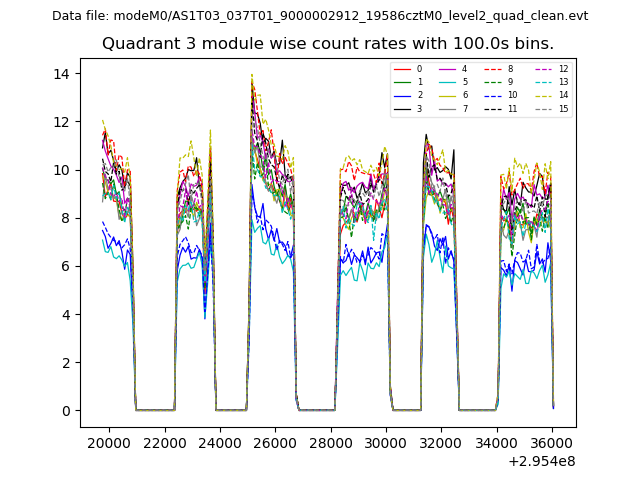
| Module-wise count rates for Quadrant C Data is divided into 100 sec bins |
 |
 |
| Module-wise count rates for Quadrant D Data is divided into 100 sec bins |
 |
 |
| Parameter | Plot |
|---|---|
| CZT HV Monitor | 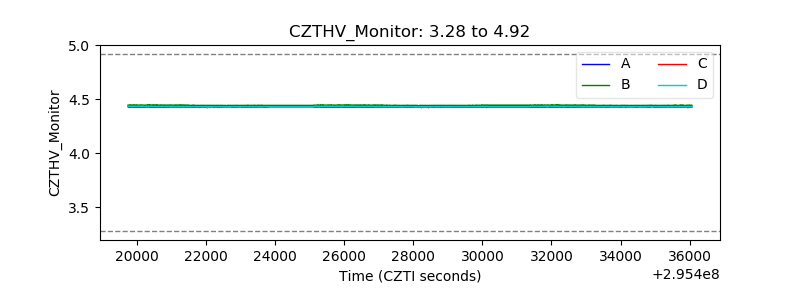 |
| D_VDD | 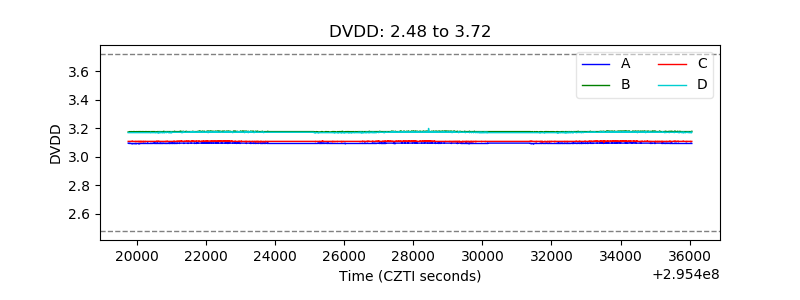 |
| Temperature 1 | 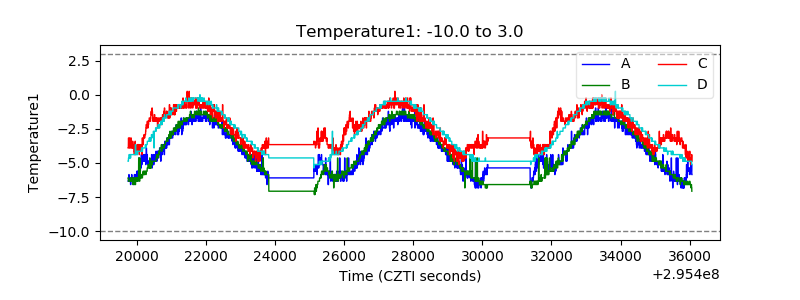 |
| Veto HV Monitor | 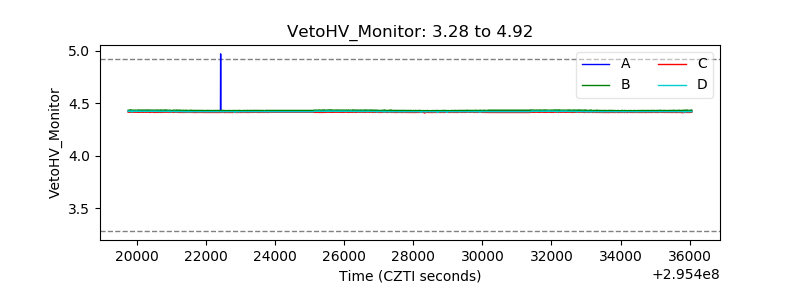 |
| Veto LLD | 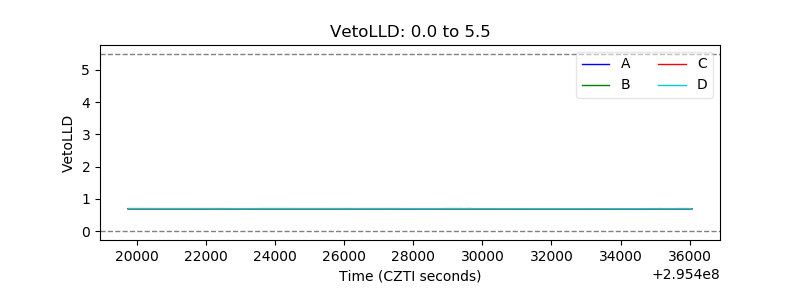 |
| Alpha Counter | 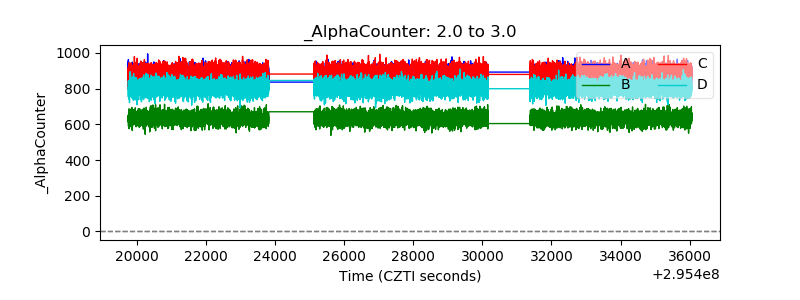 |
| _CPM_Rate | 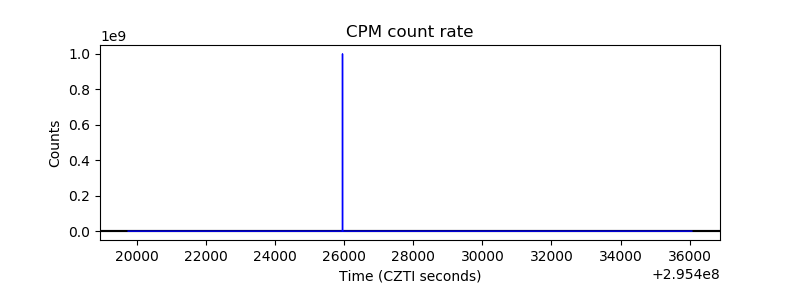 |
| CZT Counter | 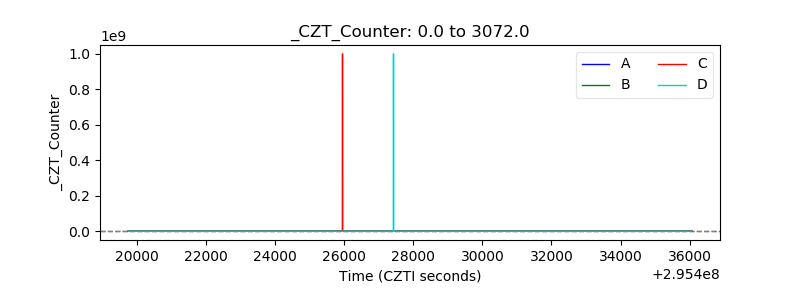 |
| +2.5 Volts monitor |  |
| +5 Volts monitor |  |
| _ROLL_ROT | 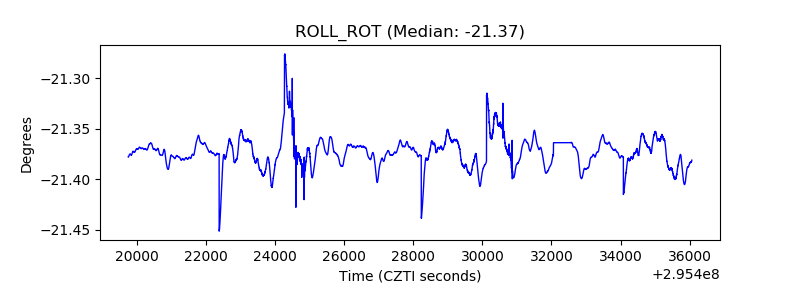 |
| _Roll_DEC | 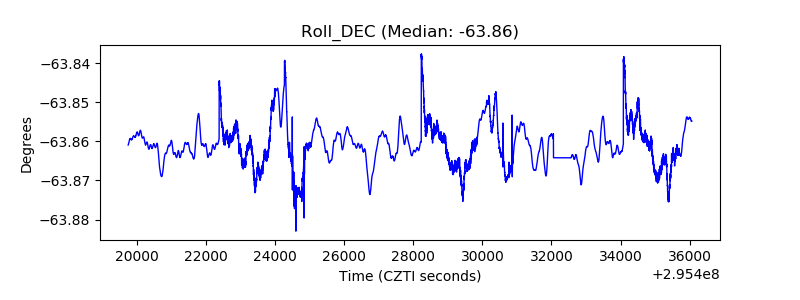 |
| _Roll_RA | 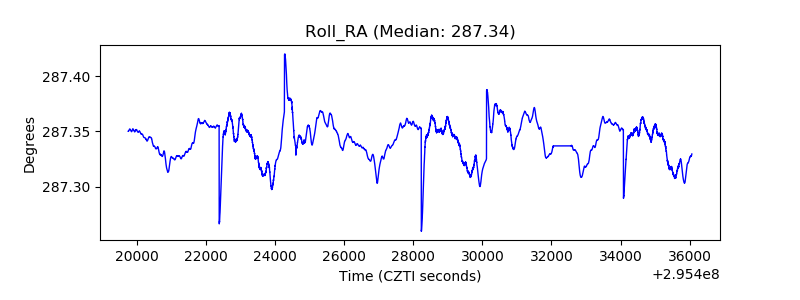 |
| Veto Counter | 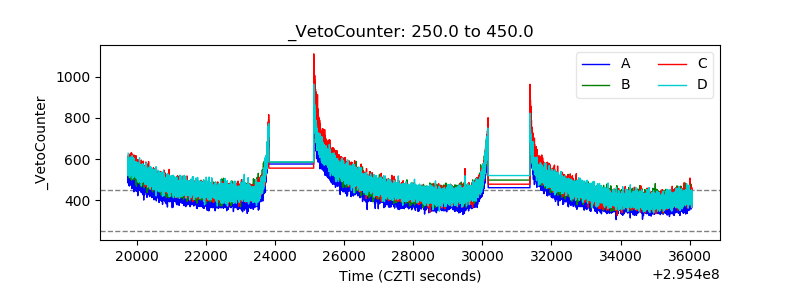 |