| Param | Original file | Final file |
|---|---|---|
| Filename | modeM0/AS1T03_115T01_9000002914_19586cztM0_level2.evt | modeM0/AS1T03_115T01_9000002914_19586cztM0_level2_quad_clean.evt |
| Size (bytes) | 95,981,760 | 23,751,360 |
| Size | 91.5 MB | 22.7 MB |
| Events in quadrant A | 691,821 | 154,653 |
| Events in quadrant B | 693,965 | 158,635 |
| Events in quadrant C | 699,187 | 152,424 |
| Events in quadrant D | 721,287 | 146,291 |
| Mode M9 | |||
|---|---|---|---|
| Quadrant | BADHDUFLAG | Total packets | Discarded packets |
| A | 0 | 5 | 0 |
| B | 0 | 5 | 0 |
| C | 0 | 5 | 0 |
| D | 0 | 5 | 0 |
| Mode SS | |||
|---|---|---|---|
| Quadrant | BADHDUFLAG | Total packets | Discarded packets |
| A | 0 | 28 | 0 |
| B | 0 | 28 | 0 |
| C | 0 | 28 | 0 |
| D | 0 | 28 | 0 |
| Mode M0 | |||
|---|---|---|---|
| Quadrant | BADHDUFLAG | Total packets | Discarded packets |
| A | 0 | 2963 | 1 |
| B | 0 | 2959 | 1 |
| C | 0 | 2996 | 1 |
| D | 0 | 3083 | 2 |
| Quadrant | Total seconds | Saturated seconds | Saturation percentage |
|---|---|---|---|
| A | 1437 | 13 | 0.904662% |
| B | 1437 | 16 | 1.113431% |
| C | 1437 | 15 | 1.043841% |
| D | 1436 | 31 | 2.158774% |
Noise dominated data is calculated using 1-second bins in cleaned event files. If a bin has >2000 counts, and if more than 50% of those come from <1% of pixels, then it is considered to be noise-dominated and hence unusable.
| Quadrant | # 1 sec bins | Bins with >0 counts | Bins with >2000 counts | High rate bins dominated by noise | Noise dominated (total time) | Noise dominated (detector-on time) | Marked lightcurve |
|---|---|---|---|---|---|---|---|
| A | 1437 | 1437 | 0 | 0 | 0.00% | 0.00% | 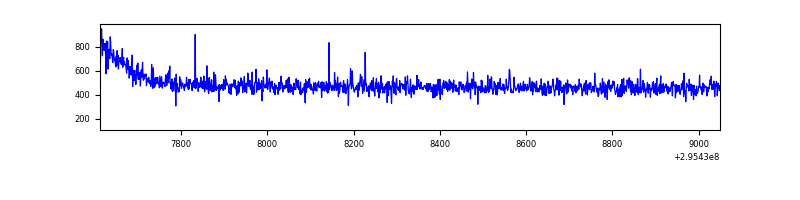 |
| B | 1437 | 1437 | 0 | 0 | 0.00% | 0.00% | 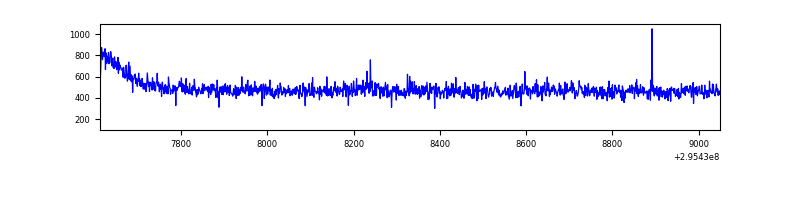 |
| C | 1437 | 1437 | 0 | 0 | 0.00% | 0.00% | 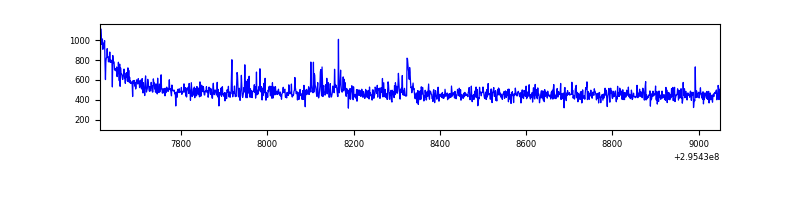 |
| D | 1436 | 1436 | 24 | 24 | 1.67% | 1.67% | 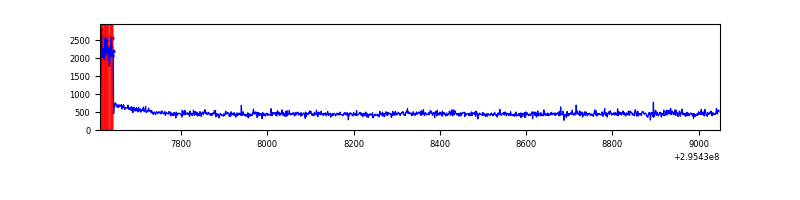 |
Top three noisy pixels from each quadrant. If the there are fewer than three noisy pixels in the level2.evt file, extra rows are filled as -1
| Pixel properties | Quadrant properties | ||||||
|---|---|---|---|---|---|---|---|
| Quadrant | DetID | PixID | Counts | Sigma | Mean | Median | Sigma |
| A | 13 | 254 | 2280 | 55.57 | 179 | 175 | 37.9 |
| A | 0 | 226 | 1593 | 37.43 | 179 | 175 | 37.9 |
| A | 3 | 137 | 1440 | 33.39 | 179 | 175 | 37.9 |
| B | 12 | 111 | 4102 | 109.36 | 175 | 172 | 35.9 |
| B | 11 | 111 | 3815 | 101.37 | 175 | 172 | 35.9 |
| B | 14 | 111 | 3177 | 83.62 | 175 | 172 | 35.9 |
| C | 14 | 238 | 26083 | 640.27 | 167 | 167 | 40.5 |
| C | 9 | 221 | 11511 | 280.26 | 167 | 167 | 40.5 |
| C | 3 | 233 | 5516 | 132.15 | 167 | 167 | 40.5 |
| D | 12 | 0 | 54460 | 1289.67 | 167 | 162 | 42.1 |
| D | 1 | 52 | 28948 | 683.72 | 167 | 162 | 42.1 |
| D | 7 | 238 | 4457 | 102.01 | 167 | 162 | 42.1 |
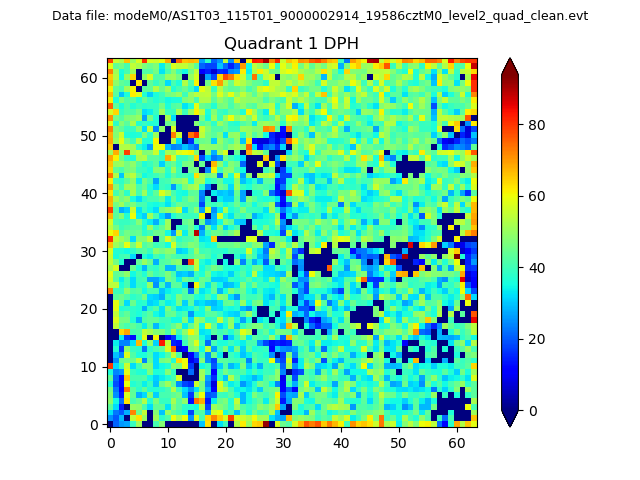
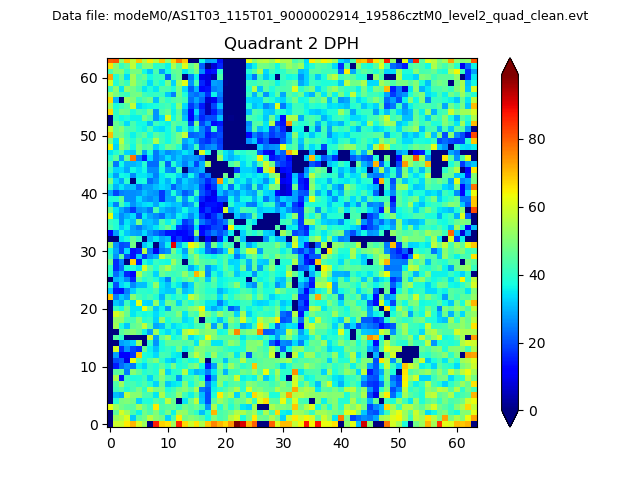
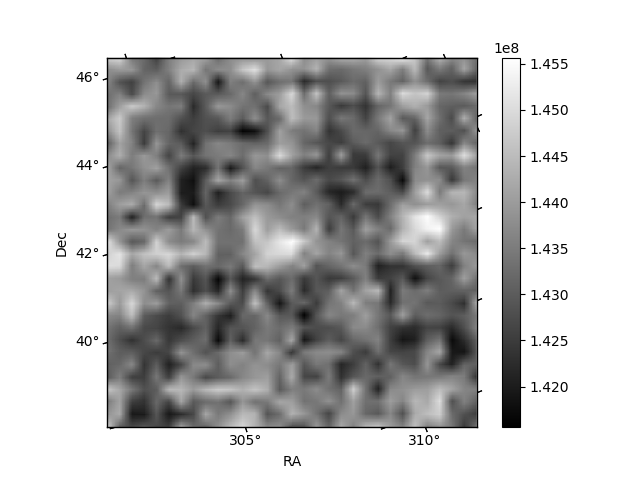
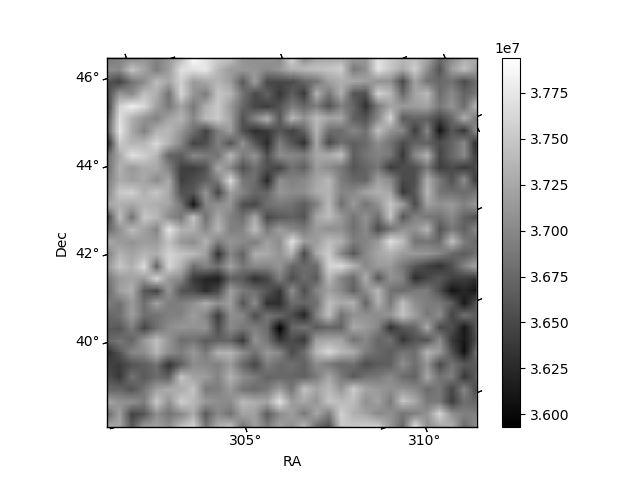
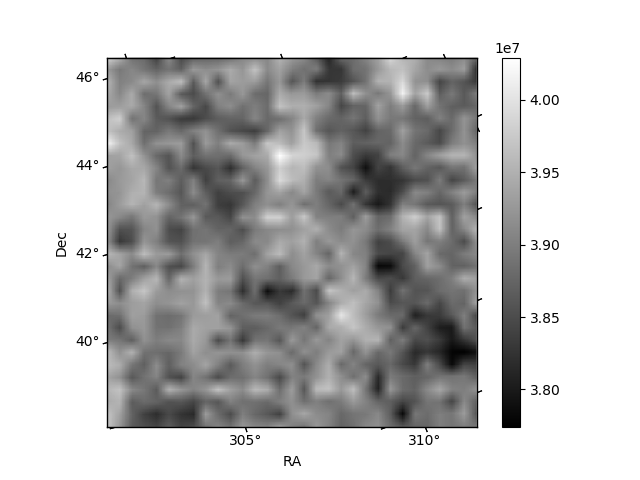
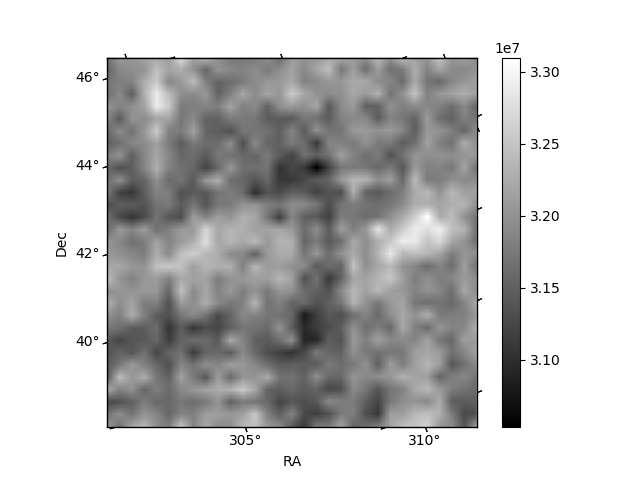
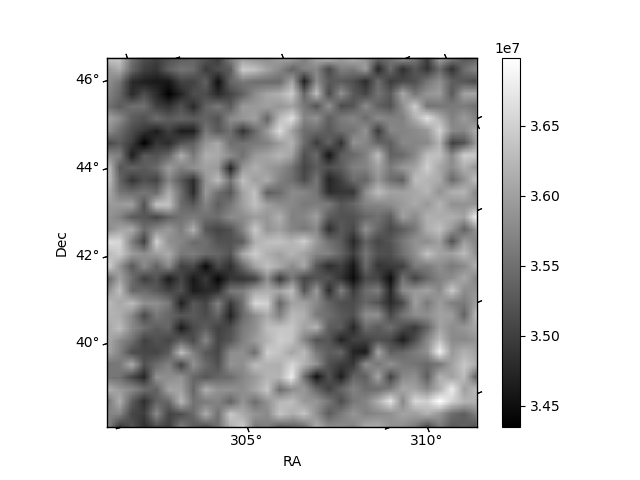
Histogram calculated using DETX and DETY for each event in the final _common_clean file
| Quadrant A |  |
 |
Quadrant B |
|---|---|---|---|
| Quadrant D | 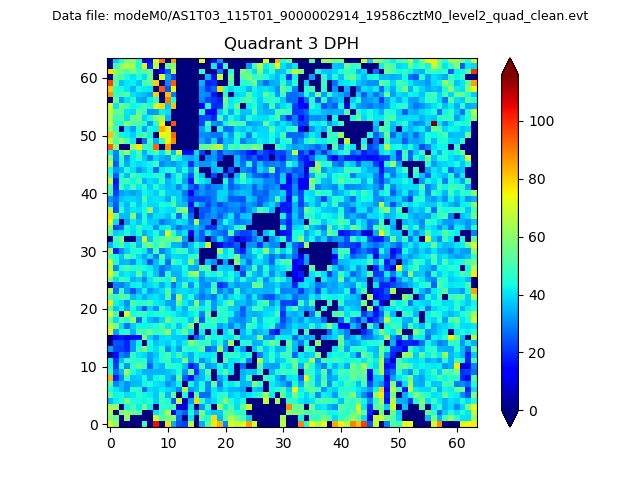 |
 |
Quadrant C |
| Plot type | Count rate plots | Images |
|---|---|---|
| Comparison with Poisson distribution Blue bars denote a histogram of data divided into 1 sec bins. Red curve is a Poisson curve with rate = median count rate of data. |
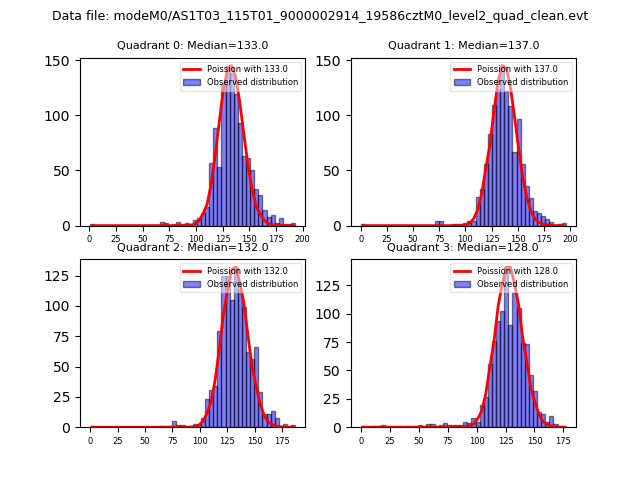 |
 |
| Quadrant-wise count rates Data is divided into 100 sec bins |
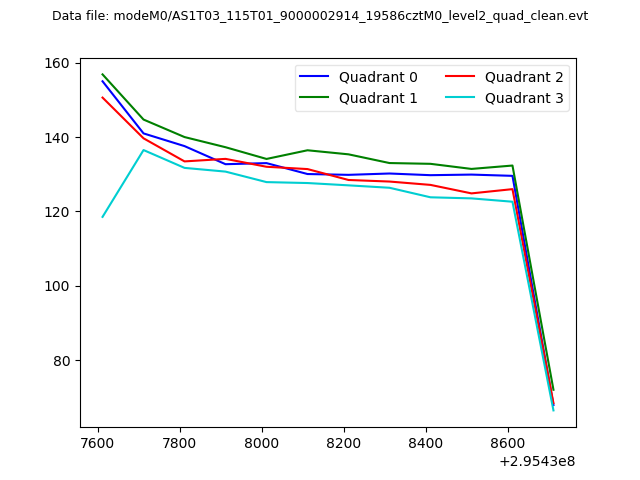 |
|
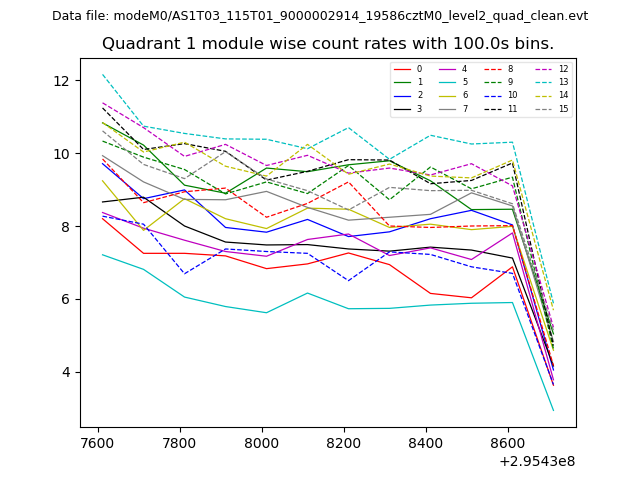
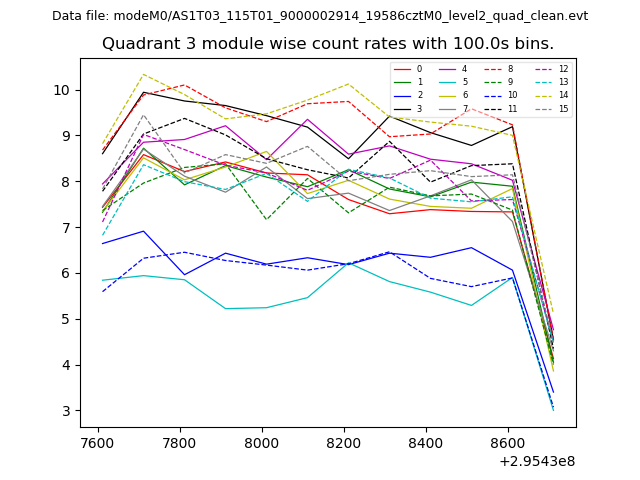
| Module-wise count rates for Quadrant A Data is divided into 100 sec bins |
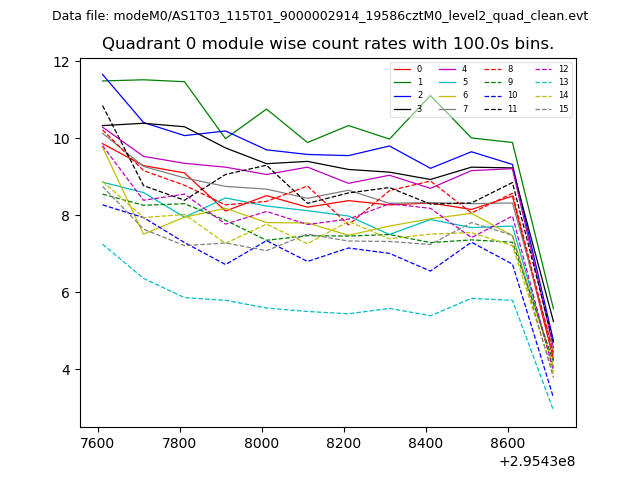 |
 |
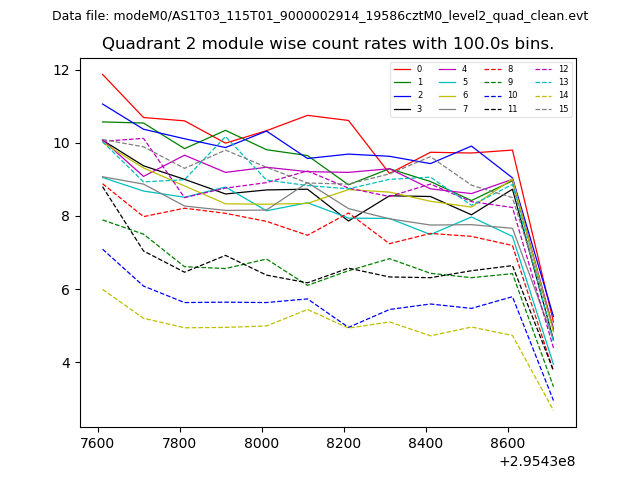
| Module-wise count rates for Quadrant B Data is divided into 100 sec bins |
 |
 |
| Module-wise count rates for Quadrant C Data is divided into 100 sec bins |
 |
 |
| Module-wise count rates for Quadrant D Data is divided into 100 sec bins |
 |
 |
| Parameter | Plot |
|---|---|
| CZT HV Monitor | 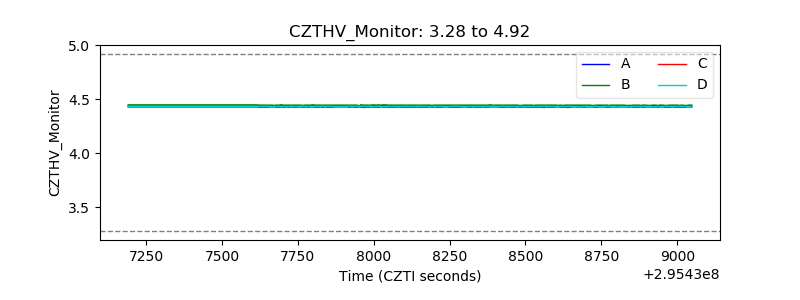 |
| D_VDD | 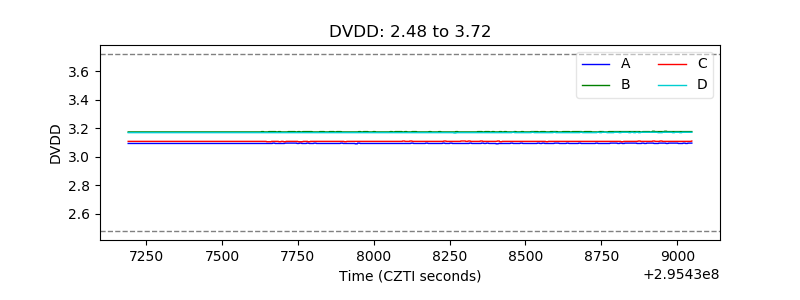 |
| Temperature 1 | 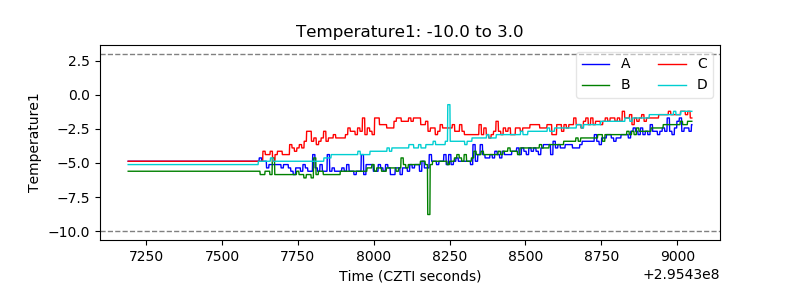 |
| Veto HV Monitor | 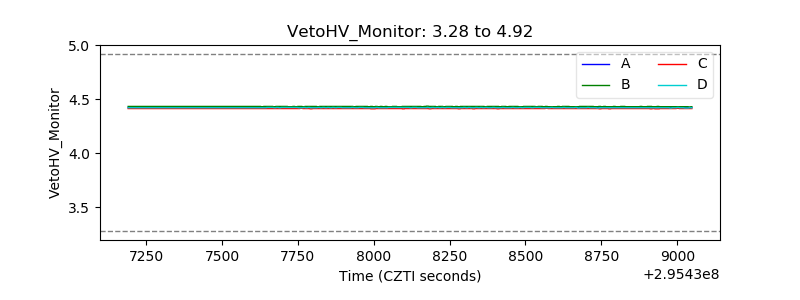 |
| Veto LLD | 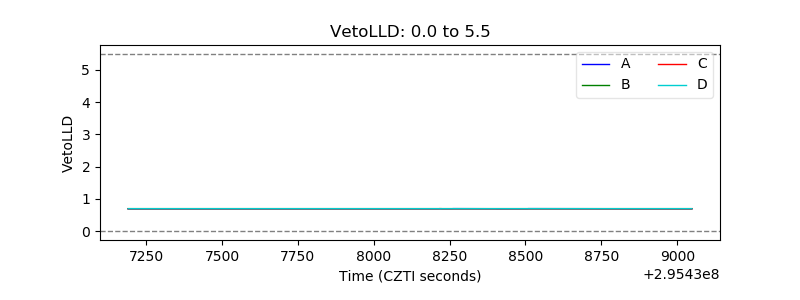 |
| Alpha Counter | 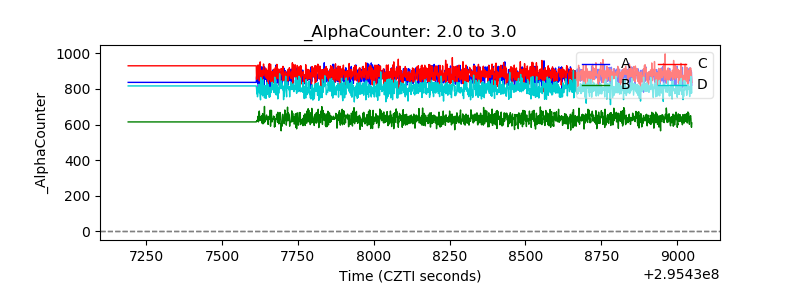 |
| _CPM_Rate | 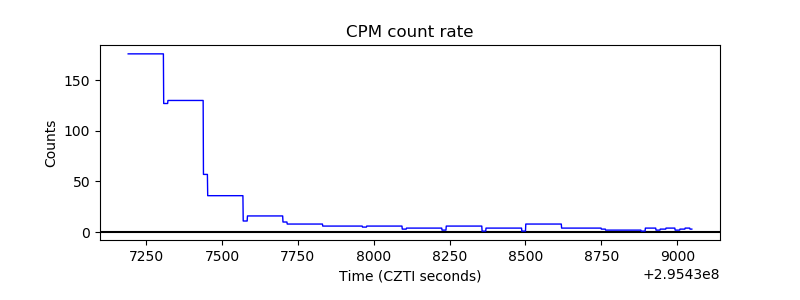 |
| CZT Counter | 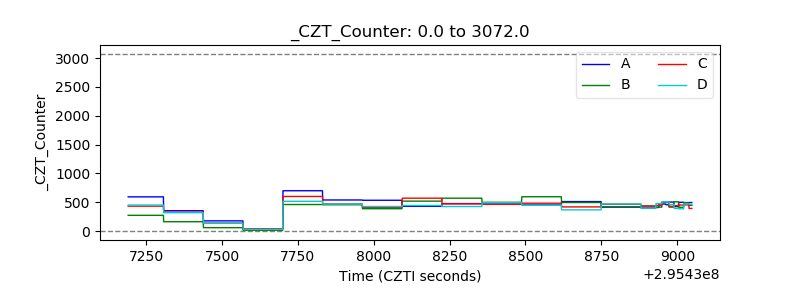 |
| +2.5 Volts monitor |  |
| +5 Volts monitor |  |
| _ROLL_ROT | 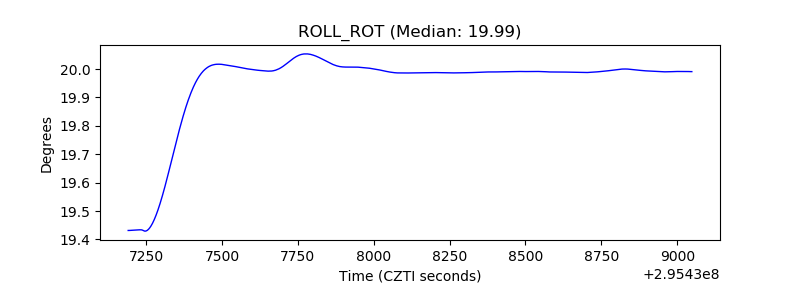 |
| _Roll_DEC |  |
| _Roll_RA | 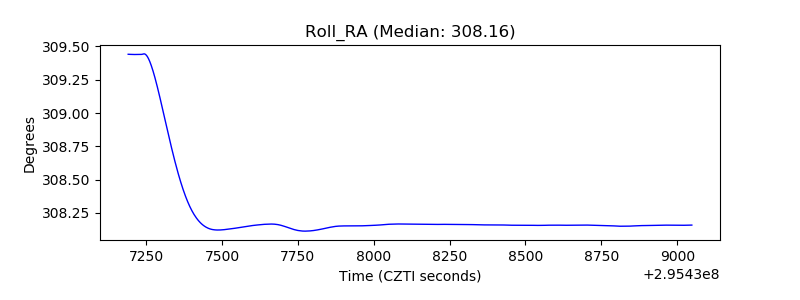 |
| Veto Counter | 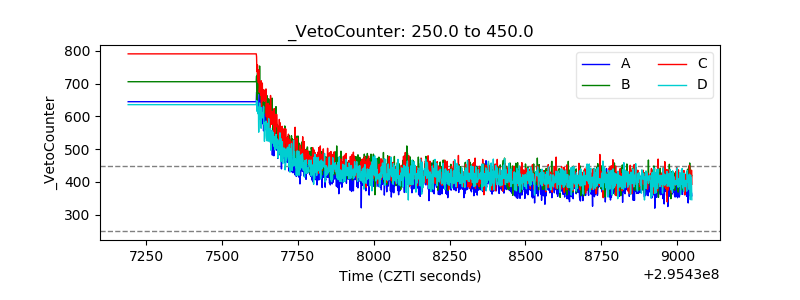 |