| Param | Original file | Final file |
|---|---|---|
| Filename | modeM0/AS1T03_115T01_9000002914_19587cztM0_level2.evt | modeM0/AS1T03_115T01_9000002914_19587cztM0_level2_quad_clean.evt |
| Size (bytes) | 480,830,400 | 81,195,840 |
| Size | 458.6 MB | 77.4 MB |
| Events in quadrant A | 3,229,870 | 503,656 |
| Events in quadrant B | 3,522,217 | 505,967 |
| Events in quadrant C | 3,321,873 | 491,106 |
| Events in quadrant D | 4,022,021 | 480,077 |
| Mode M9 | |||
|---|---|---|---|
| Quadrant | BADHDUFLAG | Total packets | Discarded packets |
| A | 0 | 5 | 0 |
| B | 0 | 5 | 0 |
| C | 0 | 5 | 0 |
| D | 0 | 5 | 0 |
| Mode SS | |||
|---|---|---|---|
| Quadrant | BADHDUFLAG | Total packets | Discarded packets |
| A | 0 | 138 | 0 |
| B | 0 | 138 | 0 |
| C | 0 | 138 | 0 |
| D | 0 | 138 | 0 |
| Mode M0 | |||
|---|---|---|---|
| Quadrant | BADHDUFLAG | Total packets | Discarded packets |
| A | 0 | 14049 | 1 |
| B | 0 | 14757 | 1 |
| C | 0 | 14183 | 1 |
| D | 0 | 16564 | 1 |
| Quadrant | Total seconds | Saturated seconds | Saturation percentage |
|---|---|---|---|
| A | 6860 | 121 | 1.763848% |
| B | 6861 | 172 | 2.506923% |
| C | 6861 | 143 | 2.084244% |
| D | 6861 | 156 | 2.273721% |
Noise dominated data is calculated using 1-second bins in cleaned event files. If a bin has >2000 counts, and if more than 50% of those come from <1% of pixels, then it is considered to be noise-dominated and hence unusable.
| Quadrant | # 1 sec bins | Bins with >0 counts | Bins with >2000 counts | High rate bins dominated by noise | Noise dominated (total time) | Noise dominated (detector-on time) | Marked lightcurve |
|---|---|---|---|---|---|---|---|
| A | 7390 | 6860 | 0 | 0 | 0.00% | 0.00% | 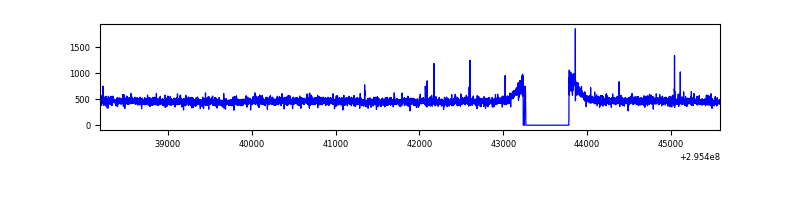 |
| B | 7391 | 6862 | 32 | 32 | 0.43% | 0.47% | 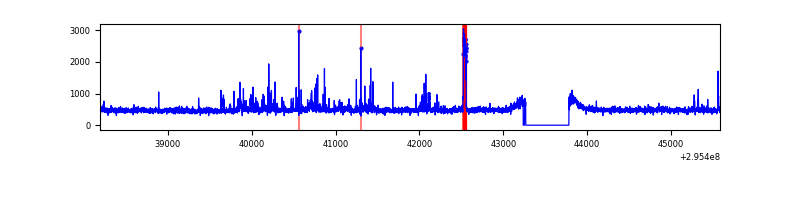 |
| C | 7391 | 6863 | 0 | 0 | 0.00% | 0.00% | 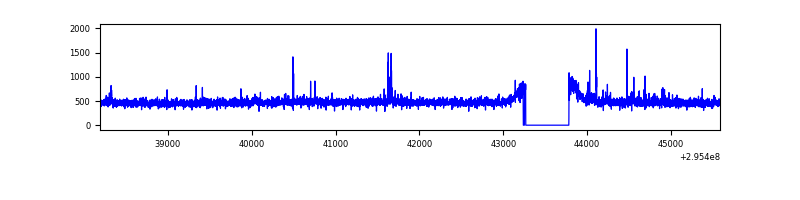 |
| D | 7391 | 6863 | 76 | 76 | 1.03% | 1.11% | 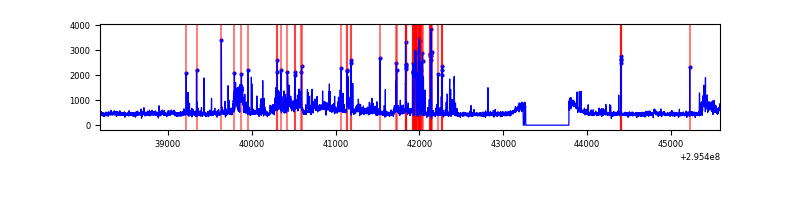 |
Top three noisy pixels from each quadrant. If the there are fewer than three noisy pixels in the level2.evt file, extra rows are filled as -1
| Pixel properties | Quadrant properties | ||||||
|---|---|---|---|---|---|---|---|
| Quadrant | DetID | PixID | Counts | Sigma | Mean | Median | Sigma |
| A | 5 | 16 | 15821 | 89.0 | 833 | 817 | 168.6 |
| A | 13 | 254 | 11549 | 63.66 | 833 | 817 | 168.6 |
| A | 0 | 226 | 7295 | 38.43 | 833 | 817 | 168.6 |
| B | 3 | 64 | 81336 | 505.17 | 824 | 802 | 159.4 |
| B | 15 | 32 | 60467 | 374.26 | 824 | 802 | 159.4 |
| B | 4 | 216 | 50932 | 314.45 | 824 | 802 | 159.4 |
| C | 14 | 238 | 123482 | 664.73 | 791 | 794 | 184.6 |
| C | 5 | 112 | 58186 | 310.95 | 791 | 794 | 184.6 |
| C | 3 | 233 | 42287 | 224.81 | 791 | 794 | 184.6 |
| D | 1 | 52 | 384173 | 1954.46 | 807 | 783 | 196.2 |
| D | 10 | 230 | 121262 | 614.18 | 807 | 783 | 196.2 |
| D | 12 | 218 | 107521 | 544.13 | 807 | 783 | 196.2 |
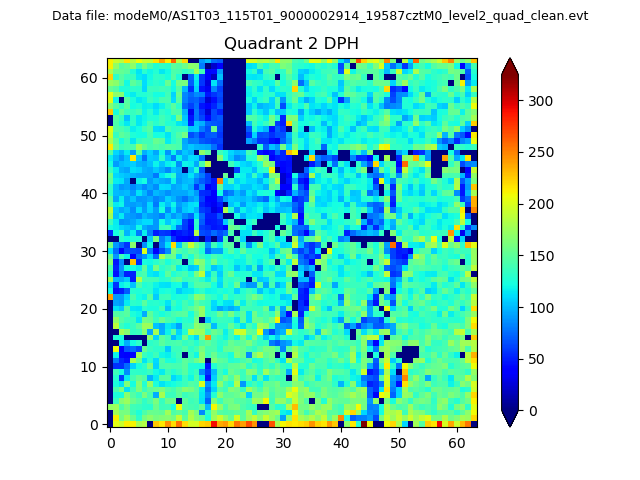
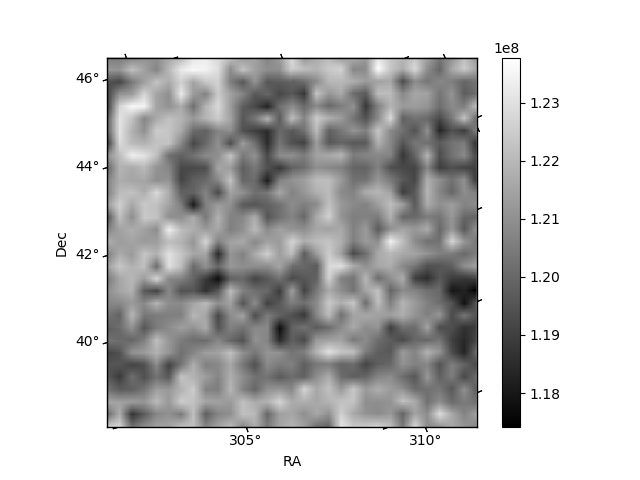
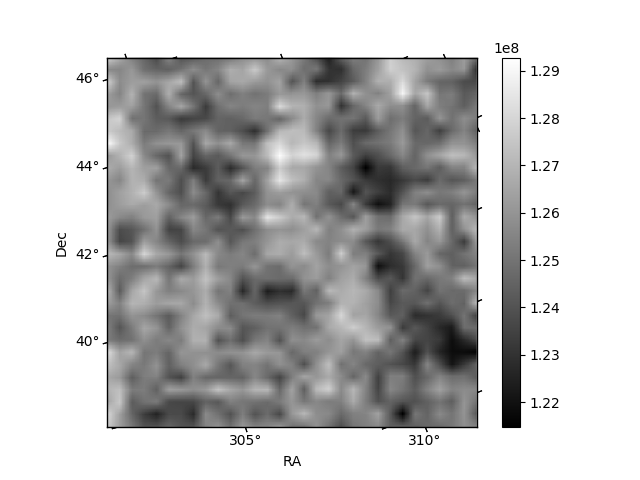
Histogram calculated using DETX and DETY for each event in the final _common_clean file
| Quadrant A | 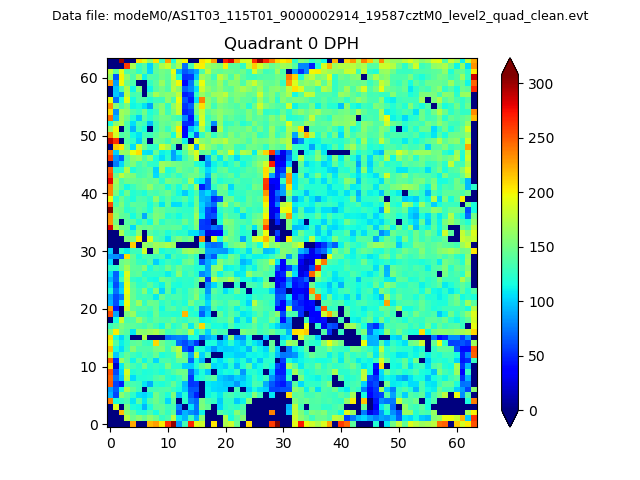 |
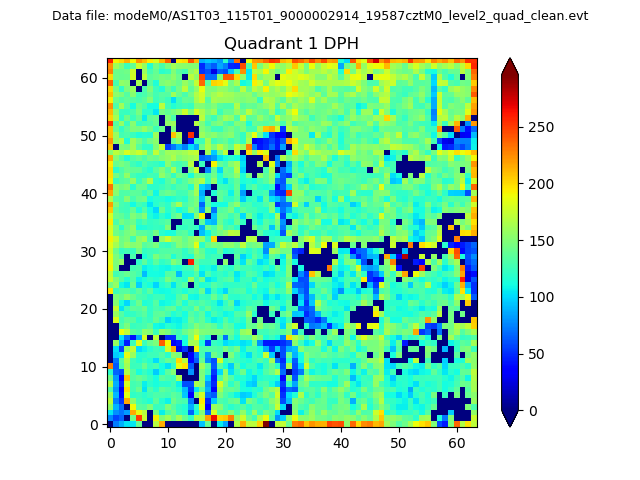 |
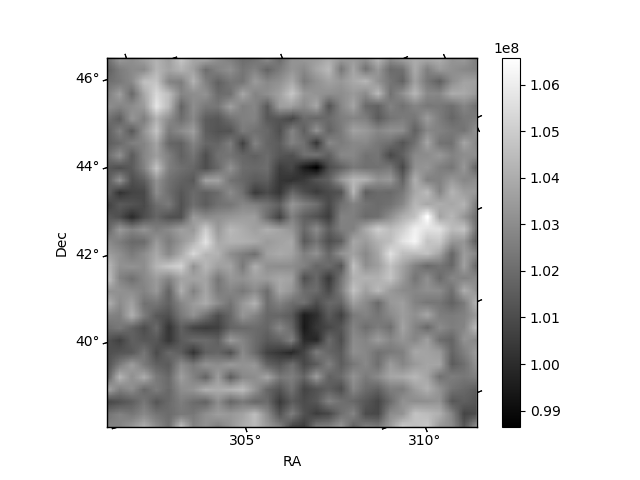
Quadrant B |
|---|---|---|---|
| Quadrant D | 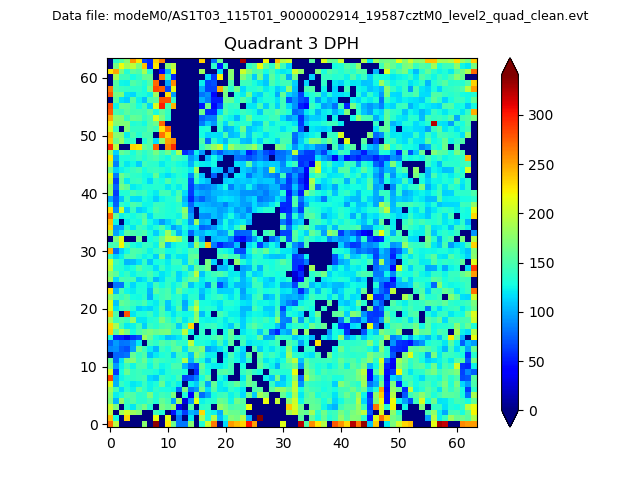 |
 |
Quadrant C |
| Plot type | Count rate plots | Images |
|---|---|---|
| Comparison with Poisson distribution Blue bars denote a histogram of data divided into 1 sec bins. Red curve is a Poisson curve with rate = median count rate of data. |
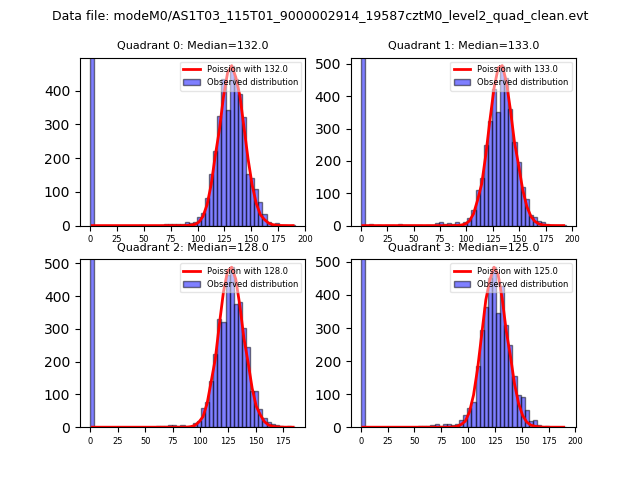 |
 |
| Quadrant-wise count rates Data is divided into 100 sec bins |
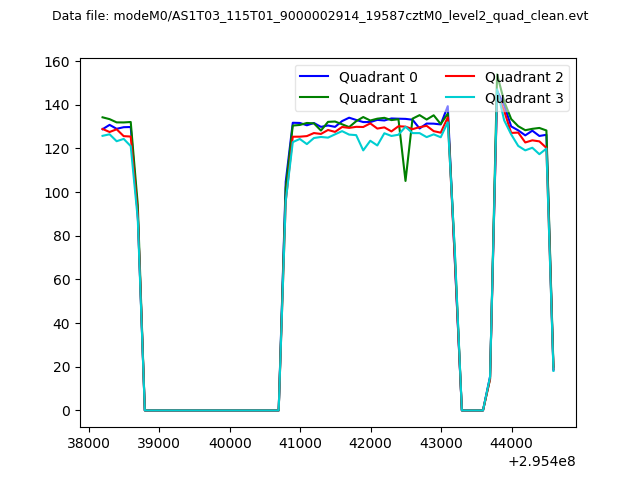 |
|
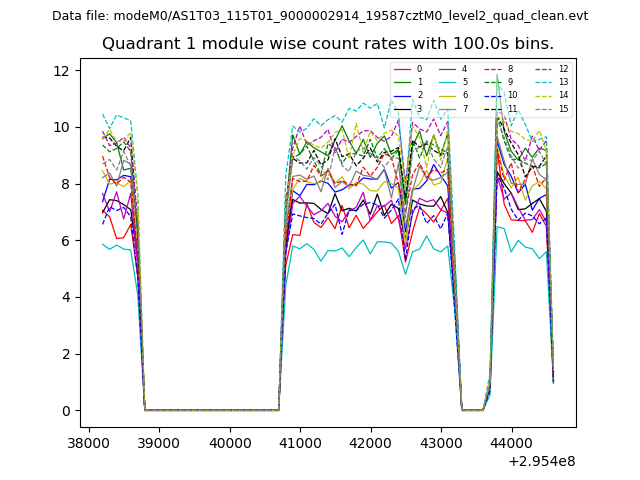
| Module-wise count rates for Quadrant A Data is divided into 100 sec bins |
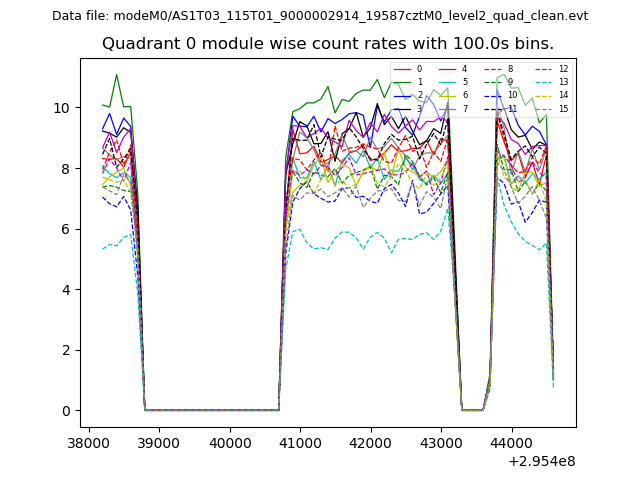 |
 |
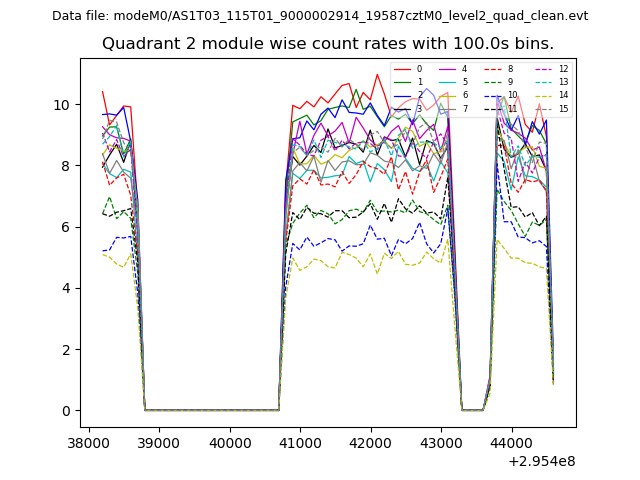
| Module-wise count rates for Quadrant B Data is divided into 100 sec bins |
 |
 |
| Module-wise count rates for Quadrant C Data is divided into 100 sec bins |
 |
 |
| Module-wise count rates for Quadrant D Data is divided into 100 sec bins |
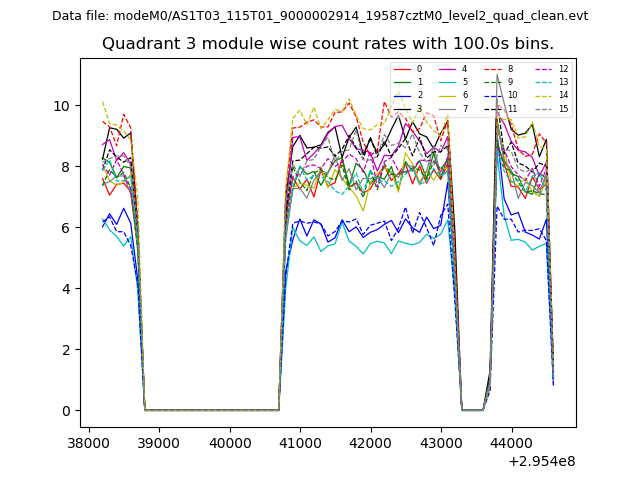 |
 |
| Parameter | Plot |
|---|---|
| CZT HV Monitor | 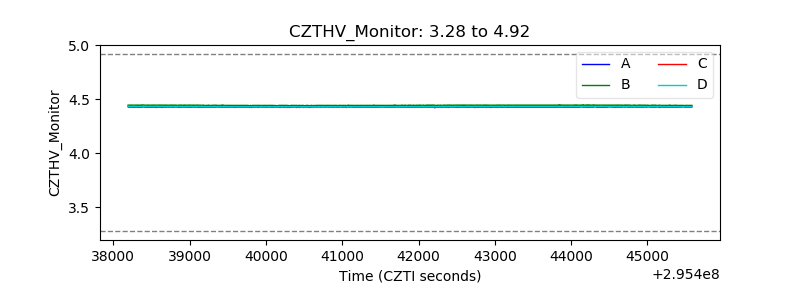 |
| D_VDD | 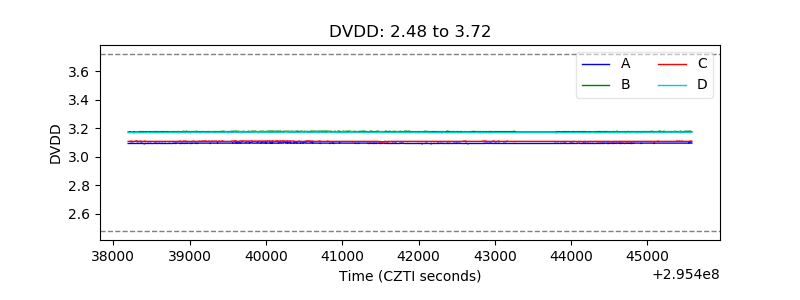 |
| Temperature 1 | 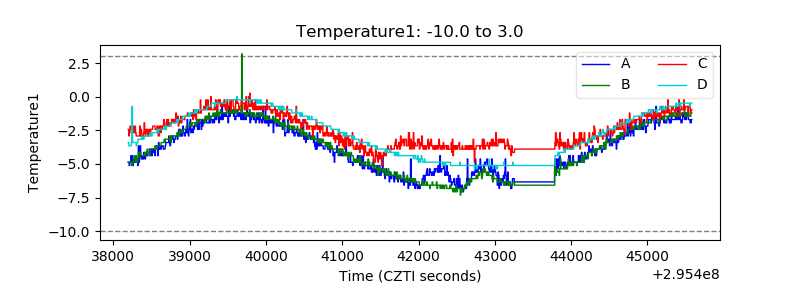 |
| Veto HV Monitor | 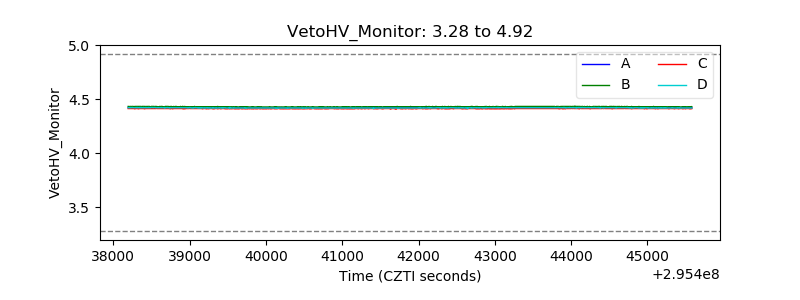 |
| Veto LLD | 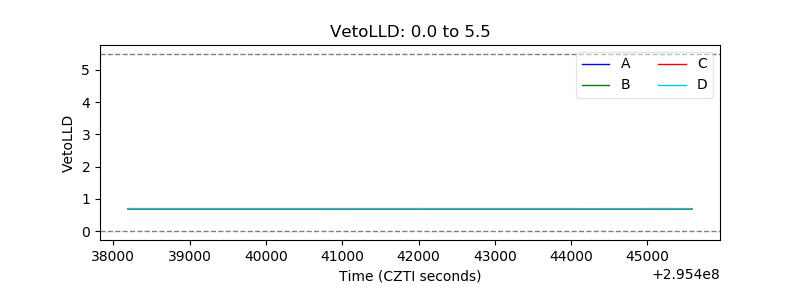 |
| Alpha Counter | 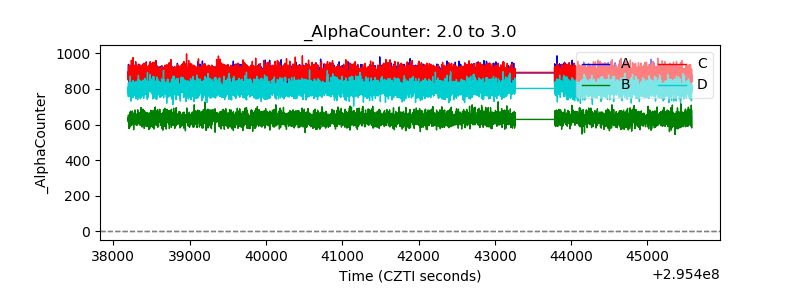 |
| _CPM_Rate | 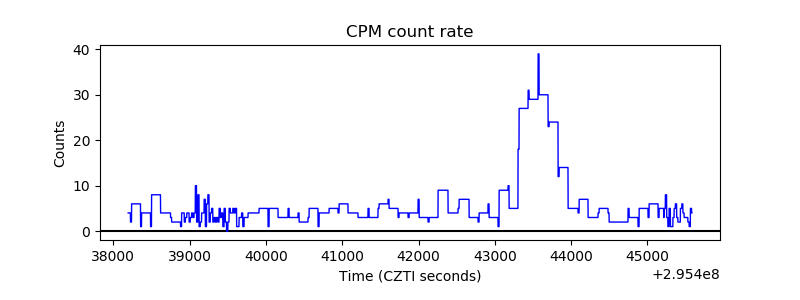 |
| CZT Counter | 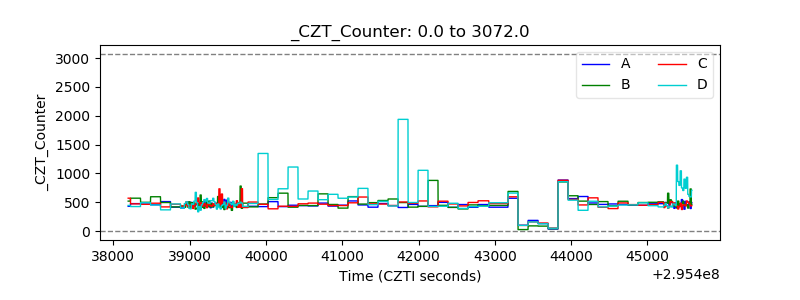 |
| +2.5 Volts monitor |  |
| +5 Volts monitor |  |
| _ROLL_ROT | 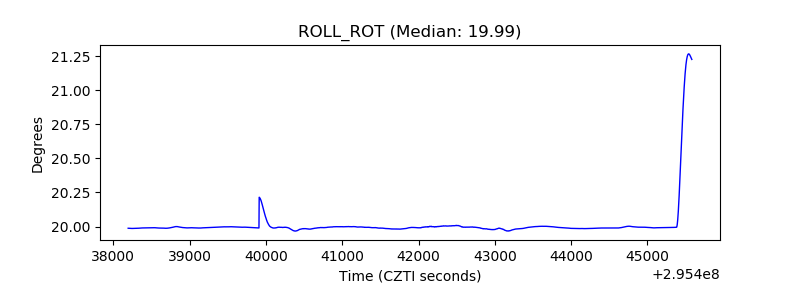 |
| _Roll_DEC | 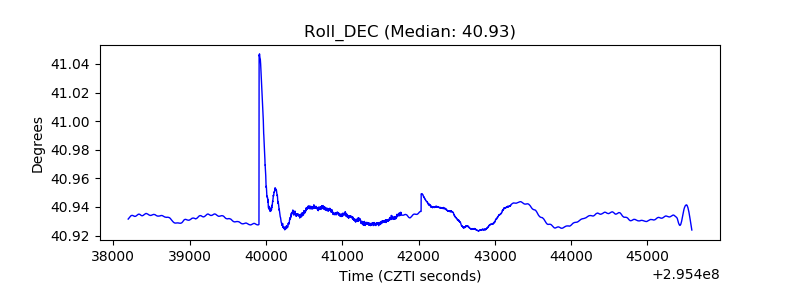 |
| _Roll_RA |  |
| Veto Counter | 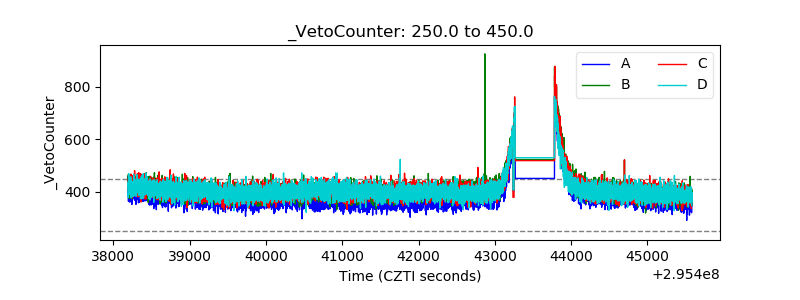 |