| Param | Original file | Final file |
|---|---|---|
| Filename | modeM0/AS1T03_115T01_9000002914_19588cztM0_level2.evt | modeM0/AS1T03_115T01_9000002914_19588cztM0_level2_quad_clean.evt |
| Size (bytes) | 533,329,920 | 83,502,720 |
| Size | 508.6 MB | 79.6 MB |
| Events in quadrant A | 3,494,422 | 512,855 |
| Events in quadrant B | 3,886,650 | 517,114 |
| Events in quadrant C | 3,574,945 | 498,061 |
| Events in quadrant D | 4,698,655 | 490,515 |
| Mode M9 | |||
|---|---|---|---|
| Quadrant | BADHDUFLAG | Total packets | Discarded packets |
| A | 0 | 1 | 0 |
| B | 0 | 1 | 0 |
| C | 0 | 1 | 0 |
| D | 0 | 1 | 0 |
| Mode SS | |||
|---|---|---|---|
| Quadrant | BADHDUFLAG | Total packets | Discarded packets |
| A | 0 | 148 | 0 |
| B | 0 | 148 | 0 |
| C | 0 | 148 | 0 |
| D | 0 | 148 | 0 |
| Mode M0 | |||
|---|---|---|---|
| Quadrant | BADHDUFLAG | Total packets | Discarded packets |
| A | 0 | 15166 | 1 |
| B | 0 | 16181 | 1 |
| C | 0 | 15343 | 1 |
| D | 0 | 18923 | 1 |
| Quadrant | Total seconds | Saturated seconds | Saturation percentage |
|---|---|---|---|
| A | 7322 | 255 | 3.482655% |
| B | 7323 | 319 | 4.356138% |
| C | 7323 | 288 | 3.932814% |
| D | 7323 | 352 | 4.806773% |
Noise dominated data is calculated using 1-second bins in cleaned event files. If a bin has >2000 counts, and if more than 50% of those come from <1% of pixels, then it is considered to be noise-dominated and hence unusable.
| Quadrant | # 1 sec bins | Bins with >0 counts | Bins with >2000 counts | High rate bins dominated by noise | Noise dominated (total time) | Noise dominated (detector-on time) | Marked lightcurve |
|---|---|---|---|---|---|---|---|
| A | 7422 | 7322 | 0 | 0 | 0.00% | 0.00% | 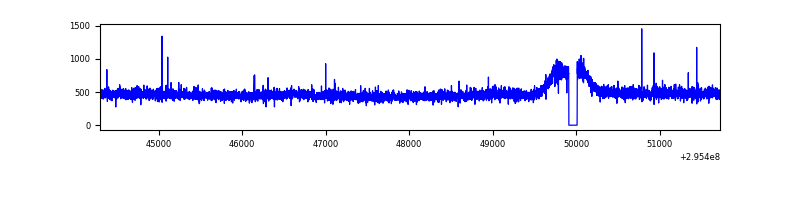 |
| B | 7423 | 7323 | 16 | 16 | 0.22% | 0.22% | 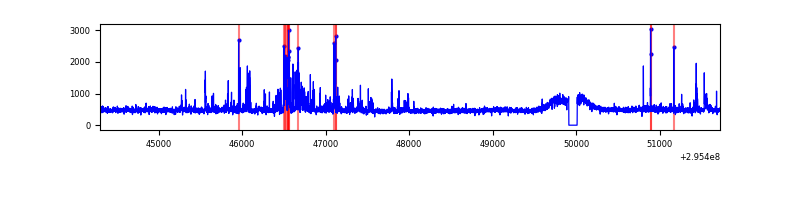 |
| C | 7423 | 7323 | 2 | 2 | 0.03% | 0.03% | 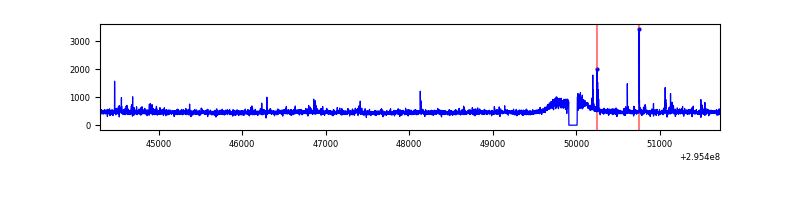 |
| D | 7423 | 7323 | 91 | 91 | 1.23% | 1.24% | 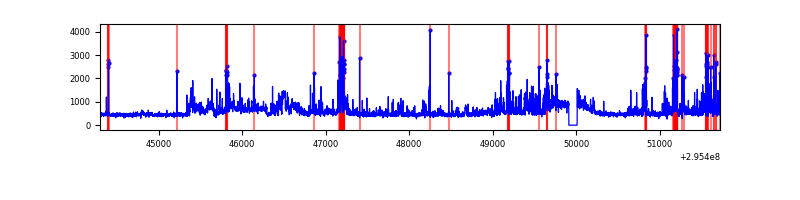 |
Top three noisy pixels from each quadrant. If the there are fewer than three noisy pixels in the level2.evt file, extra rows are filled as -1
| Pixel properties | Quadrant properties | ||||||
|---|---|---|---|---|---|---|---|
| Quadrant | DetID | PixID | Counts | Sigma | Mean | Median | Sigma |
| A | 13 | 254 | 12227 | 61.92 | 899 | 879 | 183.3 |
| A | 15 | 191 | 9543 | 47.27 | 899 | 879 | 183.3 |
| A | 0 | 226 | 7719 | 37.32 | 899 | 879 | 183.3 |
| B | 15 | 32 | 238635 | 1383.79 | 888 | 863 | 171.8 |
| B | 0 | 198 | 33697 | 191.09 | 888 | 863 | 171.8 |
| B | 0 | 197 | 30330 | 171.49 | 888 | 863 | 171.8 |
| C | 14 | 238 | 131459 | 651.39 | 853 | 857 | 200.5 |
| C | 5 | 112 | 76922 | 379.38 | 853 | 857 | 200.5 |
| C | 3 | 233 | 31587 | 153.27 | 853 | 857 | 200.5 |
| D | 1 | 52 | 835363 | 3919.3 | 868 | 839 | 212.9 |
| D | 7 | 38 | 184237 | 861.32 | 868 | 839 | 212.9 |
| D | 7 | 238 | 116388 | 542.67 | 868 | 839 | 212.9 |
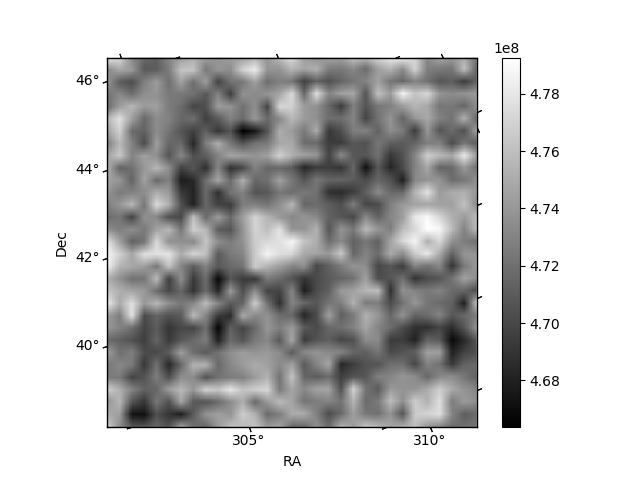
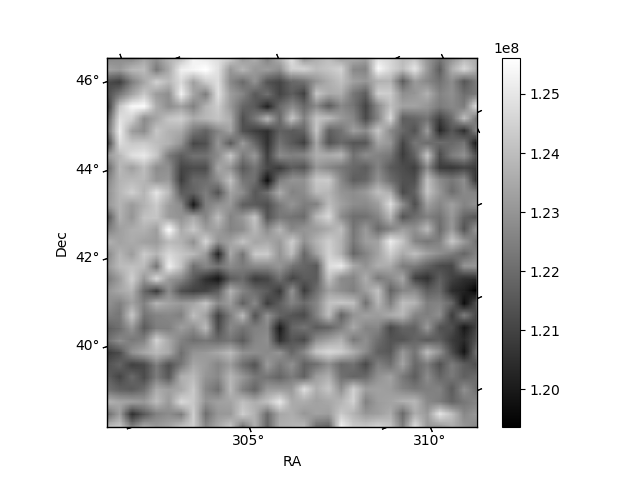
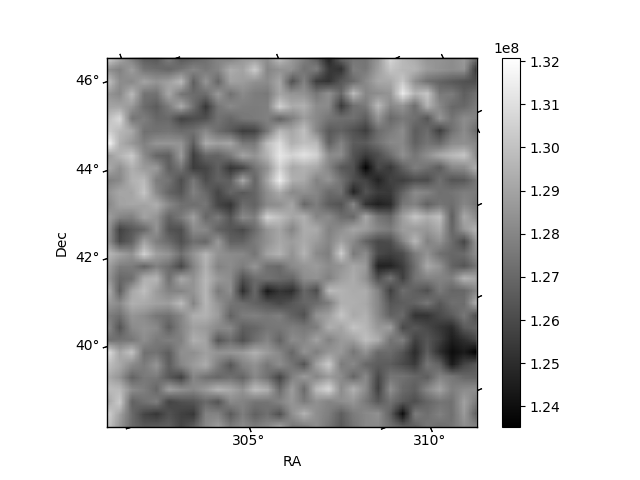
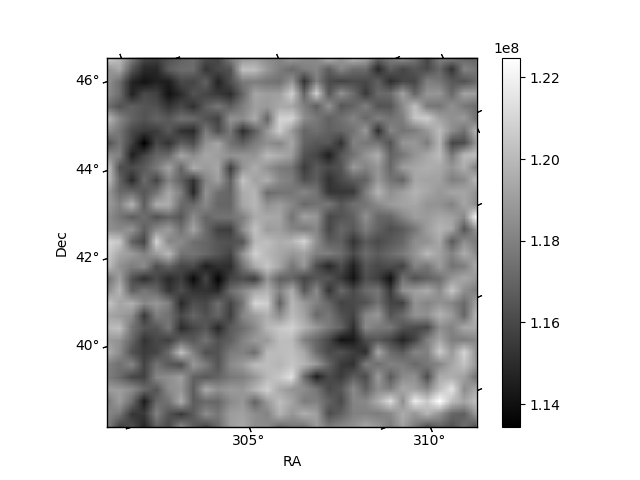
Histogram calculated using DETX and DETY for each event in the final _common_clean file
| Quadrant A | 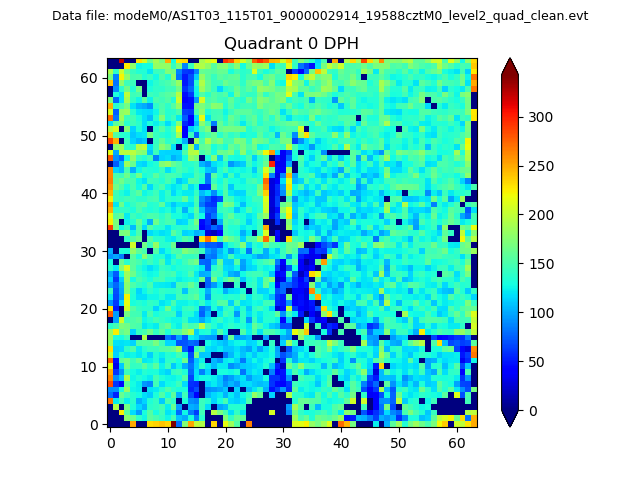 |
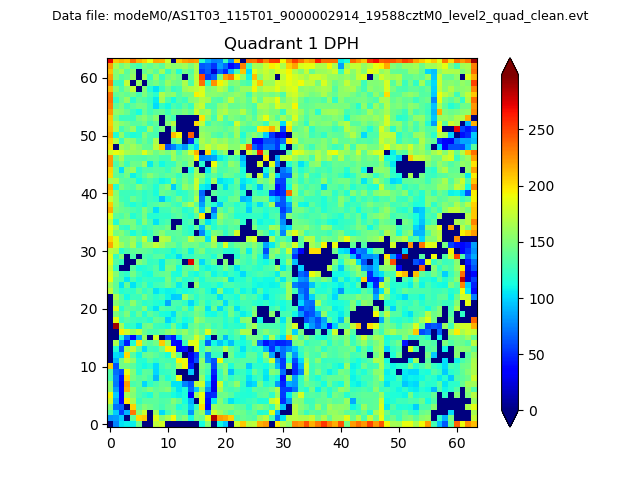 |
Quadrant B |
|---|---|---|---|
| Quadrant D | 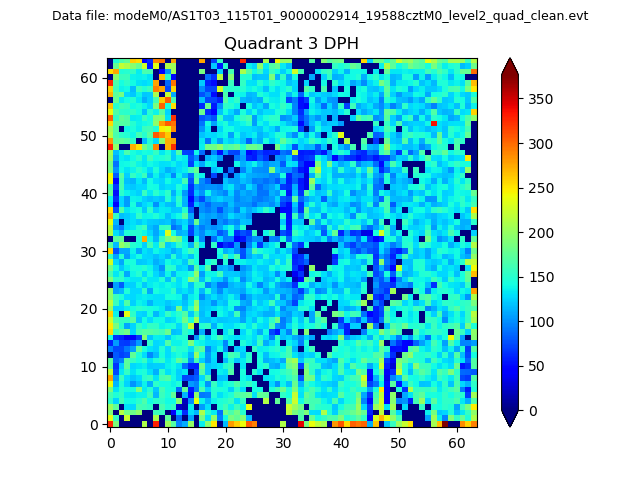 |
 |
Quadrant C |
| Plot type | Count rate plots | Images |
|---|---|---|
| Comparison with Poisson distribution Blue bars denote a histogram of data divided into 1 sec bins. Red curve is a Poisson curve with rate = median count rate of data. |
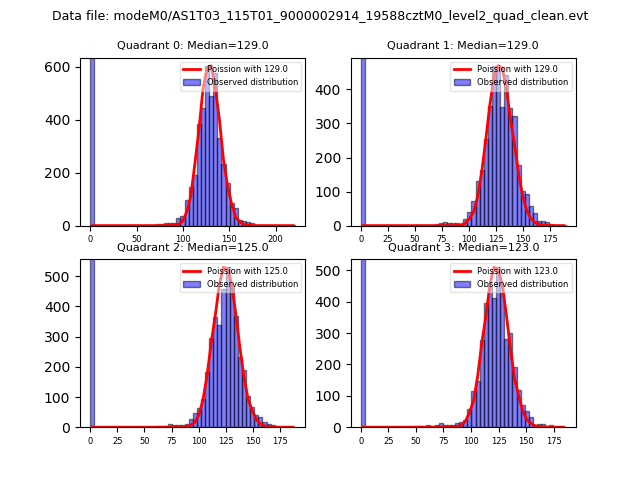 |
 |
| Quadrant-wise count rates Data is divided into 100 sec bins |
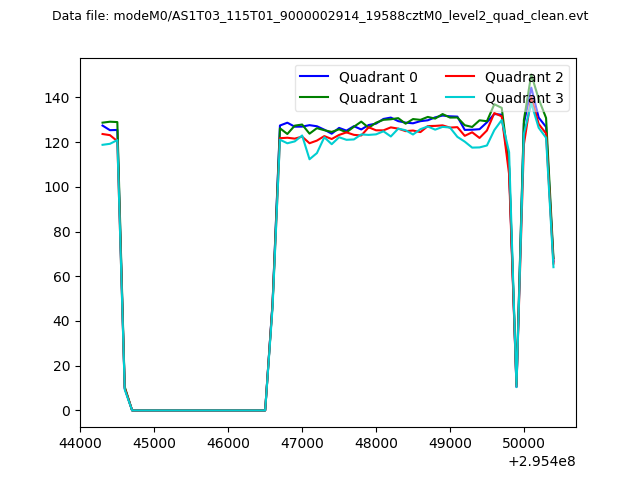 |
|
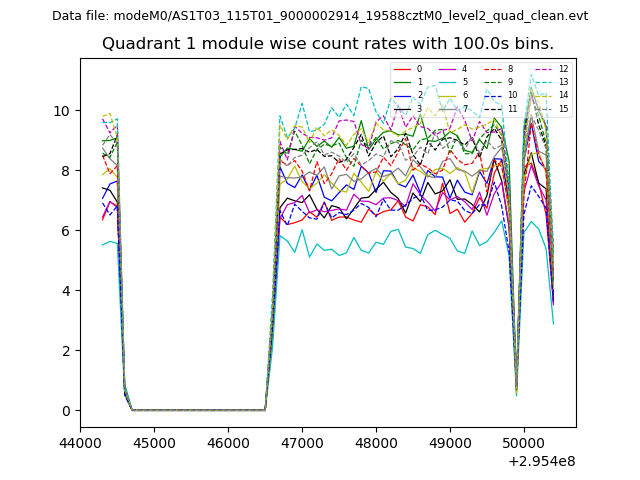
| Module-wise count rates for Quadrant A Data is divided into 100 sec bins |
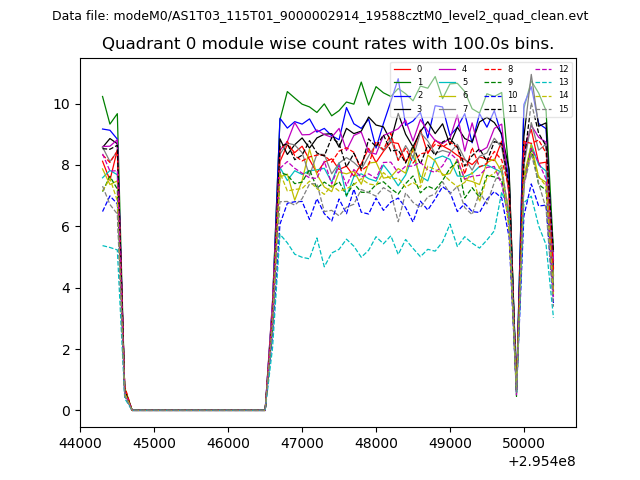 |
 |
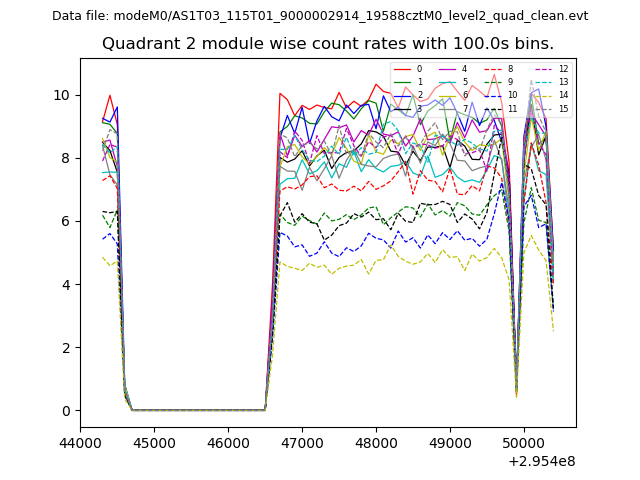
| Module-wise count rates for Quadrant B Data is divided into 100 sec bins |
 |
 |
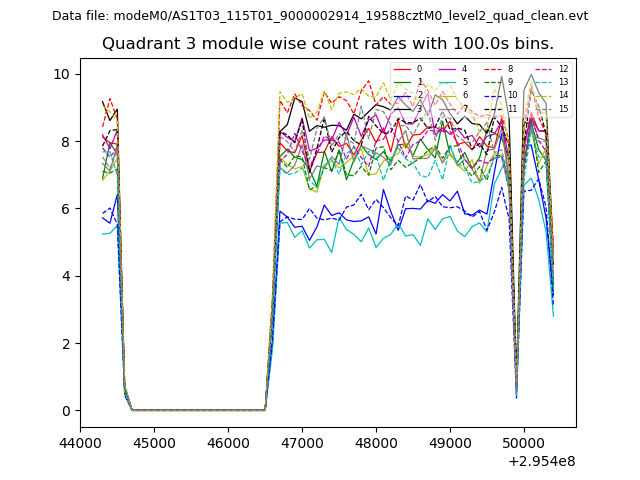
| Module-wise count rates for Quadrant C Data is divided into 100 sec bins |
 |
 |
| Module-wise count rates for Quadrant D Data is divided into 100 sec bins |
 |
 |
| Parameter | Plot |
|---|---|
| CZT HV Monitor | 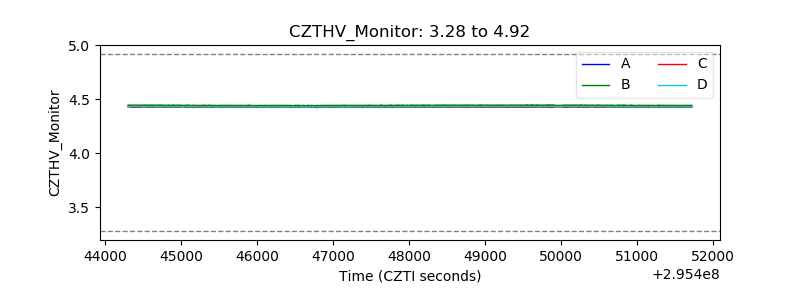 |
| D_VDD | 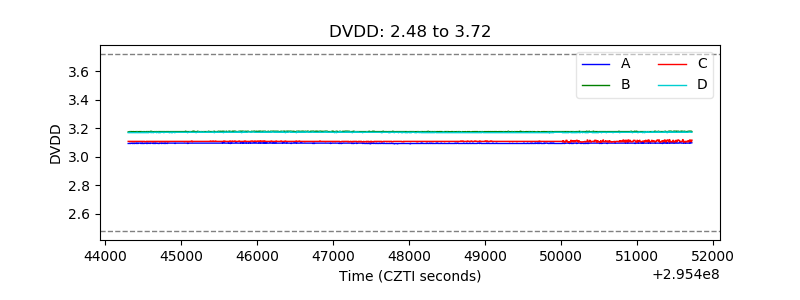 |
| Temperature 1 | 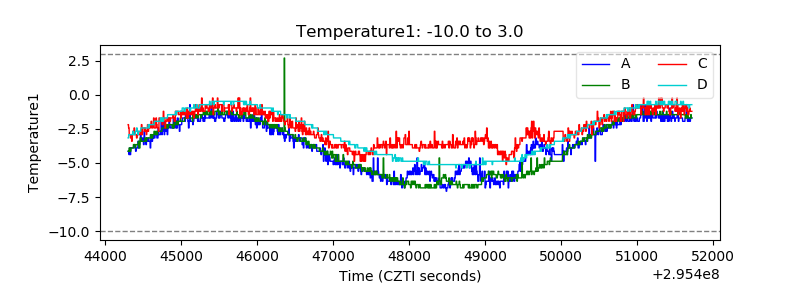 |
| Veto HV Monitor | 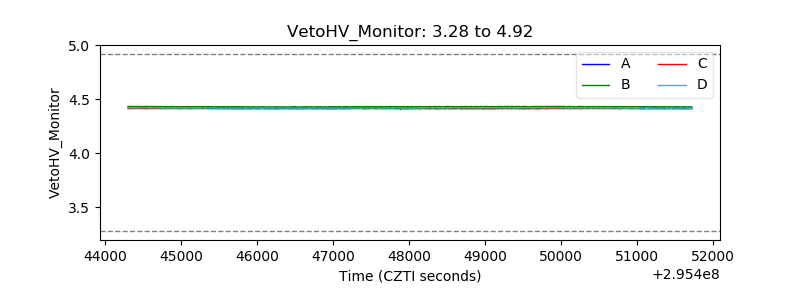 |
| Veto LLD | 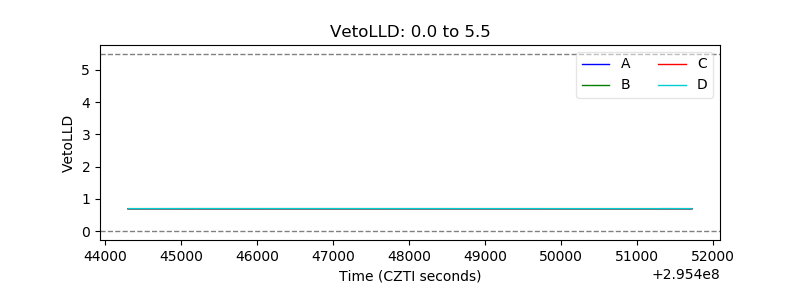 |
| Alpha Counter | 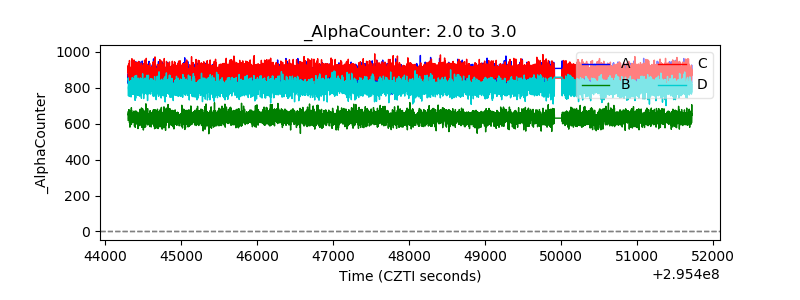 |
| _CPM_Rate | 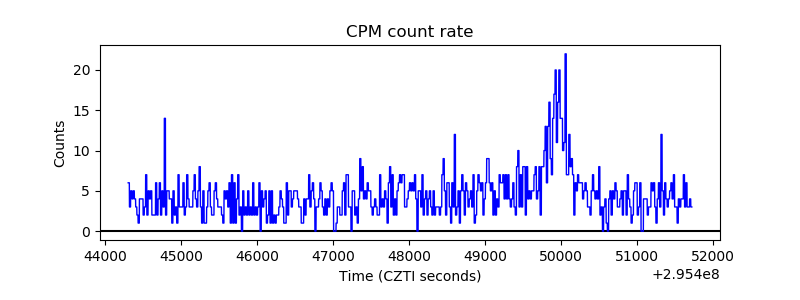 |
| CZT Counter | 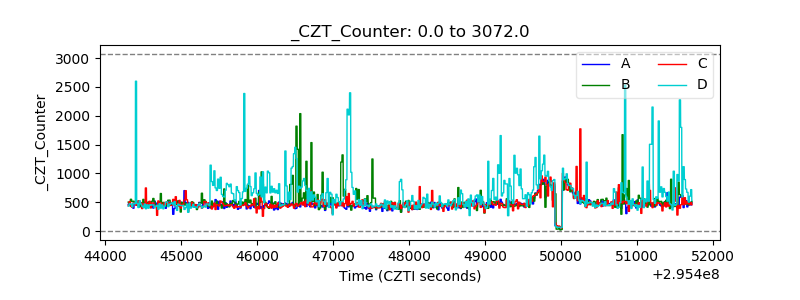 |
| +2.5 Volts monitor | 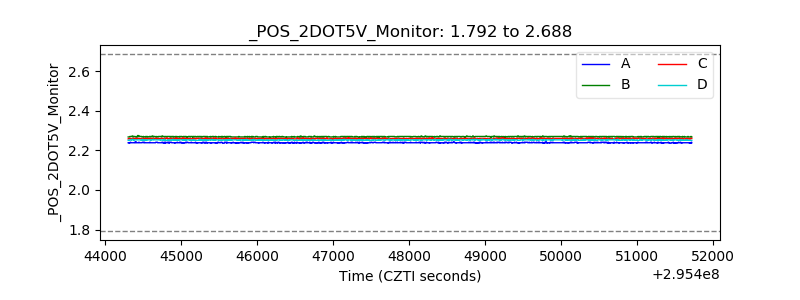 |
| +5 Volts monitor |  |
| _ROLL_ROT | 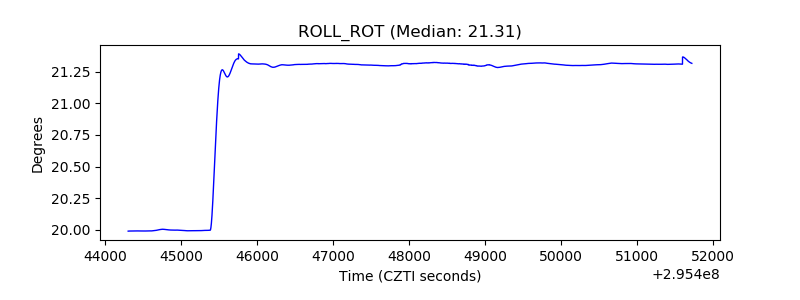 |
| _Roll_DEC | 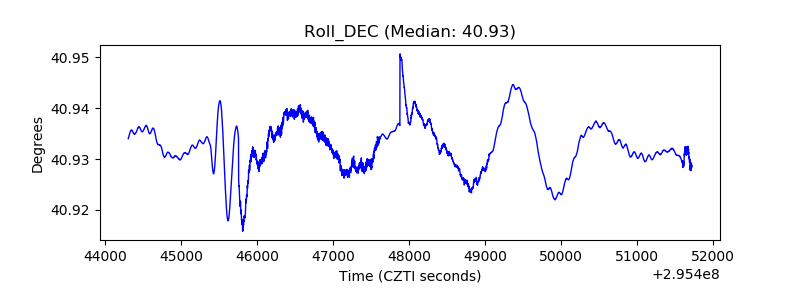 |
| _Roll_RA | 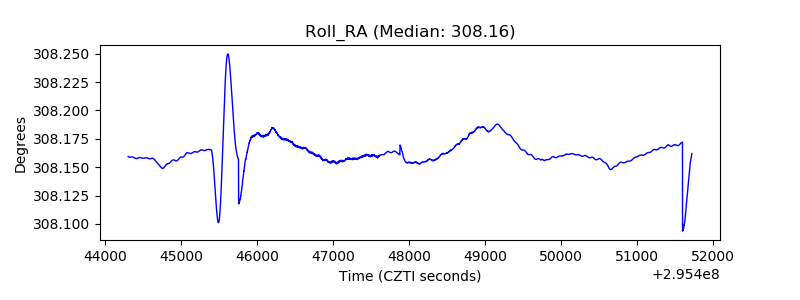 |
| Veto Counter | 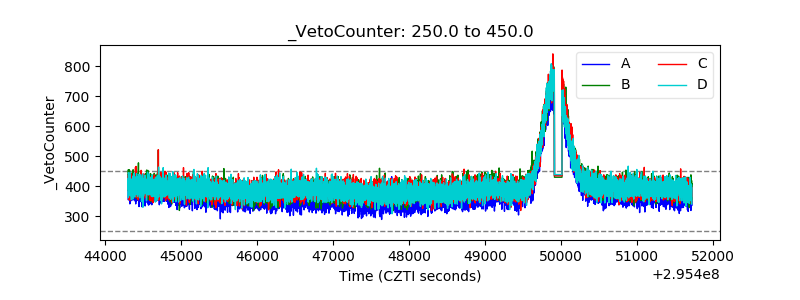 |