| Param | Original file | Final file |
|---|---|---|
| Filename | modeM0/AS1T03_115T01_9000002914_19589cztM0_level2.evt | modeM0/AS1T03_115T01_9000002914_19589cztM0_level2_quad_clean.evt |
| Size (bytes) | 505,180,800 | 76,138,560 |
| Size | 481.8 MB | 72.6 MB |
| Events in quadrant A | 3,399,426 | 457,701 |
| Events in quadrant B | 3,593,271 | 461,423 |
| Events in quadrant C | 3,527,825 | 442,290 |
| Events in quadrant D | 4,286,460 | 439,195 |
| Mode M9 | |||
|---|---|---|---|
| Quadrant | BADHDUFLAG | Total packets | Discarded packets |
| A | 0 | 2 | 0 |
| B | 0 | 2 | 0 |
| C | 0 | 2 | 0 |
| D | 0 | 2 | 0 |
| Mode SS | |||
|---|---|---|---|
| Quadrant | BADHDUFLAG | Total packets | Discarded packets |
| A | 0 | 148 | 0 |
| B | 0 | 148 | 0 |
| C | 0 | 148 | 0 |
| D | 0 | 148 | 0 |
| Mode M0 | |||
|---|---|---|---|
| Quadrant | BADHDUFLAG | Total packets | Discarded packets |
| A | 0 | 14851 | 1 |
| B | 0 | 15254 | 1 |
| C | 0 | 15054 | 1 |
| D | 0 | 17371 | 1 |
| Quadrant | Total seconds | Saturated seconds | Saturation percentage |
|---|---|---|---|
| A | 7246 | 95 | 1.311068% |
| B | 7247 | 135 | 1.862840% |
| C | 7247 | 153 | 2.111218% |
| D | 7247 | 246 | 3.394508% |
Noise dominated data is calculated using 1-second bins in cleaned event files. If a bin has >2000 counts, and if more than 50% of those come from <1% of pixels, then it is considered to be noise-dominated and hence unusable.
| Quadrant | # 1 sec bins | Bins with >0 counts | Bins with >2000 counts | High rate bins dominated by noise | Noise dominated (total time) | Noise dominated (detector-on time) | Marked lightcurve |
|---|---|---|---|---|---|---|---|
| A | 7516 | 7247 | 0 | 0 | 0.00% | 0.00% | 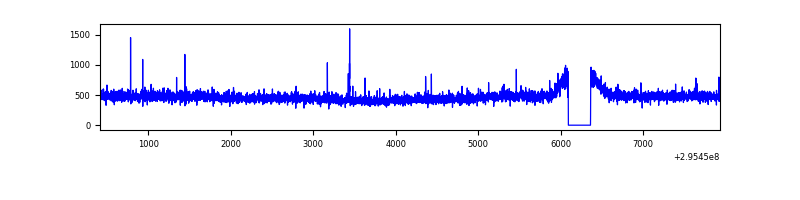 |
| B | 7517 | 7248 | 13 | 13 | 0.17% | 0.18% | 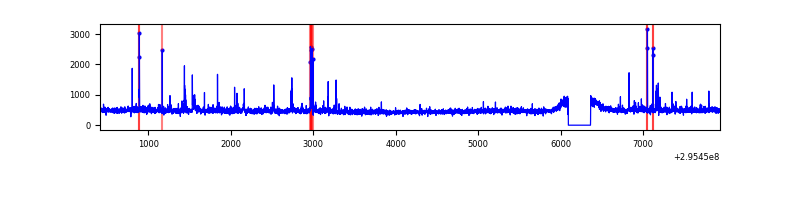 |
| C | 7517 | 7247 | 2 | 2 | 0.03% | 0.03% | 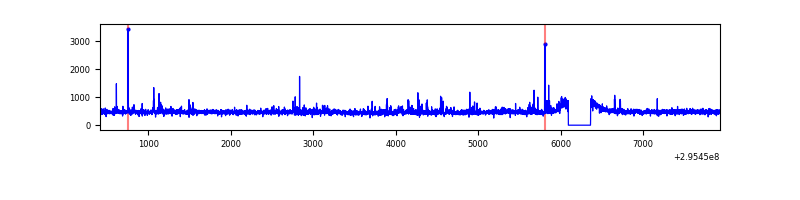 |
| D | 7517 | 7247 | 138 | 138 | 1.84% | 1.90% | 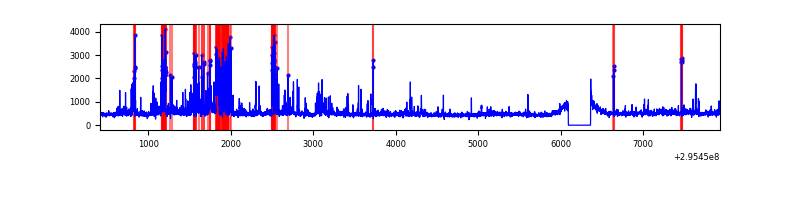 |
Top three noisy pixels from each quadrant. If the there are fewer than three noisy pixels in the level2.evt file, extra rows are filled as -1
| Pixel properties | Quadrant properties | ||||||
|---|---|---|---|---|---|---|---|
| Quadrant | DetID | PixID | Counts | Sigma | Mean | Median | Sigma |
| A | 5 | 16 | 15552 | 82.57 | 873 | 854 | 178.0 |
| A | 13 | 254 | 10695 | 55.29 | 873 | 854 | 178.0 |
| A | 15 | 191 | 9903 | 50.84 | 873 | 854 | 178.0 |
| B | 4 | 216 | 43578 | 256.07 | 865 | 842 | 166.9 |
| B | 0 | 230 | 28672 | 166.75 | 865 | 842 | 166.9 |
| B | 15 | 32 | 24803 | 143.57 | 865 | 842 | 166.9 |
| C | 14 | 238 | 130466 | 664.43 | 829 | 833 | 195.1 |
| C | 5 | 112 | 113214 | 576.01 | 829 | 833 | 195.1 |
| C | 3 | 233 | 15665 | 76.02 | 829 | 833 | 195.1 |
| D | 1 | 52 | 605161 | 2952.45 | 837 | 811 | 204.7 |
| D | 7 | 238 | 129178 | 627.12 | 837 | 811 | 204.7 |
| D | 2 | 16 | 112178 | 544.07 | 837 | 811 | 204.7 |
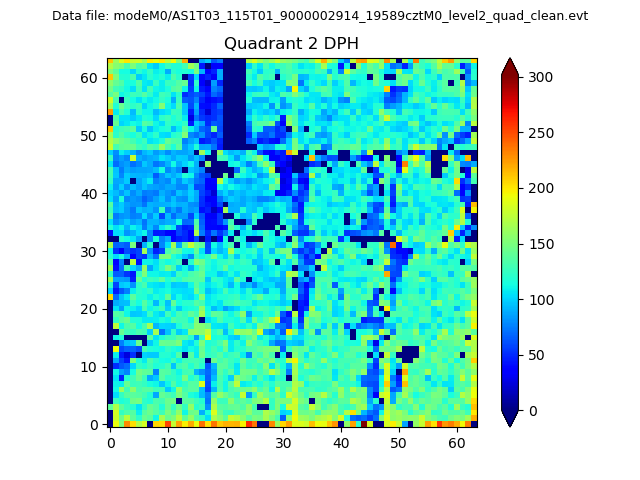
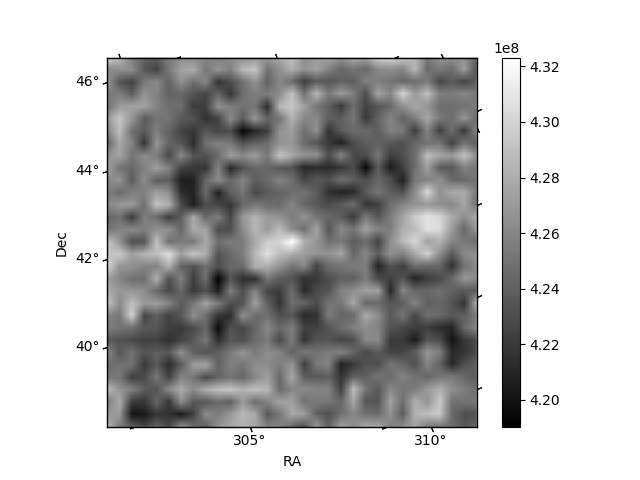
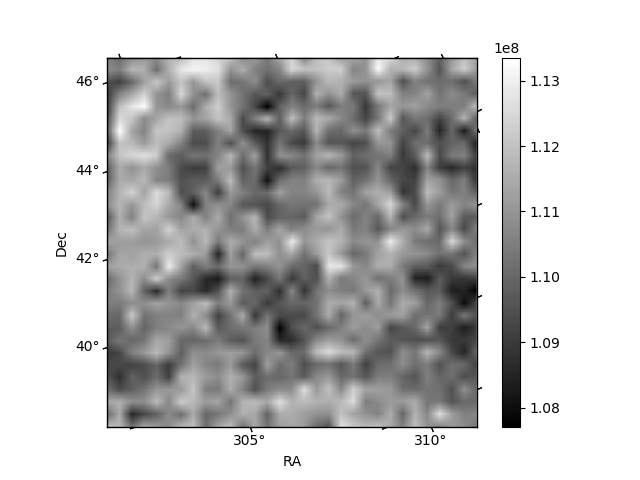
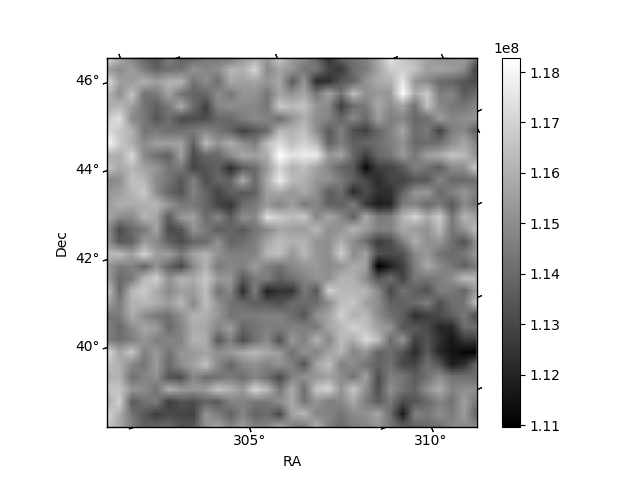
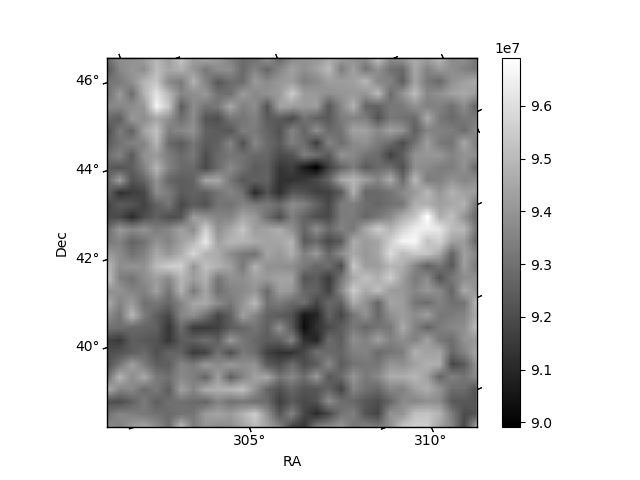
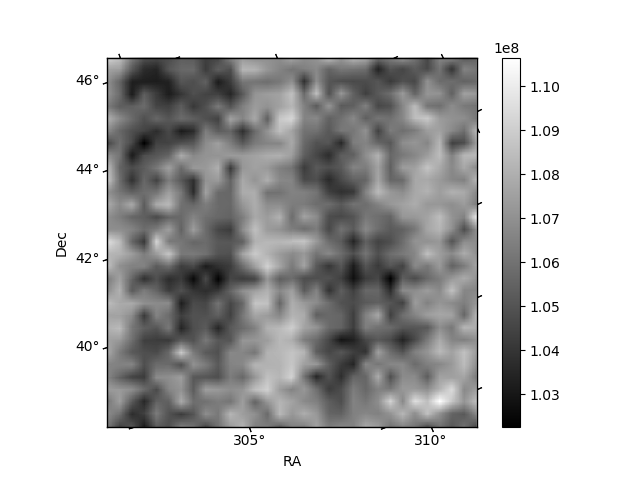
Histogram calculated using DETX and DETY for each event in the final _common_clean file
| Quadrant A | 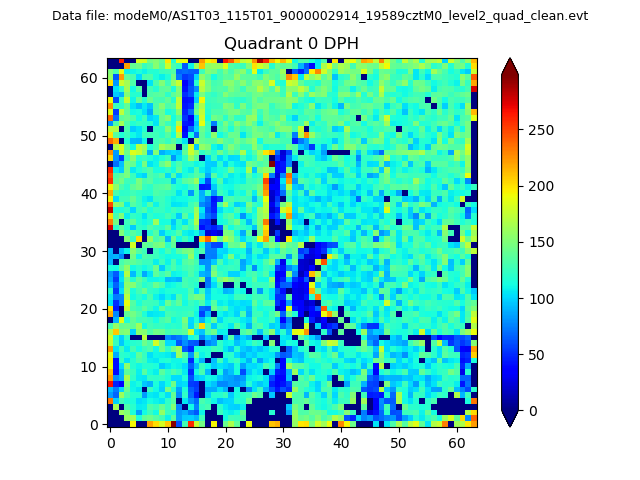 |
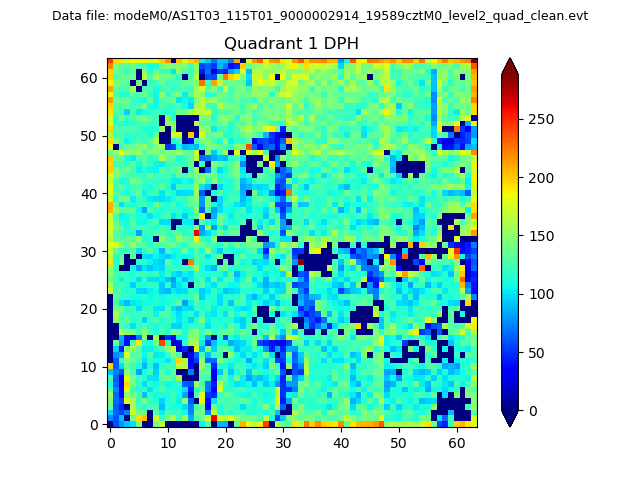 |
Quadrant B |
|---|---|---|---|
| Quadrant D | 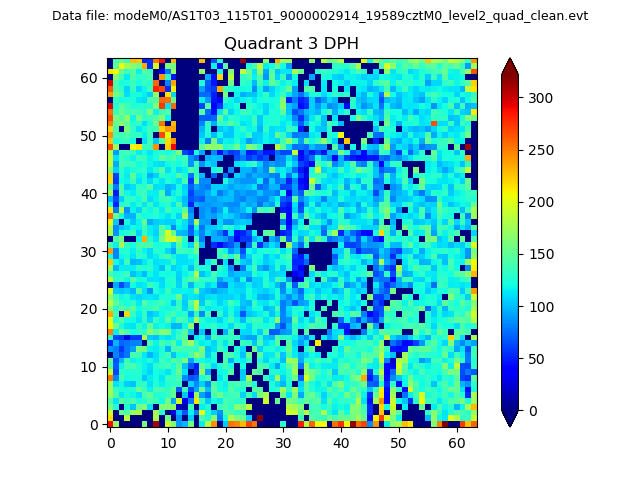 |
 |
Quadrant C |
| Plot type | Count rate plots | Images |
|---|---|---|
| Comparison with Poisson distribution Blue bars denote a histogram of data divided into 1 sec bins. Red curve is a Poisson curve with rate = median count rate of data. |
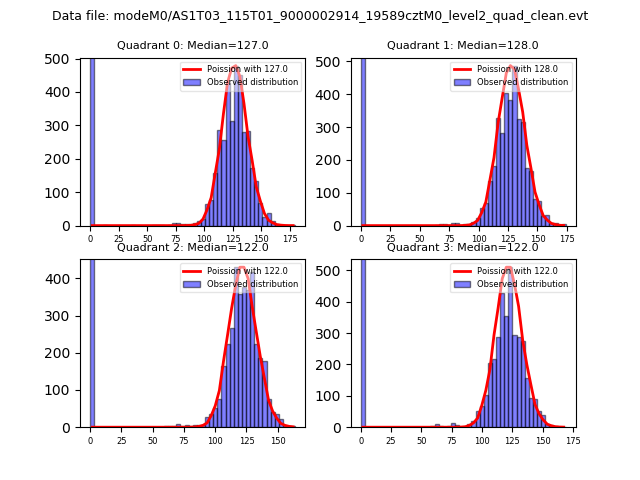 |
 |
| Quadrant-wise count rates Data is divided into 100 sec bins |
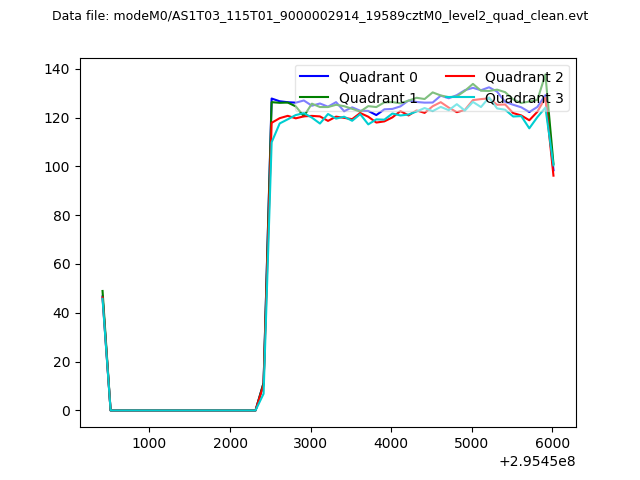 |
|
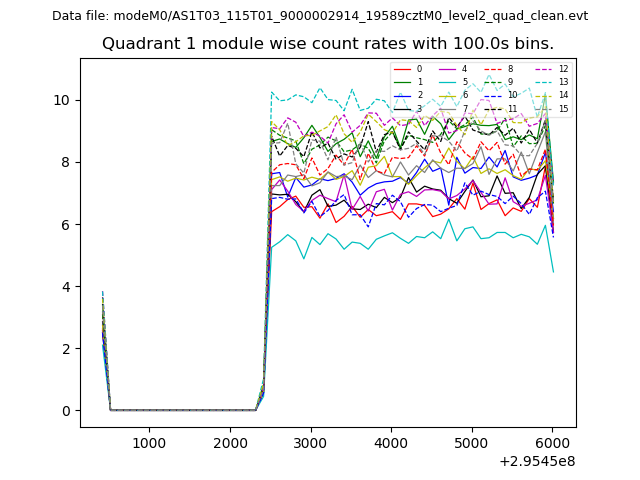
| Module-wise count rates for Quadrant A Data is divided into 100 sec bins |
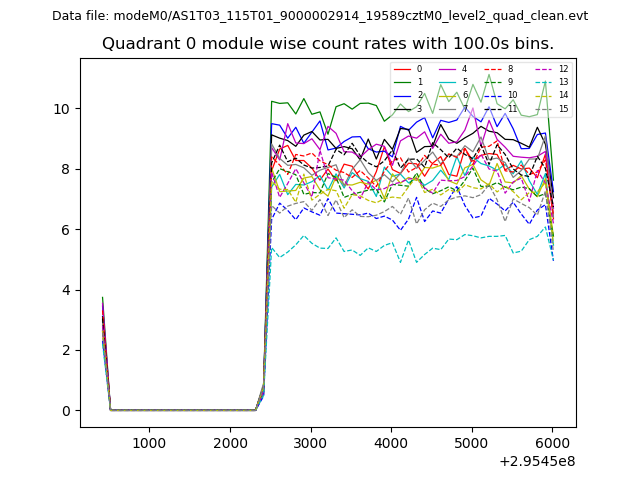 |
 |
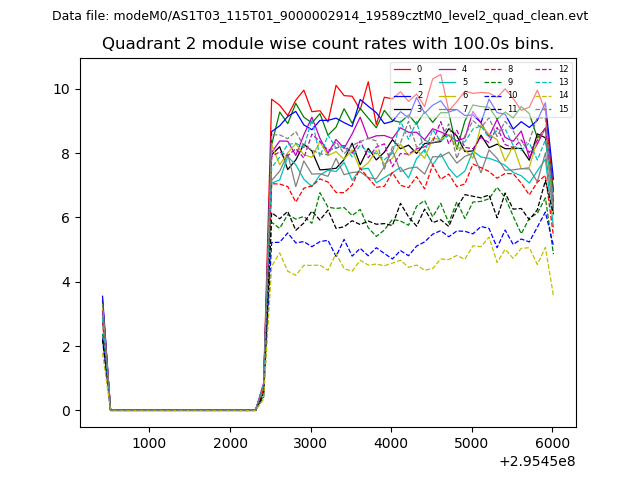
| Module-wise count rates for Quadrant B Data is divided into 100 sec bins |
 |
 |
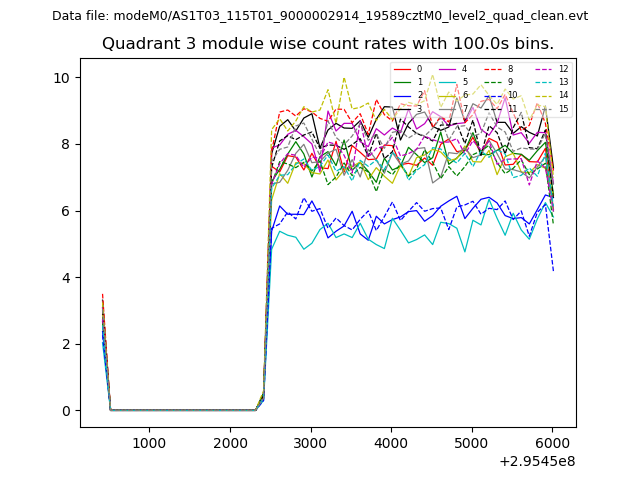
| Module-wise count rates for Quadrant C Data is divided into 100 sec bins |
 |
 |
| Module-wise count rates for Quadrant D Data is divided into 100 sec bins |
 |
 |
| Parameter | Plot |
|---|---|
| CZT HV Monitor | 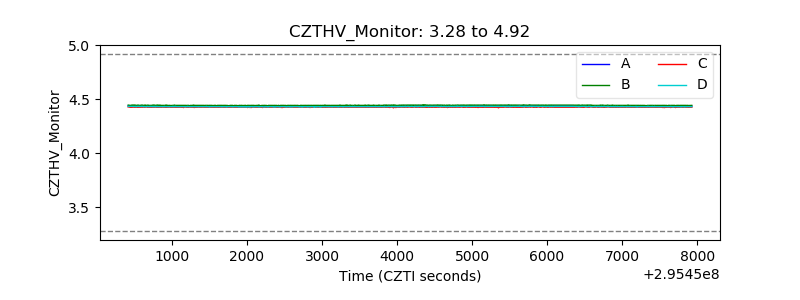 |
| D_VDD | 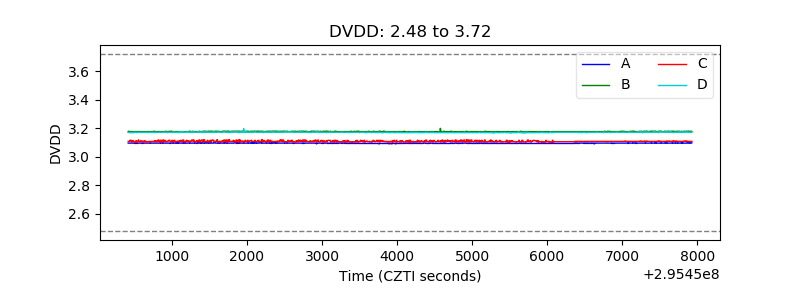 |
| Temperature 1 | 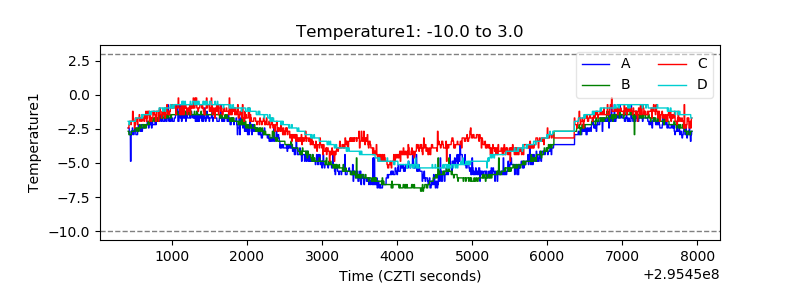 |
| Veto HV Monitor | 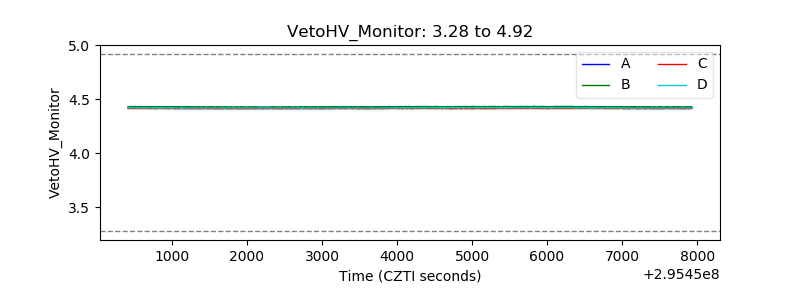 |
| Veto LLD | 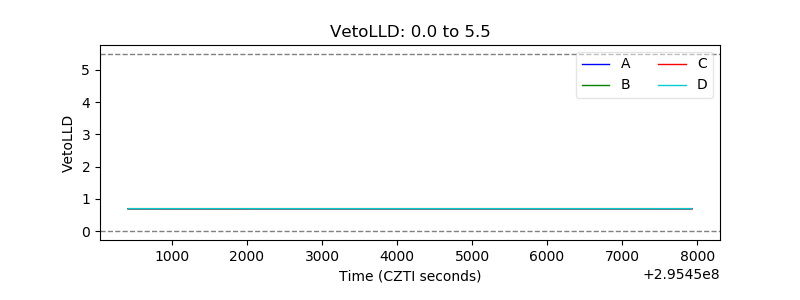 |
| Alpha Counter | 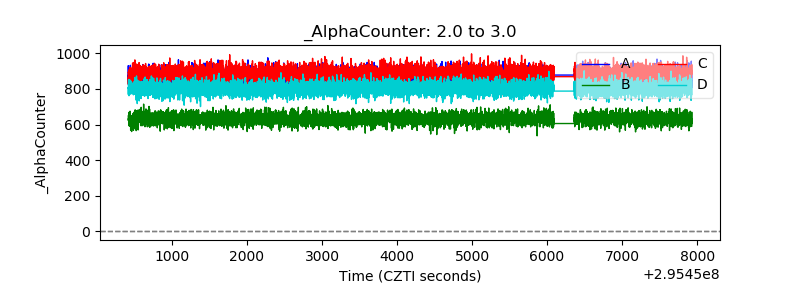 |
| _CPM_Rate | 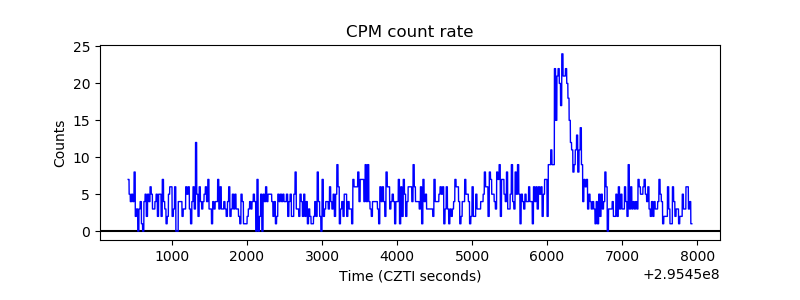 |
| CZT Counter | 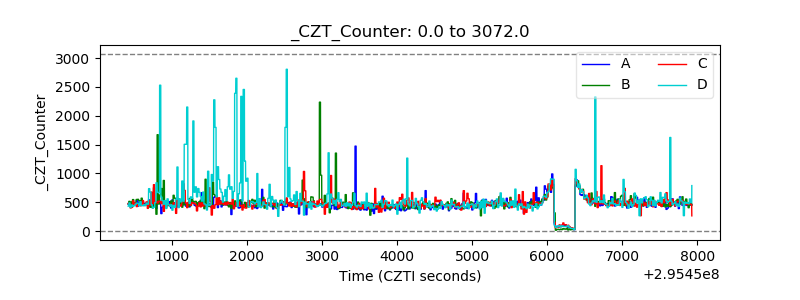 |
| +2.5 Volts monitor |  |
| +5 Volts monitor | 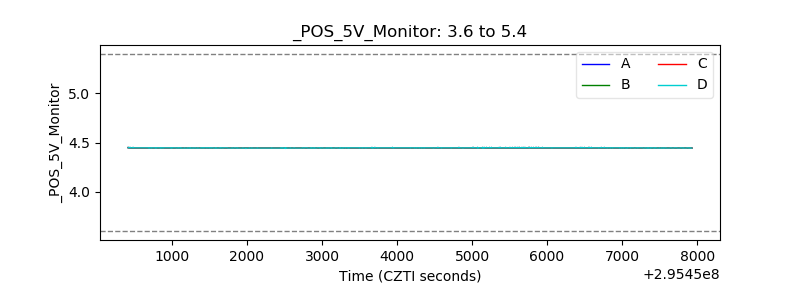 |
| _ROLL_ROT | 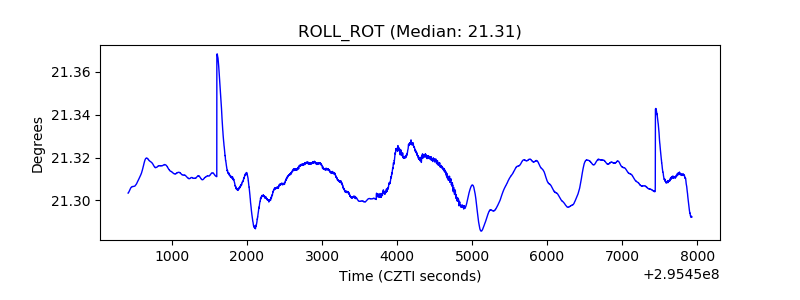 |
| _Roll_DEC | 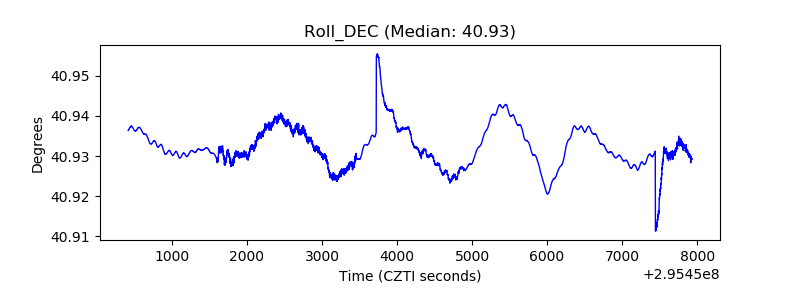 |
| _Roll_RA | 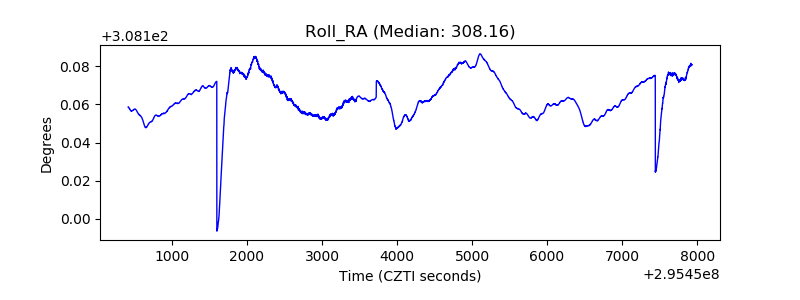 |
| Veto Counter | 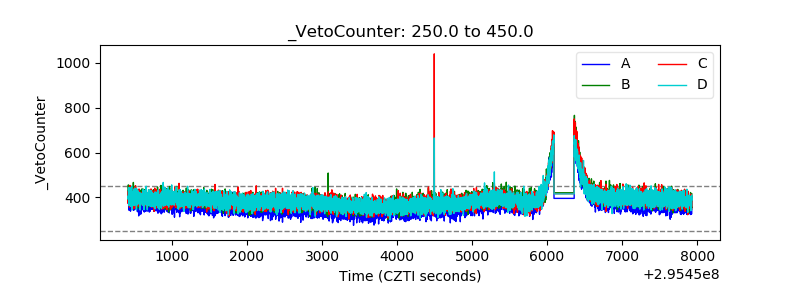 |