| Param | Original file | Final file |
|---|---|---|
| Filename | modeM0/AS1T03_115T01_9000002914_19592cztM0_level2.evt | modeM0/AS1T03_115T01_9000002914_19592cztM0_level2_quad_clean.evt |
| Size (bytes) | 1,244,059,200 | 240,958,080 |
| Size | 1.2 GB | 229.8 MB |
| Events in quadrant A | 8,541,935 | 1,533,939 |
| Events in quadrant B | 9,005,568 | 1,537,176 |
| Events in quadrant C | 8,673,375 | 1,490,381 |
| Events in quadrant D | 10,209,897 | 1,467,566 |
| Mode M9 | |||
|---|---|---|---|
| Quadrant | BADHDUFLAG | Total packets | Discarded packets |
| A | 0 | 19 | 0 |
| B | 0 | 19 | 0 |
| C | 0 | 19 | 0 |
| D | 0 | 19 | 0 |
| Mode SS | |||
|---|---|---|---|
| Quadrant | BADHDUFLAG | Total packets | Discarded packets |
| A | 0 | 374 | 0 |
| B | 0 | 374 | 0 |
| C | 0 | 374 | 0 |
| D | 0 | 374 | 0 |
| Mode M0 | |||
|---|---|---|---|
| Quadrant | BADHDUFLAG | Total packets | Discarded packets |
| A | 0 | 37627 | 3 |
| B | 0 | 38801 | 3 |
| C | 0 | 37624 | 3 |
| D | 0 | 42739 | 3 |
| Quadrant | Total seconds | Saturated seconds | Saturation percentage |
|---|---|---|---|
| A | 18421 | 110 | 0.597145% |
| B | 18422 | 160 | 0.868527% |
| C | 18422 | 190 | 1.031376% |
| D | 18421 | 269 | 1.460290% |
Noise dominated data is calculated using 1-second bins in cleaned event files. If a bin has >2000 counts, and if more than 50% of those come from <1% of pixels, then it is considered to be noise-dominated and hence unusable.
| Quadrant | # 1 sec bins | Bins with >0 counts | Bins with >2000 counts | High rate bins dominated by noise | Noise dominated (total time) | Noise dominated (detector-on time) | Marked lightcurve |
|---|---|---|---|---|---|---|---|
| A | 20356 | 18424 | 12 | 12 | 0.06% | 0.07% | 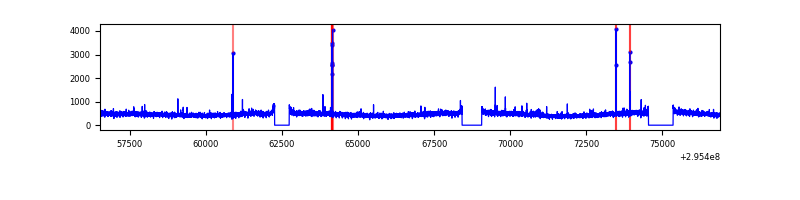 |
| B | 20357 | 18423 | 44 | 44 | 0.22% | 0.24% | 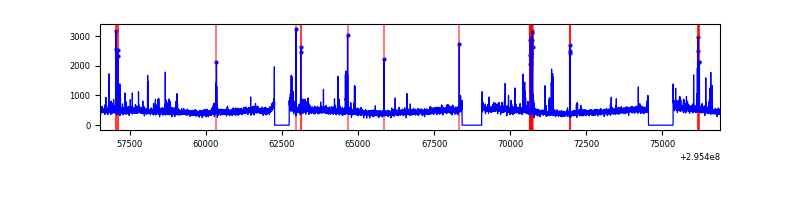 |
| C | 20357 | 18424 | 0 | 0 | 0.00% | 0.00% | 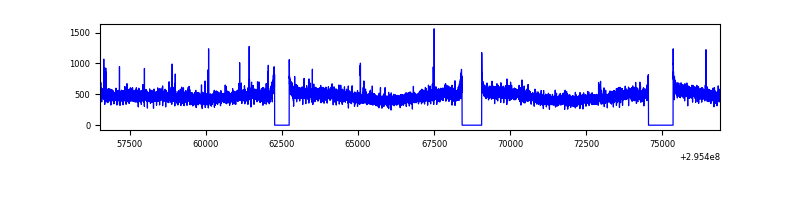 |
| D | 20356 | 18424 | 160 | 160 | 0.79% | 0.87% | 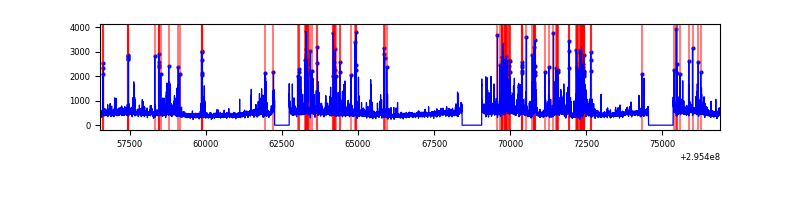 |
Top three noisy pixels from each quadrant. If the there are fewer than three noisy pixels in the level2.evt file, extra rows are filled as -1
| Pixel properties | Quadrant properties | ||||||
|---|---|---|---|---|---|---|---|
| Quadrant | DetID | PixID | Counts | Sigma | Mean | Median | Sigma |
| A | 9 | 143 | 67165 | 148.71 | 2183 | 2138 | 437.3 |
| A | 13 | 254 | 25721 | 53.93 | 2183 | 2138 | 437.3 |
| A | 11 | 47 | 21932 | 45.27 | 2183 | 2138 | 437.3 |
| B | 7 | 220 | 104878 | 249.86 | 2173 | 2115 | 411.3 |
| B | 4 | 216 | 100251 | 238.61 | 2173 | 2115 | 411.3 |
| B | 0 | 197 | 67297 | 158.49 | 2173 | 2115 | 411.3 |
| C | 14 | 238 | 325601 | 663.29 | 2091 | 2107 | 487.7 |
| C | 3 | 233 | 88684 | 177.52 | 2091 | 2107 | 487.7 |
| C | 7 | 247 | 43481 | 84.83 | 2091 | 2107 | 487.7 |
| D | 1 | 52 | 796818 | 1534.79 | 2118 | 2056 | 517.8 |
| D | 7 | 238 | 680971 | 1311.08 | 2118 | 2056 | 517.8 |
| D | 9 | 1 | 269716 | 516.89 | 2118 | 2056 | 517.8 |
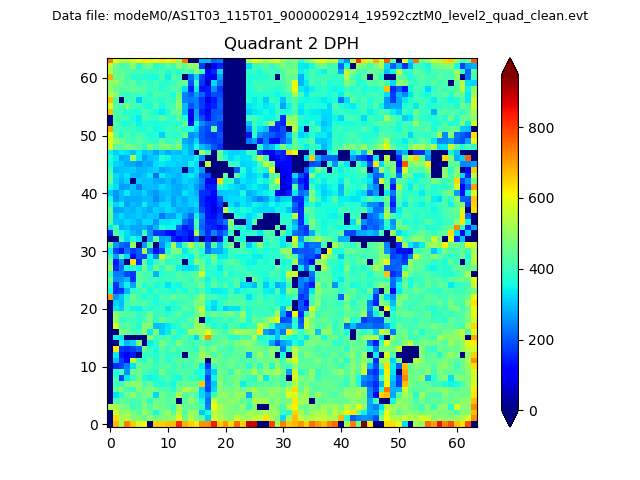
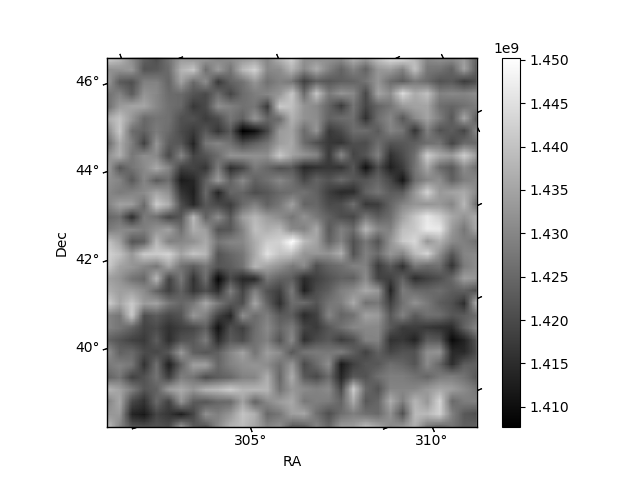
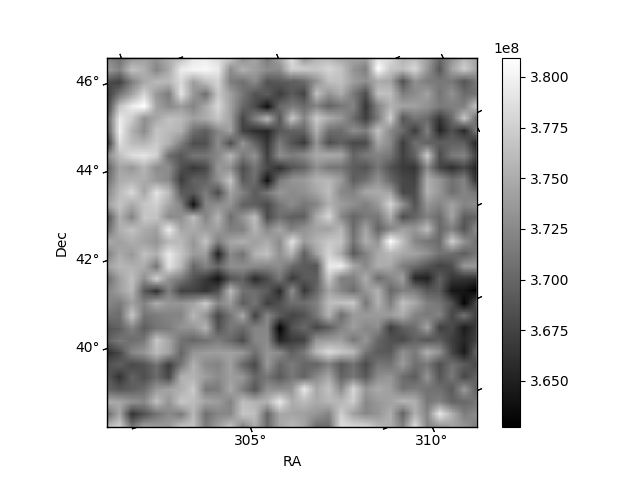
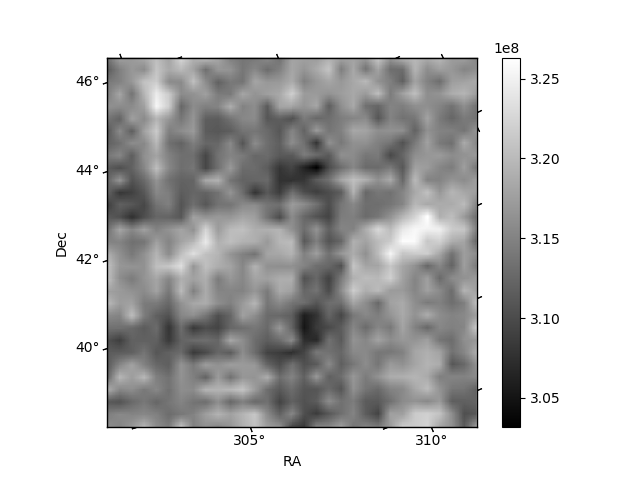
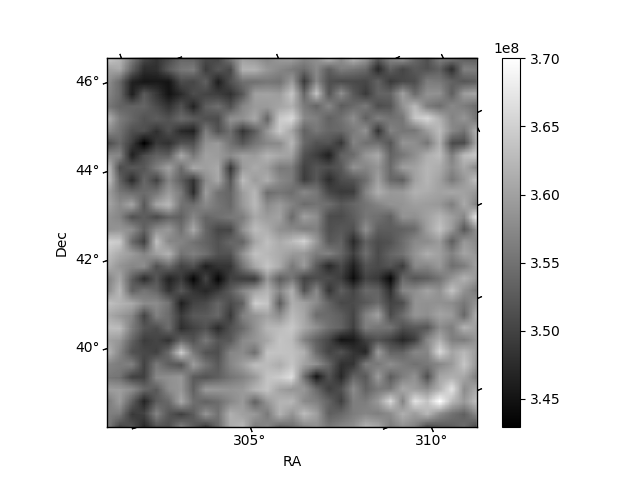
Histogram calculated using DETX and DETY for each event in the final _common_clean file
| Quadrant A | 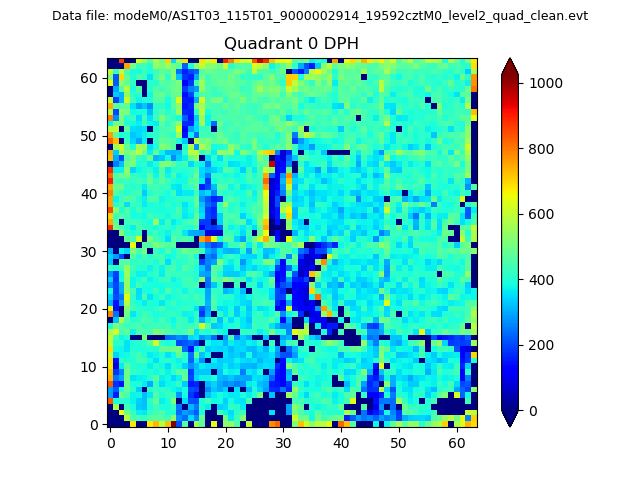 |
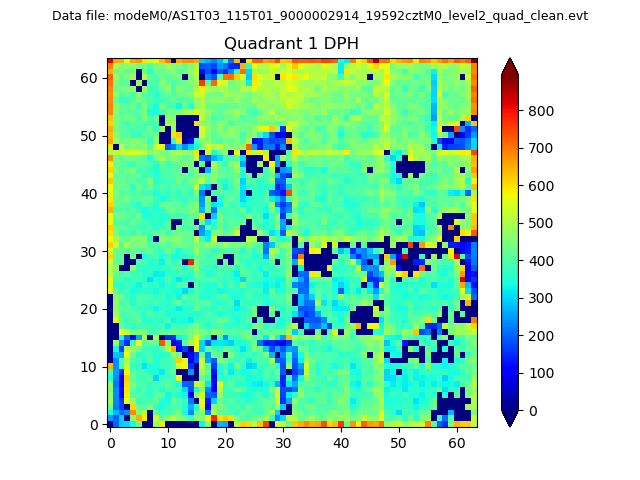 |
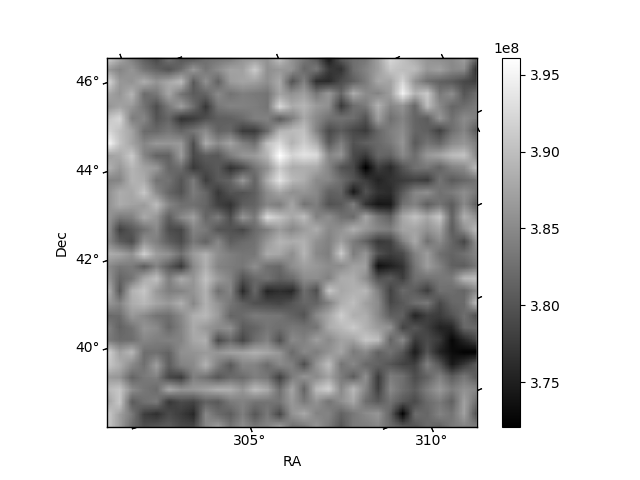
Quadrant B |
|---|---|---|---|
| Quadrant D | 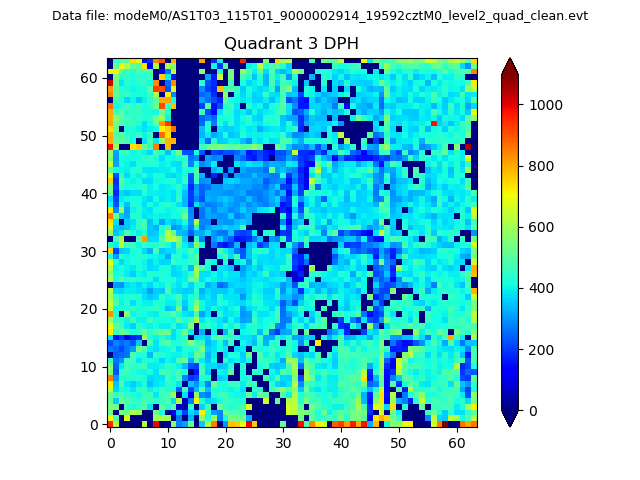 |
 |
Quadrant C |
| Plot type | Count rate plots | Images |
|---|---|---|
| Comparison with Poisson distribution Blue bars denote a histogram of data divided into 1 sec bins. Red curve is a Poisson curve with rate = median count rate of data. |
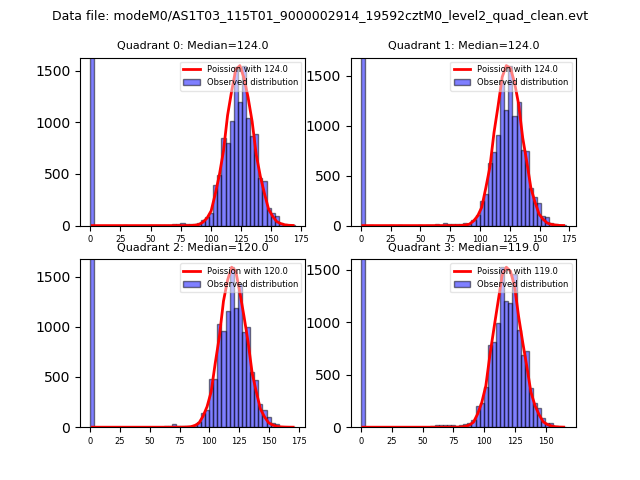 |
 |
| Quadrant-wise count rates Data is divided into 100 sec bins |
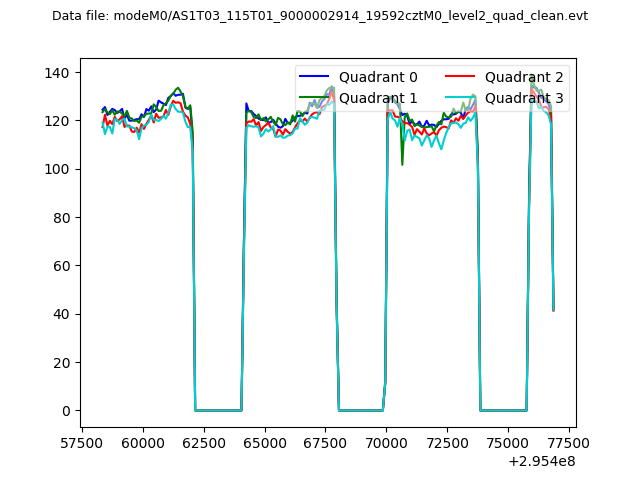 |
|
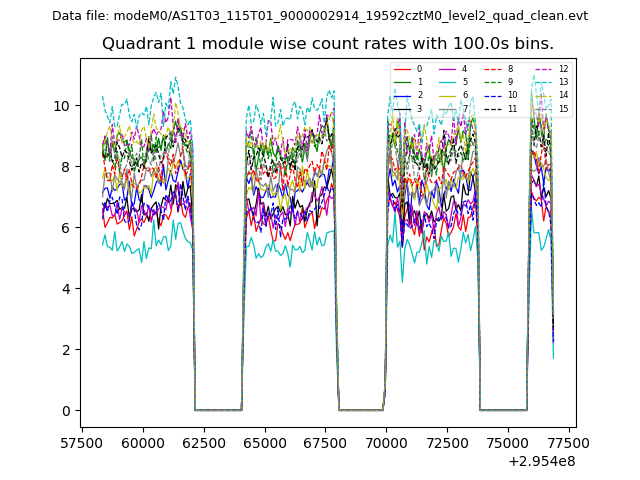
| Module-wise count rates for Quadrant A Data is divided into 100 sec bins |
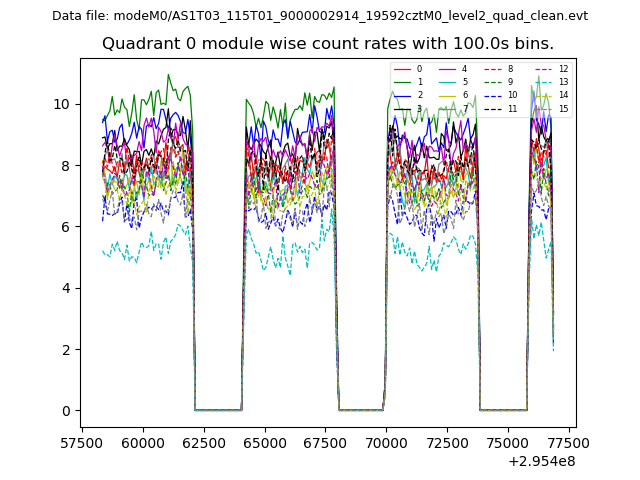 |
 |
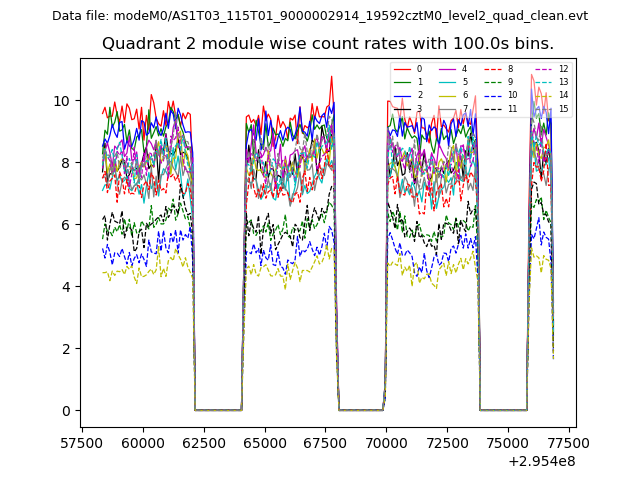
| Module-wise count rates for Quadrant B Data is divided into 100 sec bins |
 |
 |
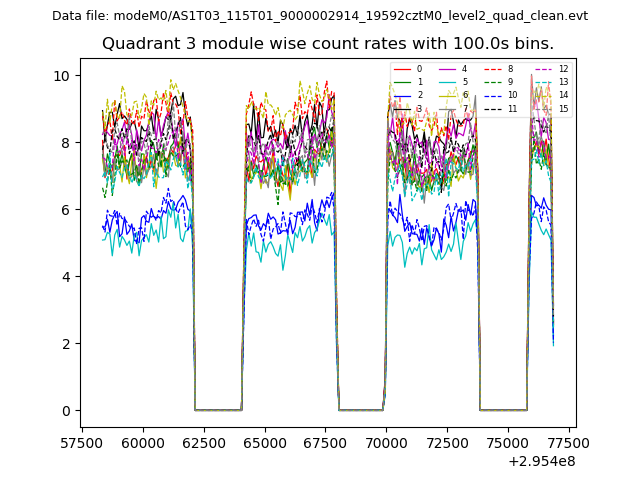
| Module-wise count rates for Quadrant C Data is divided into 100 sec bins |
 |
 |
| Module-wise count rates for Quadrant D Data is divided into 100 sec bins |
 |
 |
| Parameter | Plot |
|---|---|
| CZT HV Monitor | 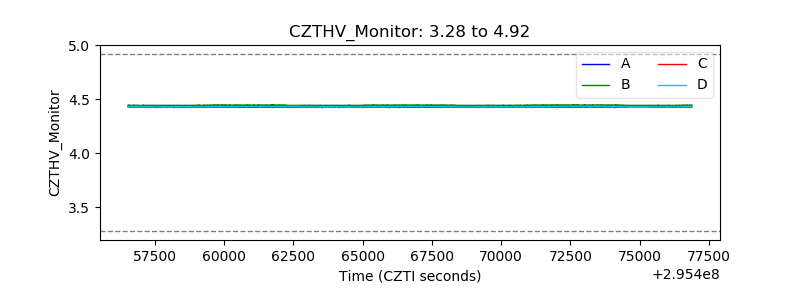 |
| D_VDD | 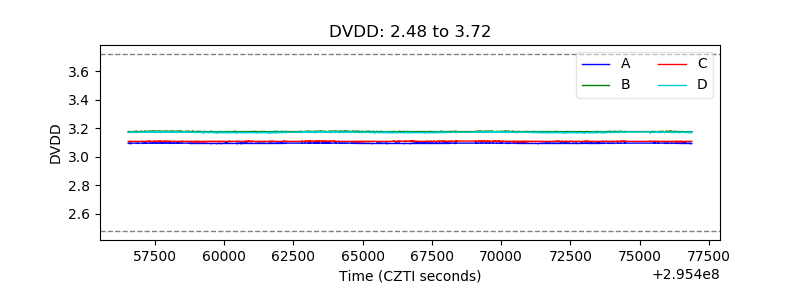 |
| Temperature 1 | 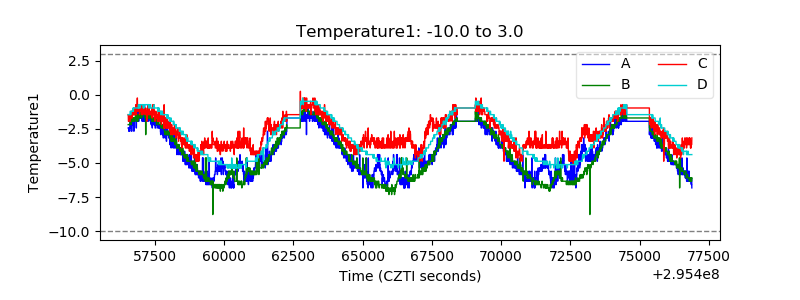 |
| Veto HV Monitor | 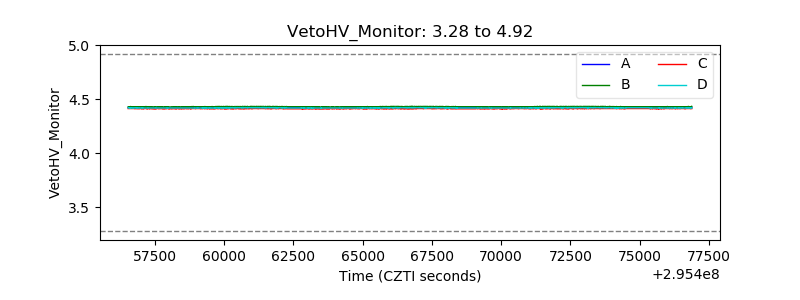 |
| Veto LLD | 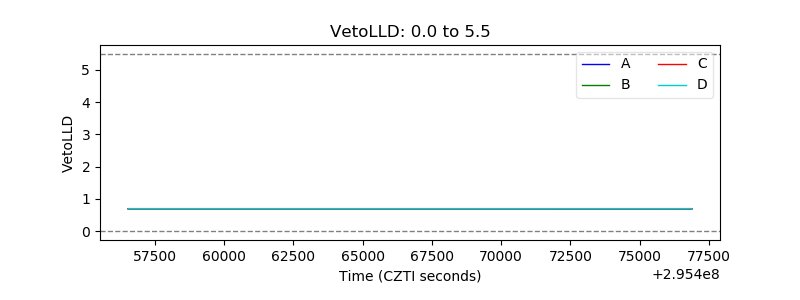 |
| Alpha Counter | 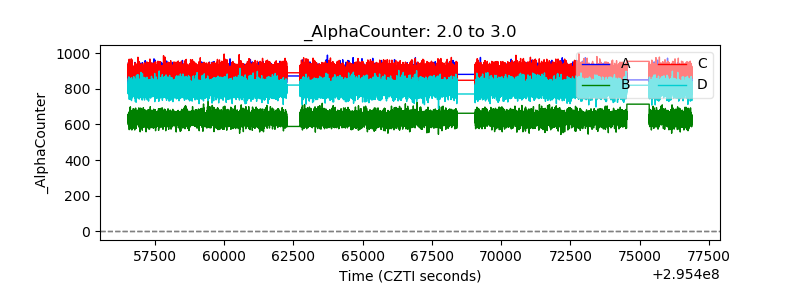 |
| _CPM_Rate | 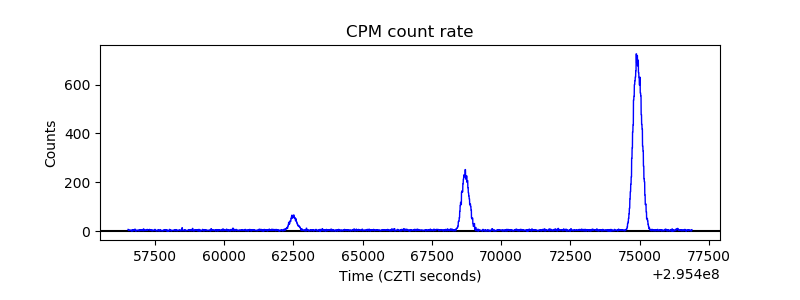 |
| CZT Counter | 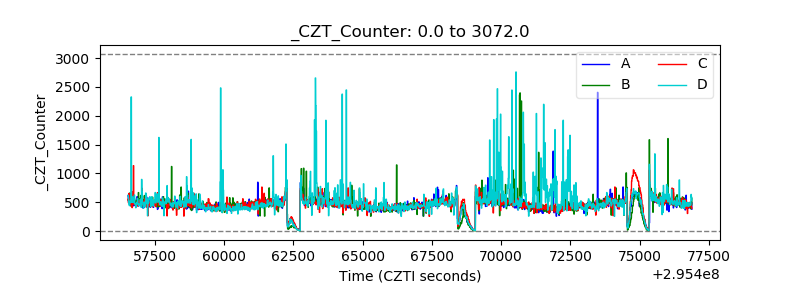 |
| +2.5 Volts monitor | 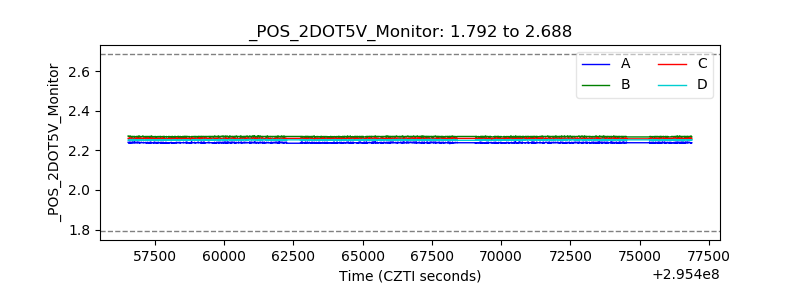 |
| +5 Volts monitor |  |
| _ROLL_ROT | 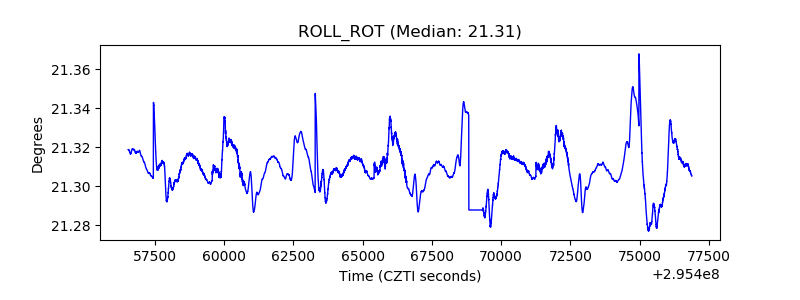 |
| _Roll_DEC | 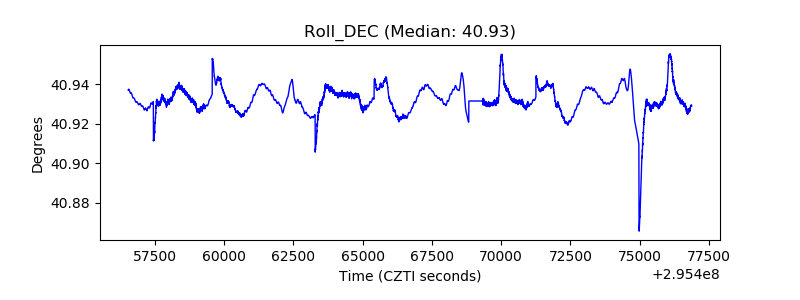 |
| _Roll_RA | 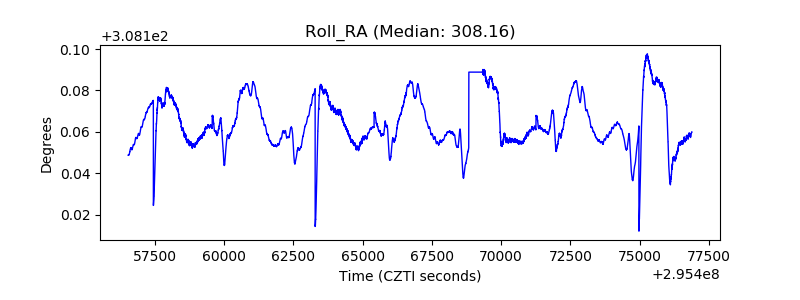 |
| Veto Counter | 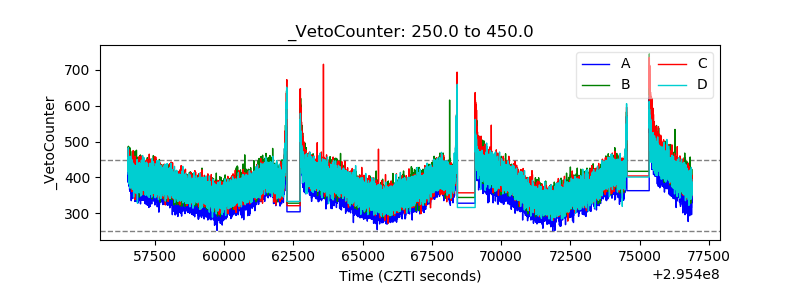 |