| Param | Original file | Final file |
|---|---|---|
| Filename | modeM0/AS1T03_115T01_9000002914_19595cztM0_level2.evt | modeM0/AS1T03_115T01_9000002914_19595cztM0_level2_quad_clean.evt |
| Size (bytes) | 461,718,720 | 104,428,800 |
| Size | 440.3 MB | 99.6 MB |
| Events in quadrant A | 3,225,870 | 685,850 |
| Events in quadrant B | 3,246,634 | 701,917 |
| Events in quadrant C | 3,141,351 | 675,808 |
| Events in quadrant D | 3,926,009 | 644,219 |
| Mode M9 | |||
|---|---|---|---|
| Quadrant | BADHDUFLAG | Total packets | Discarded packets |
| A | 0 | 18 | 0 |
| B | 0 | 19 | 0 |
| C | 0 | 19 | 0 |
| D | 0 | 19 | 0 |
| Mode SS | |||
|---|---|---|---|
| Quadrant | BADHDUFLAG | Total packets | Discarded packets |
| A | 0 | 132 | 0 |
| B | 0 | 132 | 0 |
| C | 0 | 132 | 0 |
| D | 0 | 132 | 0 |
| Mode M0 | |||
|---|---|---|---|
| Quadrant | BADHDUFLAG | Total packets | Discarded packets |
| A | 0 | 13994 | 2 |
| B | 0 | 14037 | 2 |
| C | 0 | 13695 | 2 |
| D | 0 | 16323 | 2 |
| Quadrant | Total seconds | Saturated seconds | Saturation percentage |
|---|---|---|---|
| A | 6524 | 106 | 1.624770% |
| B | 6524 | 50 | 0.766401% |
| C | 6524 | 57 | 0.873697% |
| D | 6524 | 168 | 2.575107% |
Noise dominated data is calculated using 1-second bins in cleaned event files. If a bin has >2000 counts, and if more than 50% of those come from <1% of pixels, then it is considered to be noise-dominated and hence unusable.
| Quadrant | # 1 sec bins | Bins with >0 counts | Bins with >2000 counts | High rate bins dominated by noise | Noise dominated (total time) | Noise dominated (detector-on time) | Marked lightcurve |
|---|---|---|---|---|---|---|---|
| A | 7649 | 6525 | 55 | 55 | 0.72% | 0.84% | 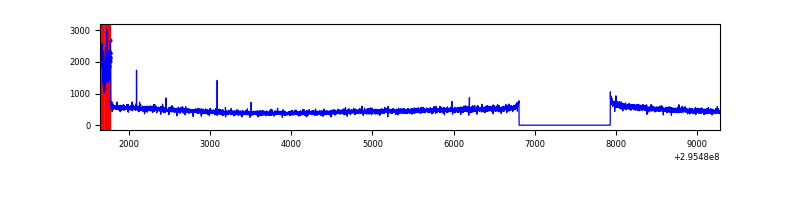 |
| B | 7649 | 6525 | 12 | 12 | 0.16% | 0.18% | 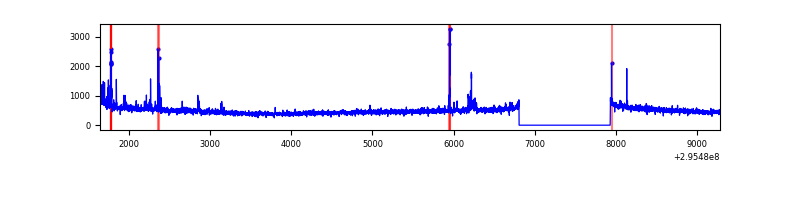 |
| C | 7649 | 6525 | 0 | 0 | 0.00% | 0.00% | 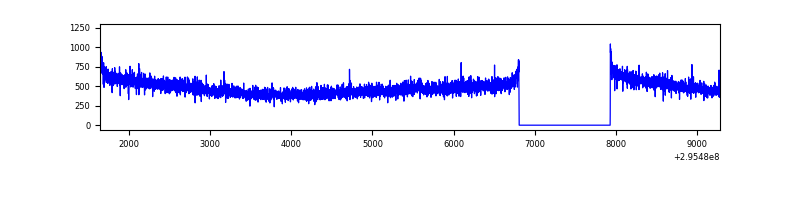 |
| D | 7649 | 6525 | 158 | 158 | 2.07% | 2.42% |  |
Top three noisy pixels from each quadrant. If the there are fewer than three noisy pixels in the level2.evt file, extra rows are filled as -1
| Pixel properties | Quadrant properties | ||||||
|---|---|---|---|---|---|---|---|
| Quadrant | DetID | PixID | Counts | Sigma | Mean | Median | Sigma |
| A | 5 | 16 | 184554 | 1155.05 | 784 | 768 | 159.1 |
| A | 13 | 254 | 9383 | 54.14 | 784 | 768 | 159.1 |
| A | 11 | 29 | 8711 | 49.92 | 784 | 768 | 159.1 |
| B | 7 | 220 | 41160 | 269.38 | 793 | 774 | 149.9 |
| B | 0 | 197 | 28095 | 182.24 | 793 | 774 | 149.9 |
| B | 0 | 189 | 20173 | 129.39 | 793 | 774 | 149.9 |
| C | 14 | 238 | 120497 | 667.93 | 766 | 770 | 179.3 |
| C | 3 | 233 | 24077 | 130.02 | 766 | 770 | 179.3 |
| C | 5 | 112 | 8286 | 41.93 | 766 | 770 | 179.3 |
| D | 1 | 52 | 832033 | 4515.7 | 758 | 736 | 184.1 |
| D | 7 | 238 | 71915 | 386.65 | 758 | 736 | 184.1 |
| D | 7 | 38 | 36995 | 196.96 | 758 | 736 | 184.1 |
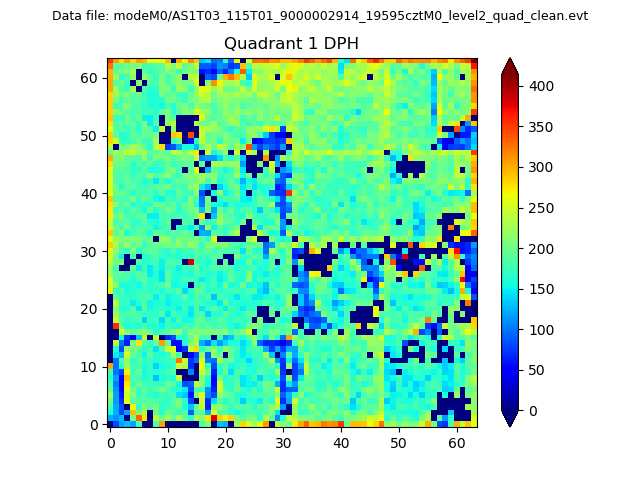
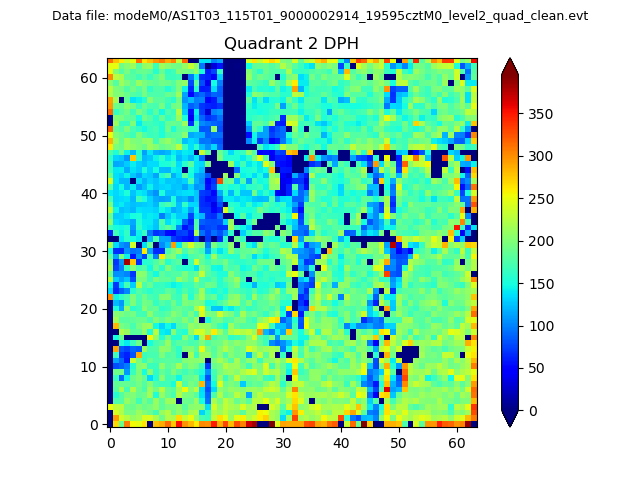
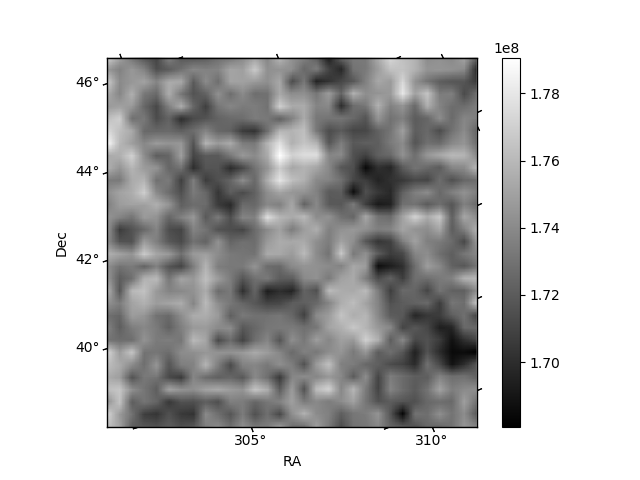
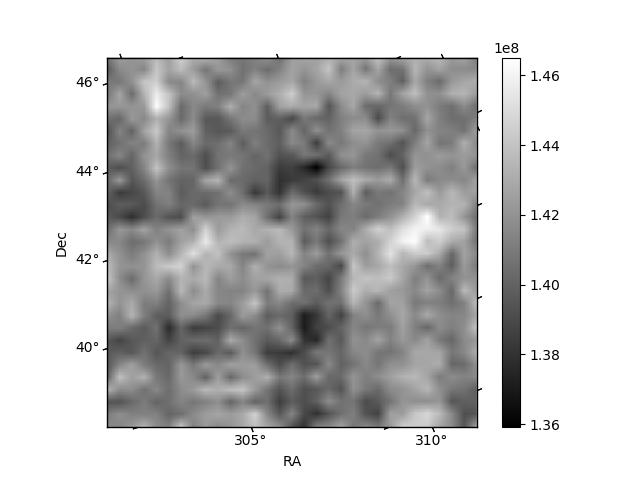
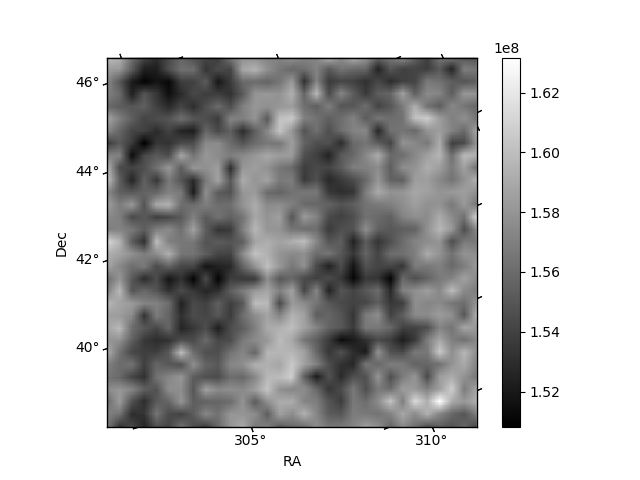
Histogram calculated using DETX and DETY for each event in the final _common_clean file
| Quadrant A |  |
 |
Quadrant B |
|---|---|---|---|
| Quadrant D | 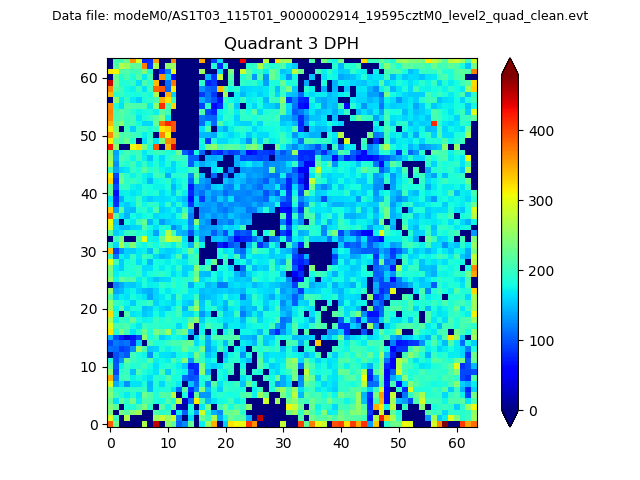 |
 |
Quadrant C |
| Plot type | Count rate plots | Images |
|---|---|---|
| Comparison with Poisson distribution Blue bars denote a histogram of data divided into 1 sec bins. Red curve is a Poisson curve with rate = median count rate of data. |
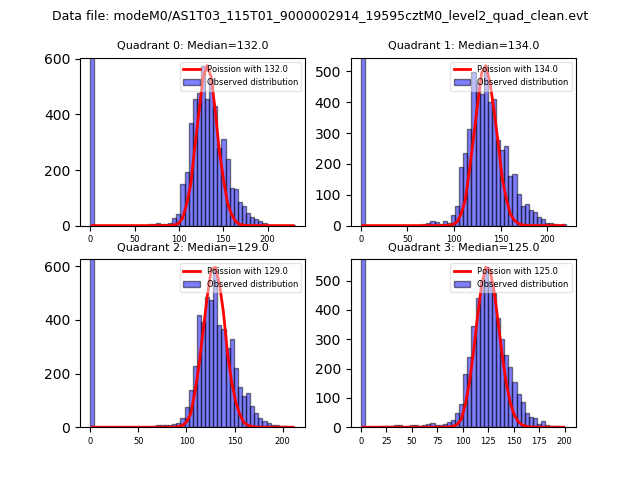 |
 |
| Quadrant-wise count rates Data is divided into 100 sec bins |
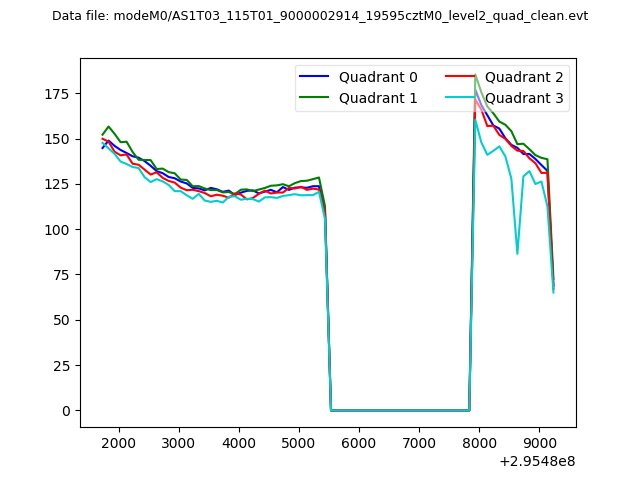 |
|
| Module-wise count rates for Quadrant A Data is divided into 100 sec bins |
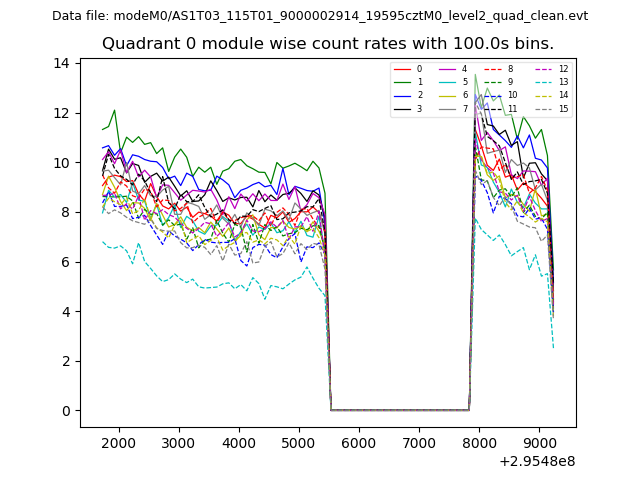 |
 |
| Module-wise count rates for Quadrant B Data is divided into 100 sec bins |
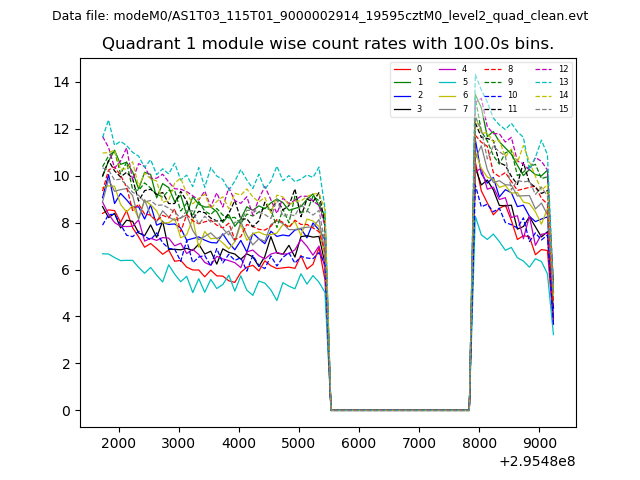 |
 |
| Module-wise count rates for Quadrant C Data is divided into 100 sec bins |
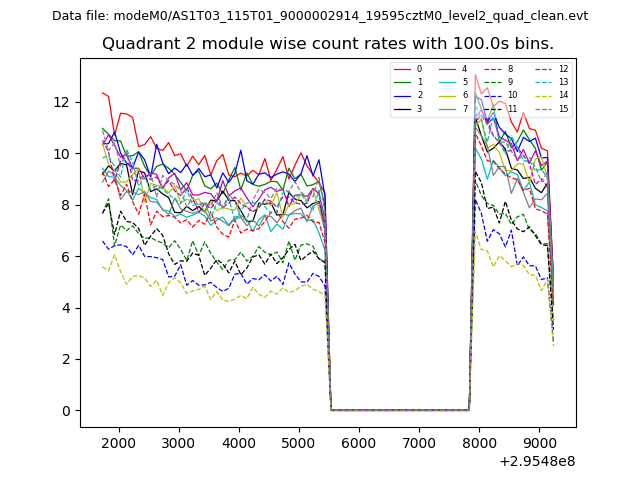 |
 |
| Module-wise count rates for Quadrant D Data is divided into 100 sec bins |
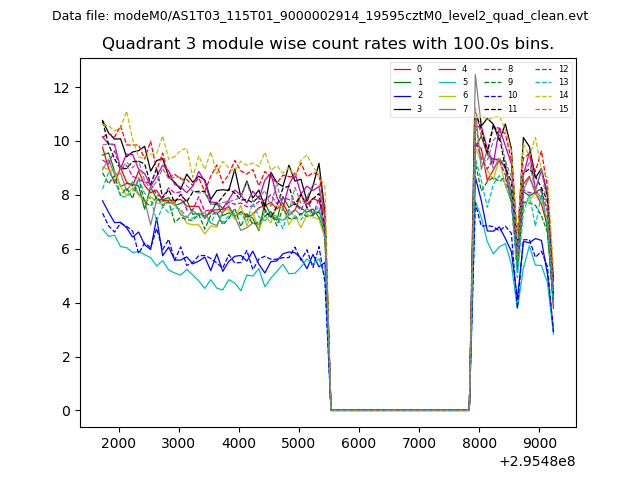 |
 |
| Parameter | Plot |
|---|---|
| CZT HV Monitor | 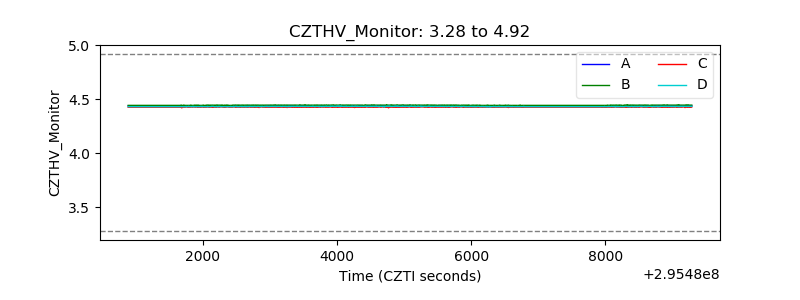 |
| D_VDD | 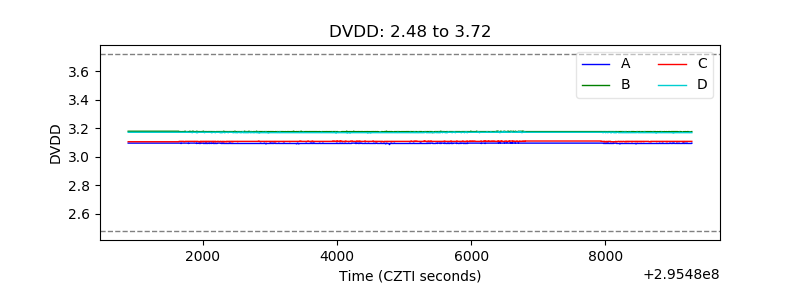 |
| Temperature 1 | 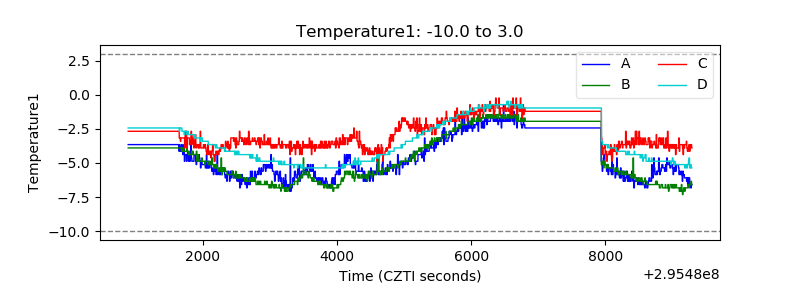 |
| Veto HV Monitor | 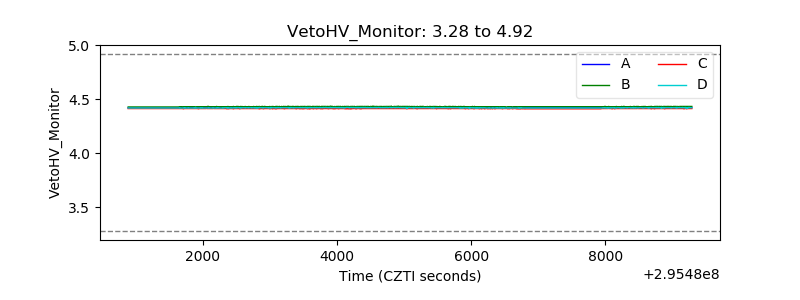 |
| Veto LLD | 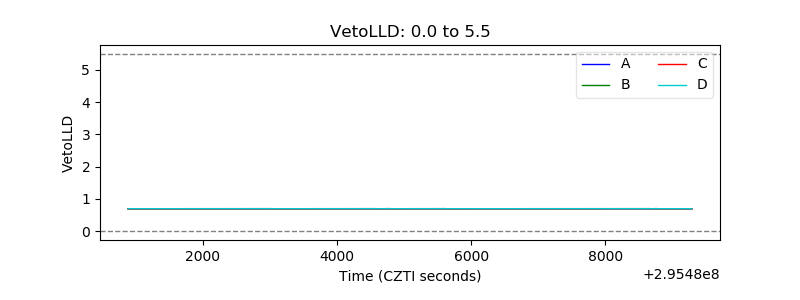 |
| Alpha Counter | 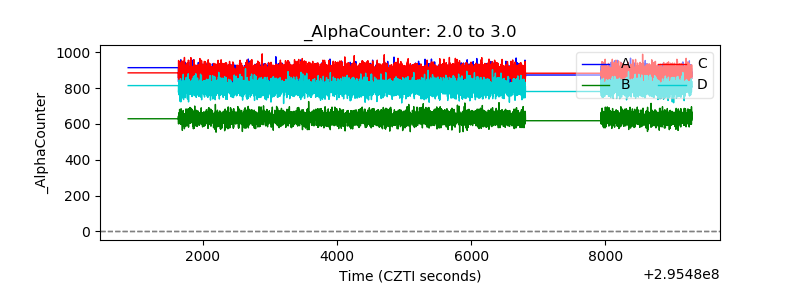 |
| _CPM_Rate | 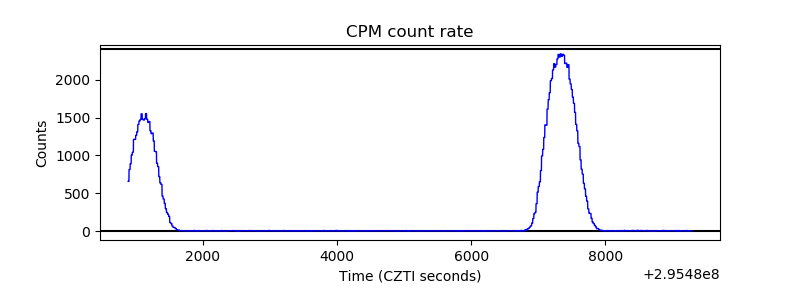 |
| CZT Counter | 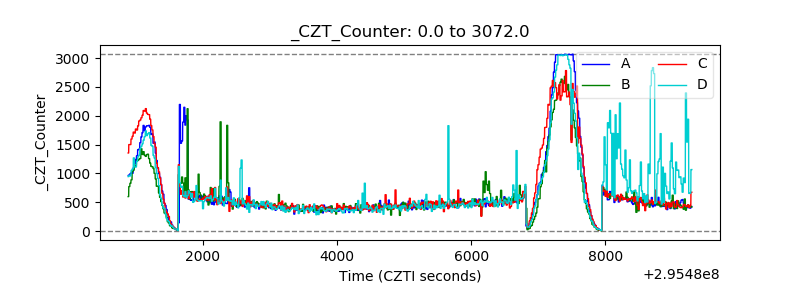 |
| +2.5 Volts monitor |  |
| +5 Volts monitor |  |
| _ROLL_ROT | 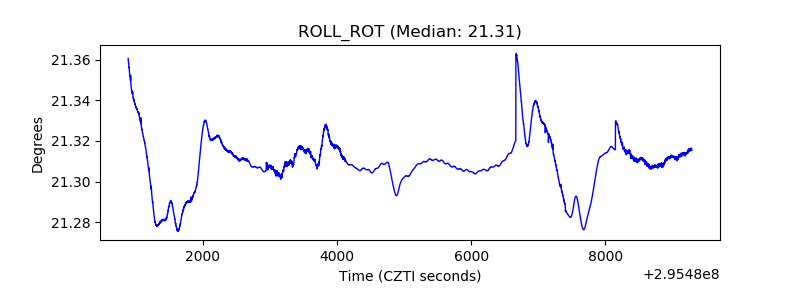 |
| _Roll_DEC | 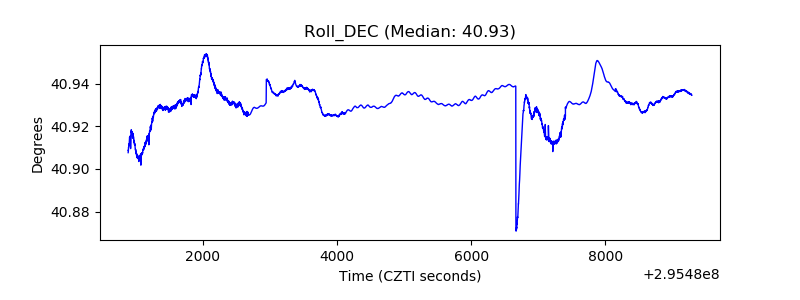 |
| _Roll_RA | 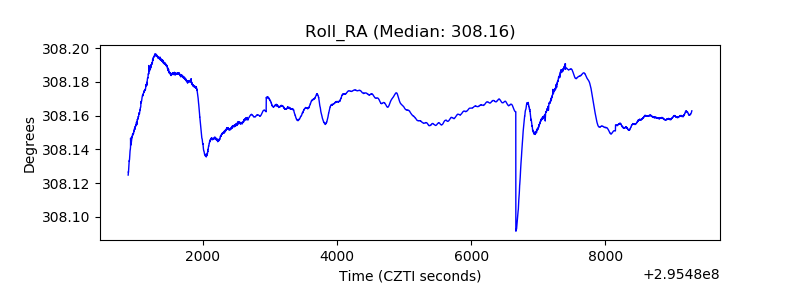 |
| Veto Counter | 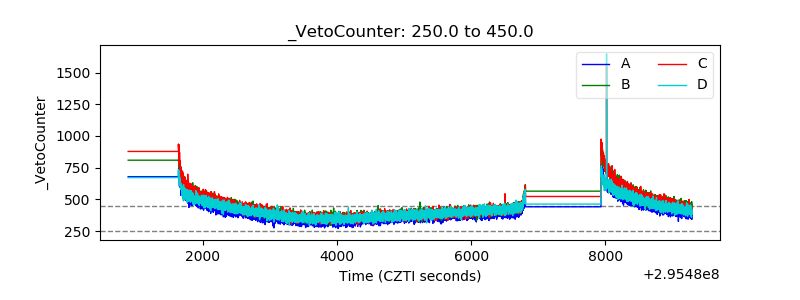 |