| Param | Original file | Final file |
|---|---|---|
| Filename | modeM0/AS1T03_115T01_9000002914_19596cztM0_level2.evt | modeM0/AS1T03_115T01_9000002914_19596cztM0_level2_quad_clean.evt |
| Size (bytes) | 465,940,800 | 102,810,240 |
| Size | 444.4 MB | 98.0 MB |
| Events in quadrant A | 3,094,763 | 678,005 |
| Events in quadrant B | 3,193,121 | 700,223 |
| Events in quadrant C | 3,156,658 | 666,665 |
| Events in quadrant D | 4,233,191 | 623,649 |
| Mode M9 | |||
|---|---|---|---|
| Quadrant | BADHDUFLAG | Total packets | Discarded packets |
| A | 0 | 20 | 0 |
| B | 0 | 21 | 0 |
| C | 0 | 21 | 0 |
| D | 0 | 21 | 0 |
| Mode SS | |||
|---|---|---|---|
| Quadrant | BADHDUFLAG | Total packets | Discarded packets |
| A | 0 | 130 | 0 |
| B | 0 | 130 | 0 |
| C | 0 | 130 | 0 |
| D | 0 | 130 | 0 |
| Mode M0 | |||
|---|---|---|---|
| Quadrant | BADHDUFLAG | Total packets | Discarded packets |
| A | 0 | 13386 | 2 |
| B | 0 | 13663 | 2 |
| C | 0 | 13606 | 2 |
| D | 0 | 16892 | 2 |
| Quadrant | Total seconds | Saturated seconds | Saturation percentage |
|---|---|---|---|
| A | 6378 | 15 | 0.235183% |
| B | 6378 | 37 | 0.580119% |
| C | 6378 | 59 | 0.925055% |
| D | 6378 | 206 | 3.229853% |
Noise dominated data is calculated using 1-second bins in cleaned event files. If a bin has >2000 counts, and if more than 50% of those come from <1% of pixels, then it is considered to be noise-dominated and hence unusable.
| Quadrant | # 1 sec bins | Bins with >0 counts | Bins with >2000 counts | High rate bins dominated by noise | Noise dominated (total time) | Noise dominated (detector-on time) | Marked lightcurve |
|---|---|---|---|---|---|---|---|
| A | 7583 | 6379 | 0 | 0 | 0.00% | 0.00% | 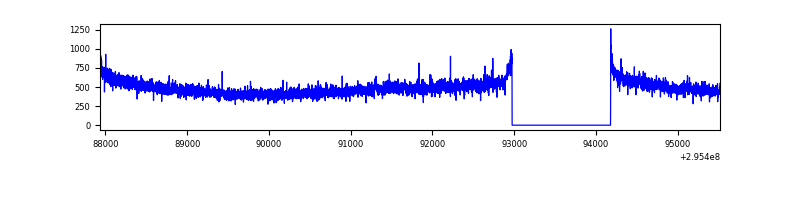 |
| B | 7583 | 6379 | 3 | 3 | 0.04% | 0.05% | 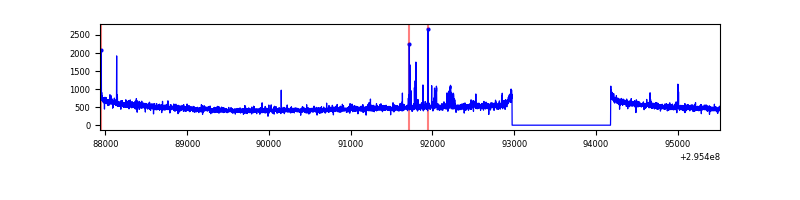 |
| C | 7583 | 6379 | 2 | 2 | 0.03% | 0.03% | 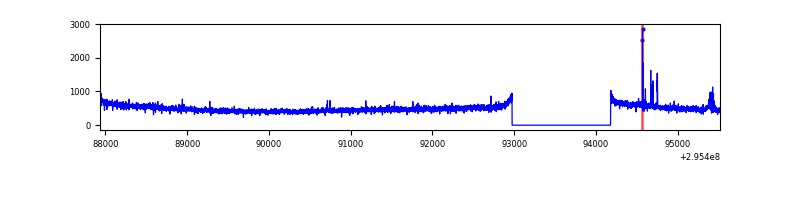 |
| D | 7583 | 6379 | 190 | 190 | 2.51% | 2.98% | 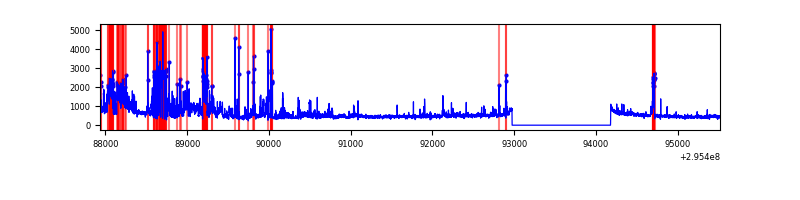 |
Top three noisy pixels from each quadrant. If the there are fewer than three noisy pixels in the level2.evt file, extra rows are filled as -1
| Pixel properties | Quadrant properties | ||||||
|---|---|---|---|---|---|---|---|
| Quadrant | DetID | PixID | Counts | Sigma | Mean | Median | Sigma |
| A | 11 | 29 | 46400 | 288.21 | 788 | 775 | 158.3 |
| A | 13 | 254 | 9036 | 52.18 | 788 | 775 | 158.3 |
| A | 0 | 226 | 6710 | 37.49 | 788 | 775 | 158.3 |
| B | 4 | 216 | 30015 | 195.6 | 794 | 775 | 149.5 |
| B | 7 | 220 | 19721 | 126.74 | 794 | 775 | 149.5 |
| B | 12 | 111 | 17613 | 112.64 | 794 | 775 | 149.5 |
| C | 14 | 238 | 119802 | 673.4 | 762 | 766 | 176.8 |
| C | 5 | 112 | 44589 | 247.91 | 762 | 766 | 176.8 |
| C | 3 | 233 | 15155 | 81.4 | 762 | 766 | 176.8 |
| D | 1 | 52 | 1102407 | 6099.5 | 750 | 730 | 180.6 |
| D | 7 | 38 | 88499 | 485.94 | 750 | 730 | 180.6 |
| D | 7 | 238 | 70607 | 386.88 | 750 | 730 | 180.6 |
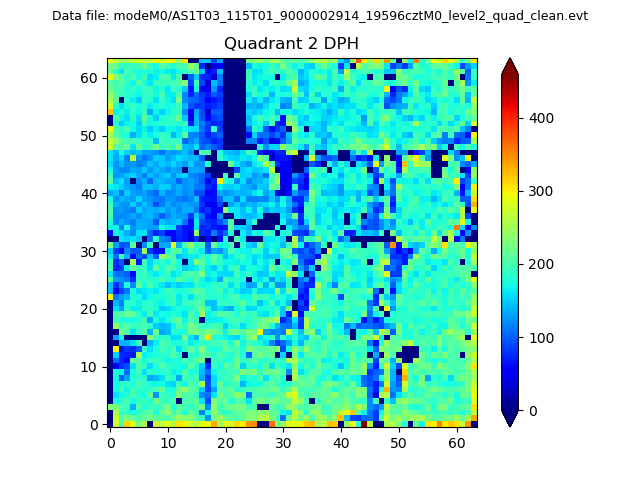
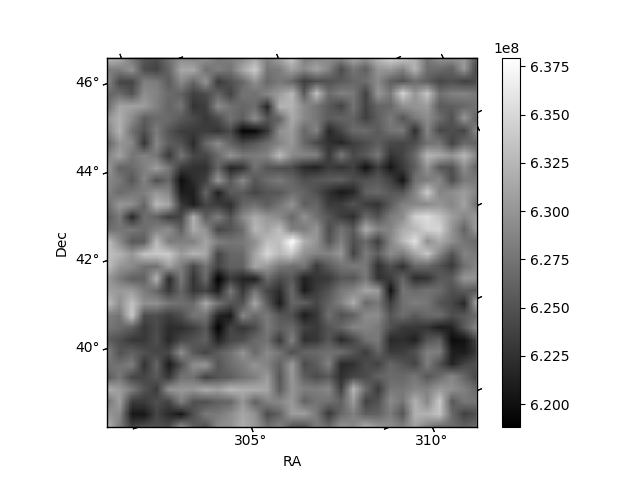
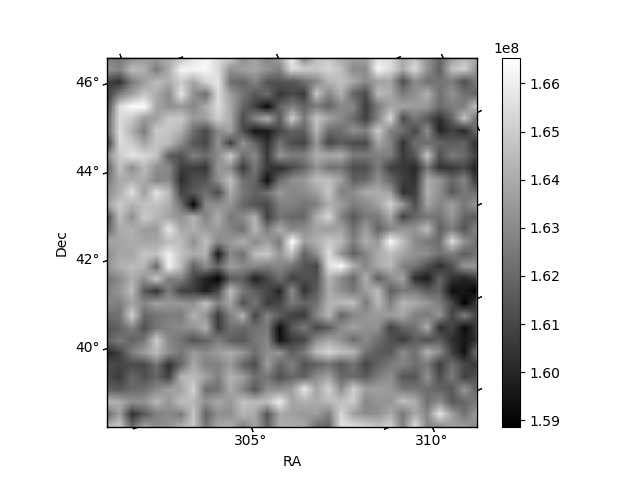
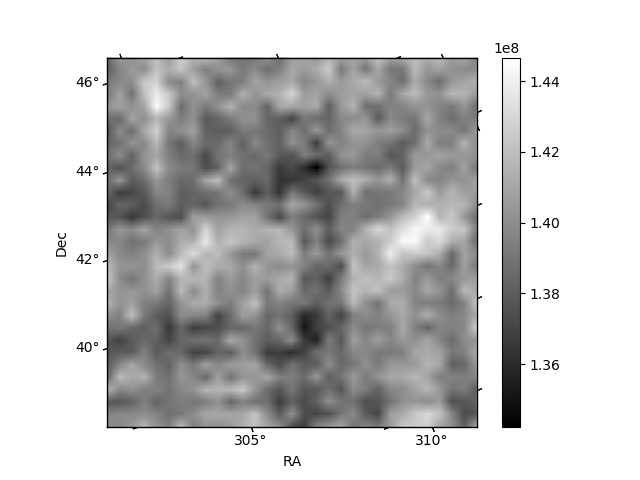
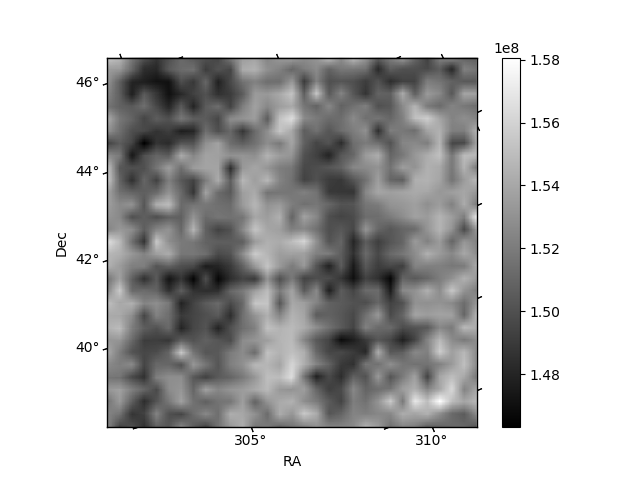
Histogram calculated using DETX and DETY for each event in the final _common_clean file
| Quadrant A | 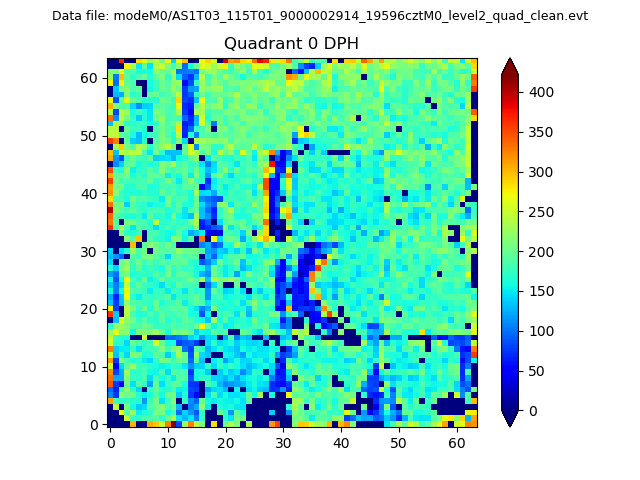 |
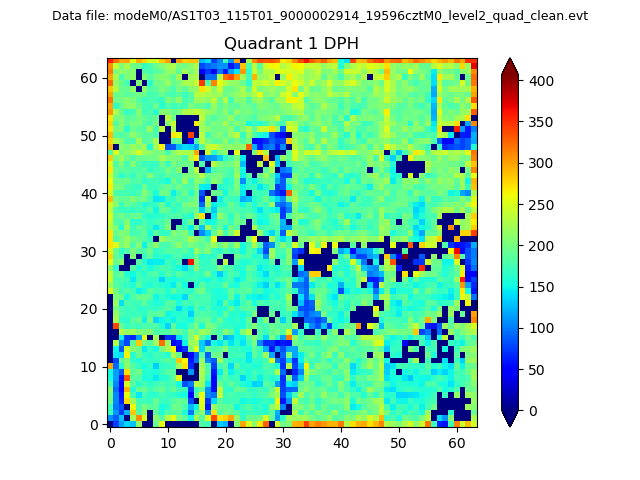 |
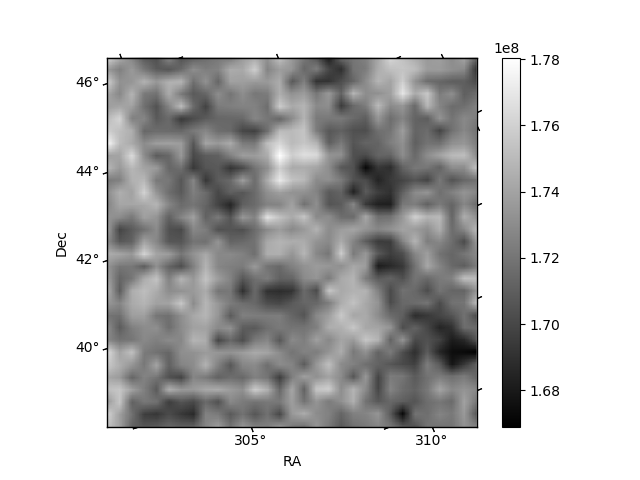
Quadrant B |
|---|---|---|---|
| Quadrant D | 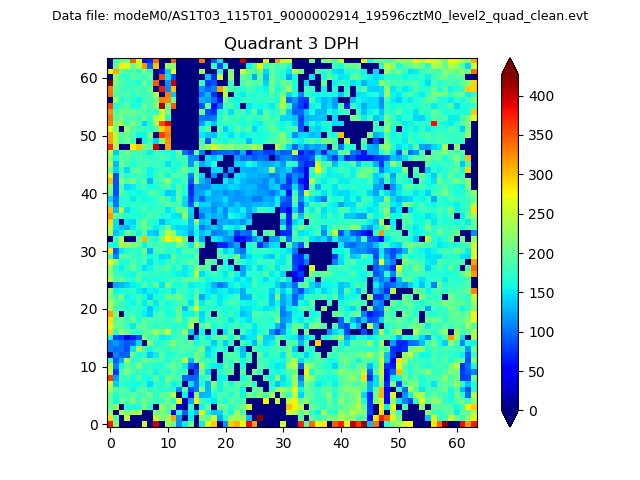 |
 |
Quadrant C |
| Plot type | Count rate plots | Images |
|---|---|---|
| Comparison with Poisson distribution Blue bars denote a histogram of data divided into 1 sec bins. Red curve is a Poisson curve with rate = median count rate of data. |
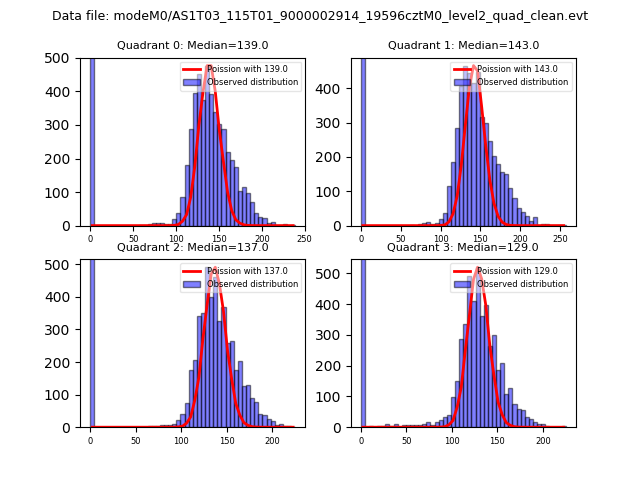 |
 |
| Quadrant-wise count rates Data is divided into 100 sec bins |
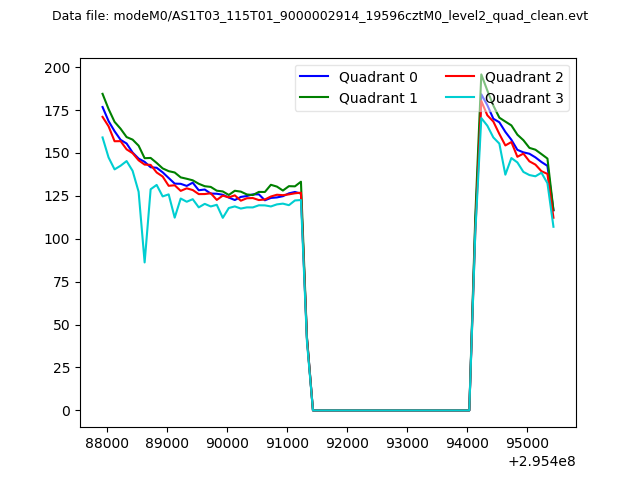 |
|
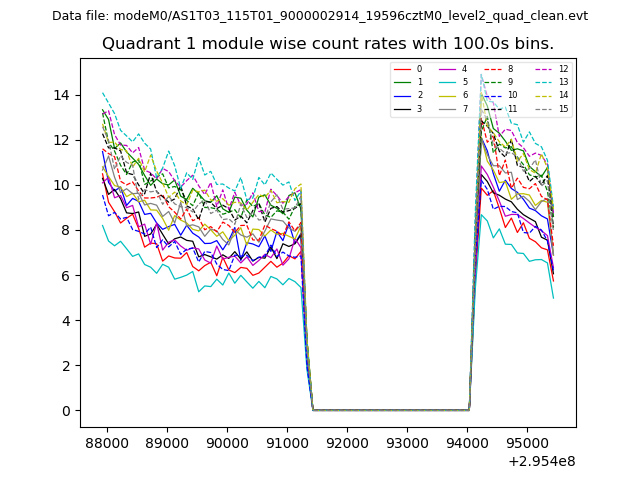
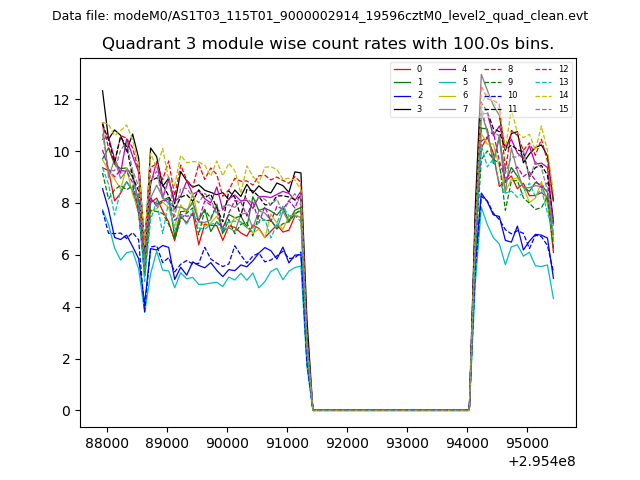
| Module-wise count rates for Quadrant A Data is divided into 100 sec bins |
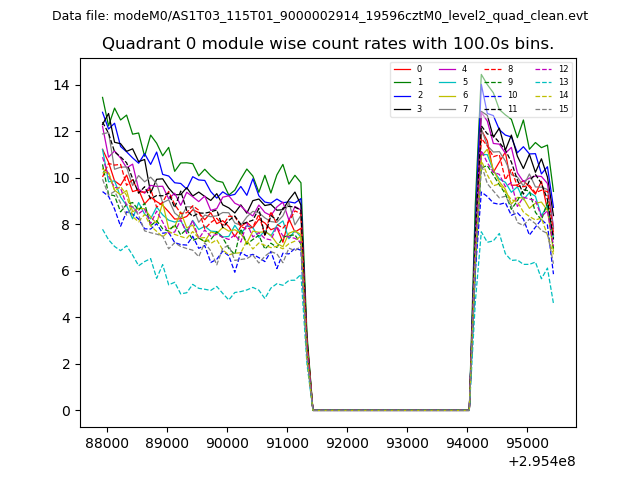 |
 |
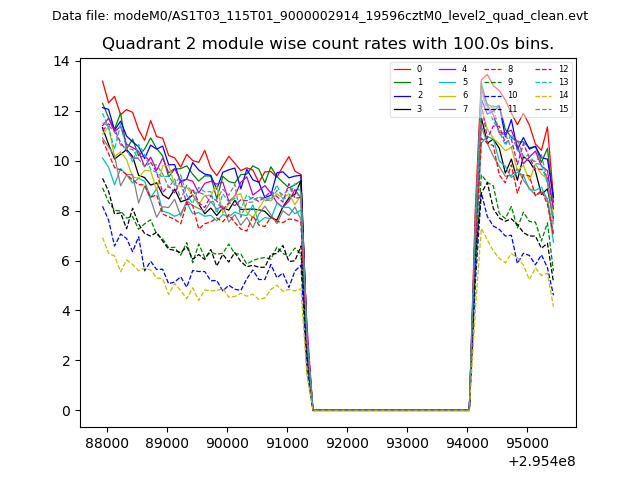
| Module-wise count rates for Quadrant B Data is divided into 100 sec bins |
 |
 |
| Module-wise count rates for Quadrant C Data is divided into 100 sec bins |
 |
 |
| Module-wise count rates for Quadrant D Data is divided into 100 sec bins |
 |
 |
| Parameter | Plot |
|---|---|
| CZT HV Monitor | 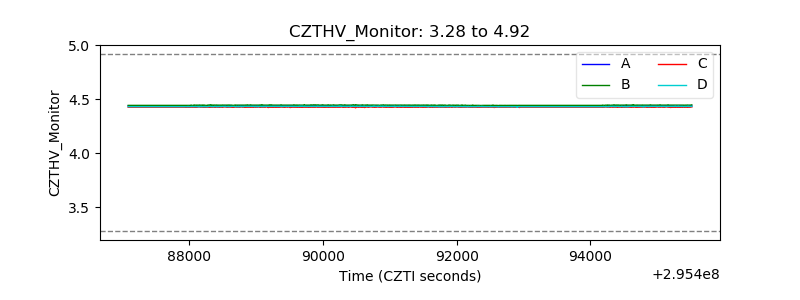 |
| D_VDD |  |
| Temperature 1 |  |
| Veto HV Monitor | 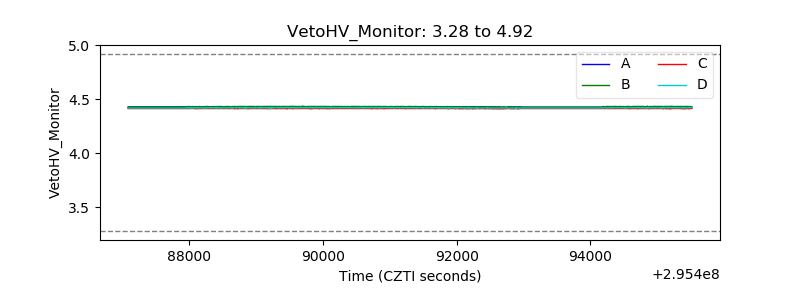 |
| Veto LLD | 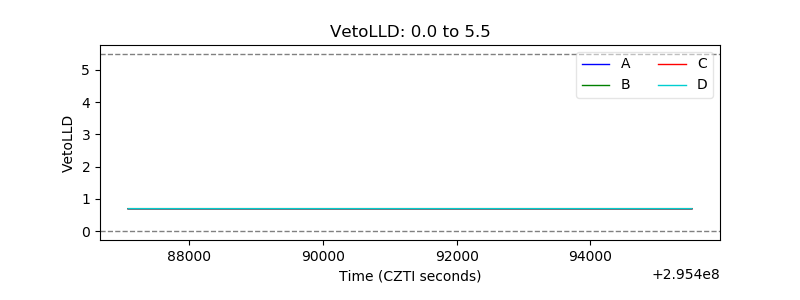 |
| Alpha Counter | 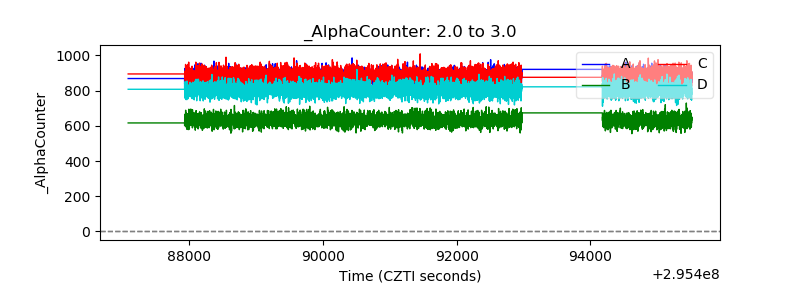 |
| _CPM_Rate | 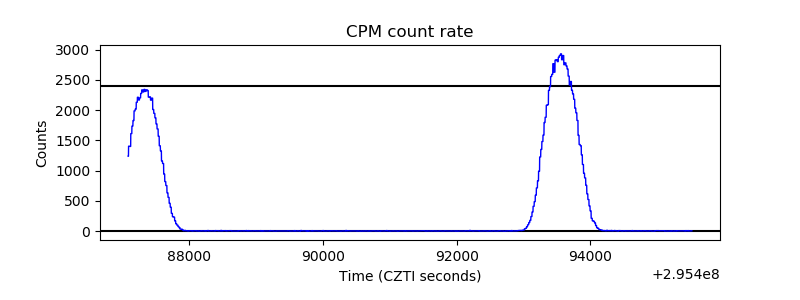 |
| CZT Counter | 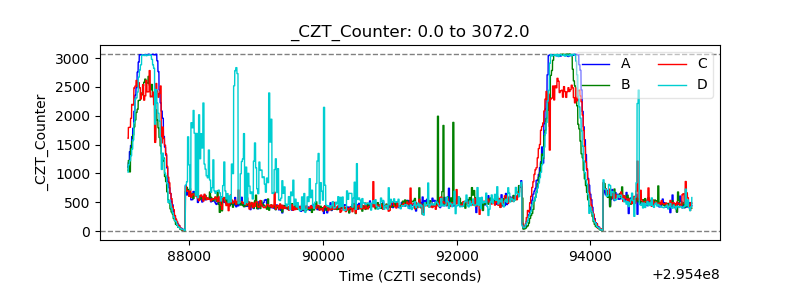 |
| +2.5 Volts monitor |  |
| +5 Volts monitor |  |
| _ROLL_ROT | 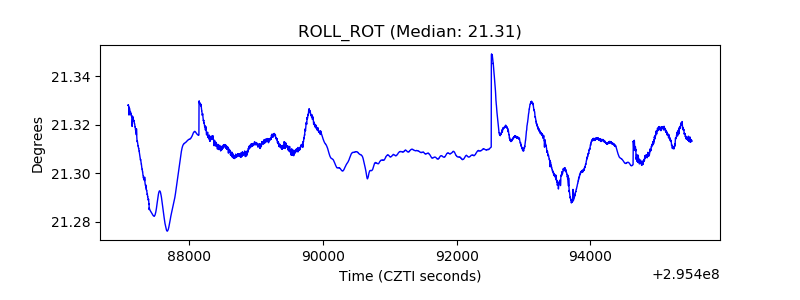 |
| _Roll_DEC | 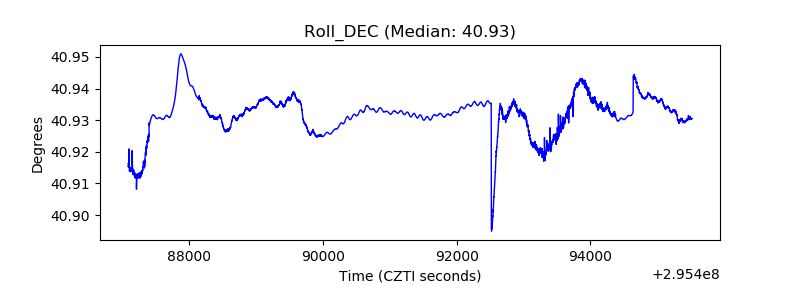 |
| _Roll_RA | 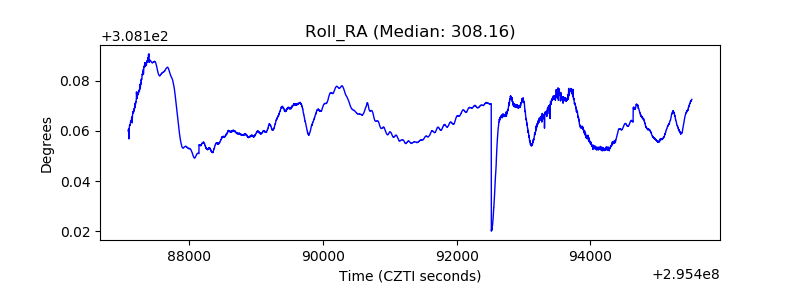 |
| Veto Counter | 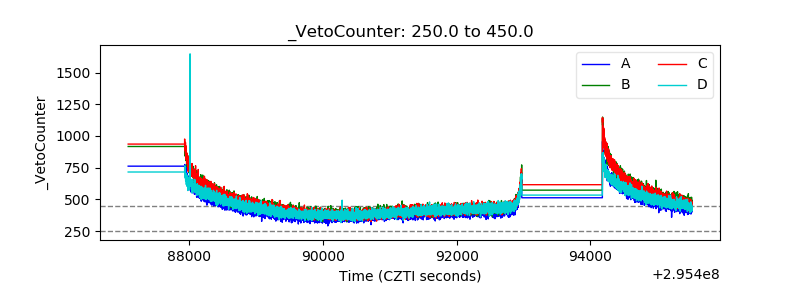 |