| Param | Original file | Final file |
|---|---|---|
| Filename | modeM0/AS1T03_115T01_9000002914_19598cztM0_level2.evt | modeM0/AS1T03_115T01_9000002914_19598cztM0_level2_quad_clean.evt |
| Size (bytes) | 743,751,360 | 145,175,040 |
| Size | 709.3 MB | 138.4 MB |
| Events in quadrant A | 5,150,725 | 934,434 |
| Events in quadrant B | 5,215,247 | 959,171 |
| Events in quadrant C | 5,192,938 | 903,944 |
| Events in quadrant D | 6,262,485 | 880,407 |
| Mode M9 | |||
|---|---|---|---|
| Quadrant | BADHDUFLAG | Total packets | Discarded packets |
| A | 0 | 26 | 0 |
| B | 0 | 26 | 0 |
| C | 0 | 26 | 0 |
| D | 0 | 26 | 0 |
| Mode SS | |||
|---|---|---|---|
| Quadrant | BADHDUFLAG | Total packets | Discarded packets |
| A | 0 | 212 | 0 |
| B | 0 | 212 | 0 |
| C | 0 | 212 | 0 |
| D | 0 | 212 | 0 |
| Mode M0 | |||
|---|---|---|---|
| Quadrant | BADHDUFLAG | Total packets | Discarded packets |
| A | 0 | 21684 | 2 |
| B | 0 | 21886 | 2 |
| C | 0 | 21955 | 2 |
| D | 0 | 25658 | 2 |
| Quadrant | Total seconds | Saturated seconds | Saturation percentage |
|---|---|---|---|
| A | 10379 | 34 | 0.327585% |
| B | 10380 | 79 | 0.761079% |
| C | 10380 | 91 | 0.876686% |
| D | 10380 | 374 | 3.603083% |
Noise dominated data is calculated using 1-second bins in cleaned event files. If a bin has >2000 counts, and if more than 50% of those come from <1% of pixels, then it is considered to be noise-dominated and hence unusable.
| Quadrant | # 1 sec bins | Bins with >0 counts | Bins with >2000 counts | High rate bins dominated by noise | Noise dominated (total time) | Noise dominated (detector-on time) | Marked lightcurve |
|---|---|---|---|---|---|---|---|
| A | 12999 | 10381 | 4 | 4 | 0.03% | 0.04% | 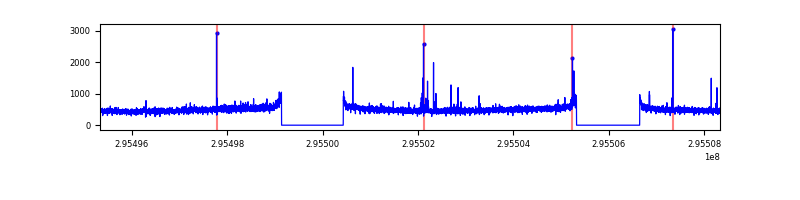 |
| B | 13000 | 10382 | 6 | 6 | 0.05% | 0.06% | 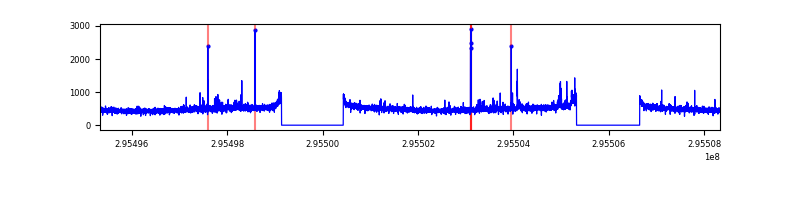 |
| C | 13000 | 10381 | 5 | 5 | 0.04% | 0.05% | 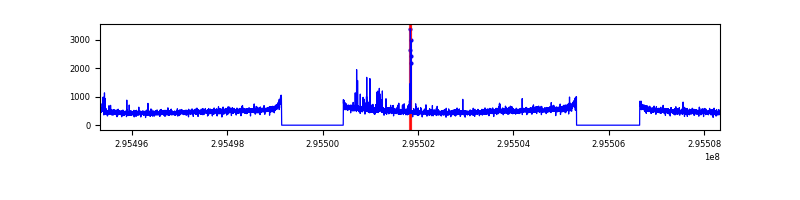 |
| D | 13000 | 10382 | 286 | 286 | 2.20% | 2.75% | 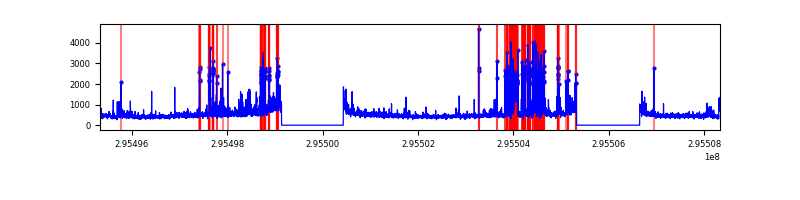 |
Top three noisy pixels from each quadrant. If the there are fewer than three noisy pixels in the level2.evt file, extra rows are filled as -1
| Pixel properties | Quadrant properties | ||||||
|---|---|---|---|---|---|---|---|
| Quadrant | DetID | PixID | Counts | Sigma | Mean | Median | Sigma |
| A | 5 | 16 | 54738 | 206.2 | 1304 | 1282 | 259.2 |
| A | 11 | 29 | 49560 | 186.23 | 1304 | 1282 | 259.2 |
| A | 11 | 47 | 21236 | 76.97 | 1304 | 1282 | 259.2 |
| B | 4 | 216 | 54330 | 219.28 | 1301 | 1272 | 242.0 |
| B | 12 | 111 | 27639 | 108.97 | 1301 | 1272 | 242.0 |
| B | 11 | 111 | 23688 | 92.64 | 1301 | 1272 | 242.0 |
| C | 14 | 238 | 198329 | 698.64 | 1235 | 1245 | 282.1 |
| C | 5 | 112 | 107225 | 375.68 | 1235 | 1245 | 282.1 |
| C | 3 | 233 | 42977 | 147.93 | 1235 | 1245 | 282.1 |
| D | 1 | 52 | 1109737 | 3713.32 | 1235 | 1197 | 298.5 |
| D | 7 | 38 | 221279 | 737.22 | 1235 | 1197 | 298.5 |
| D | 7 | 238 | 158036 | 525.37 | 1235 | 1197 | 298.5 |
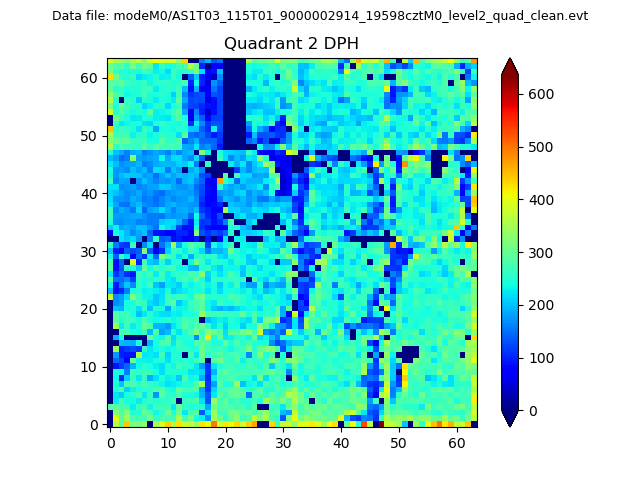
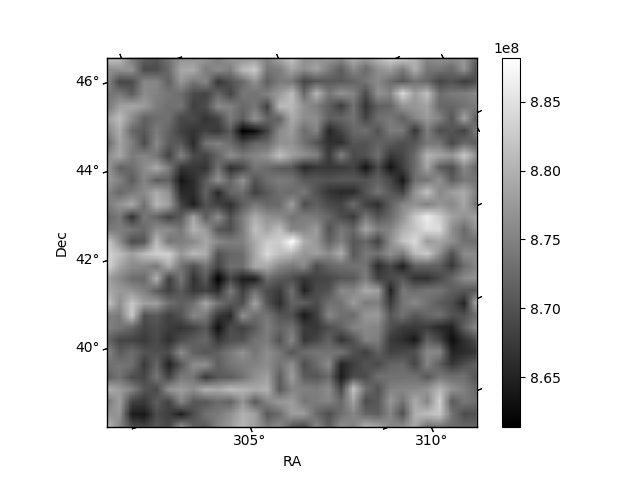
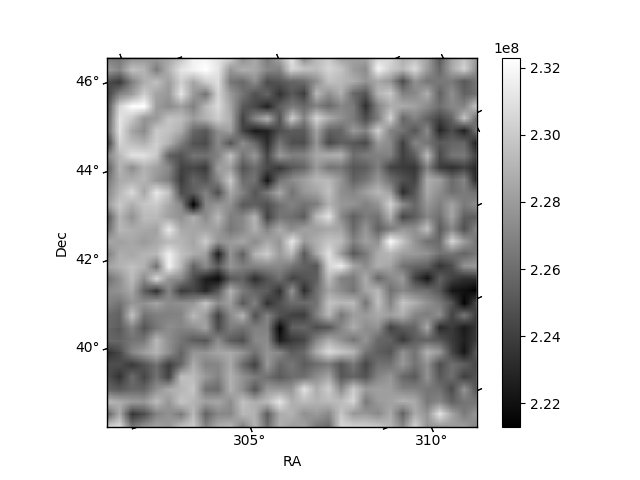
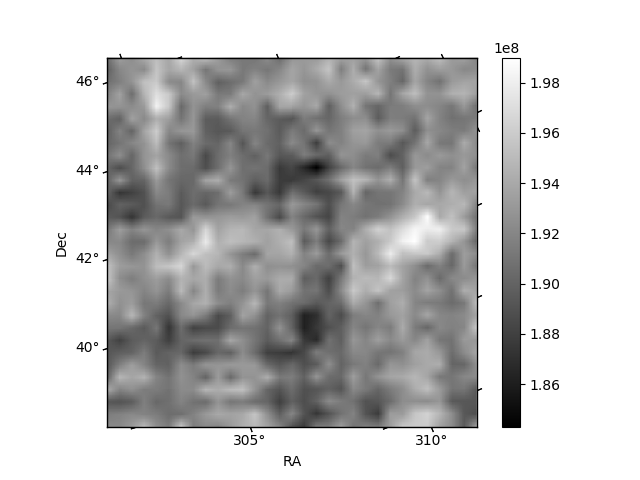
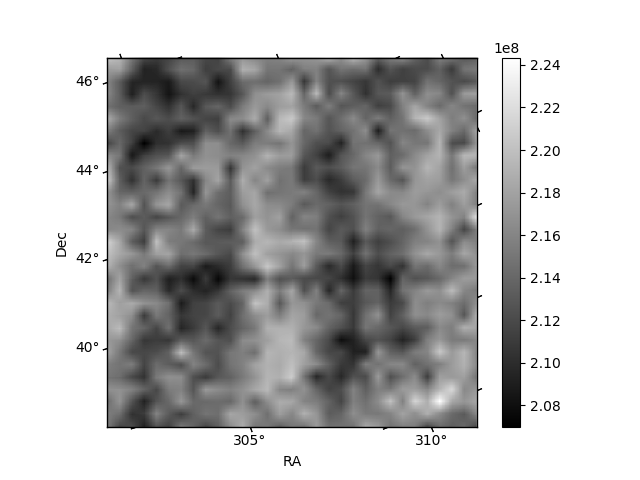
Histogram calculated using DETX and DETY for each event in the final _common_clean file
| Quadrant A | 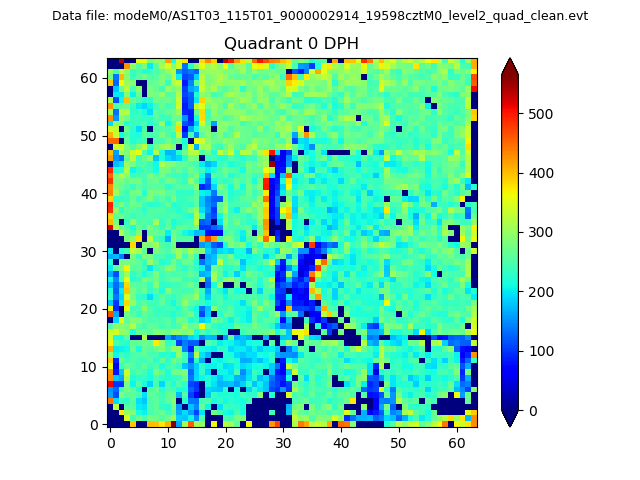 |
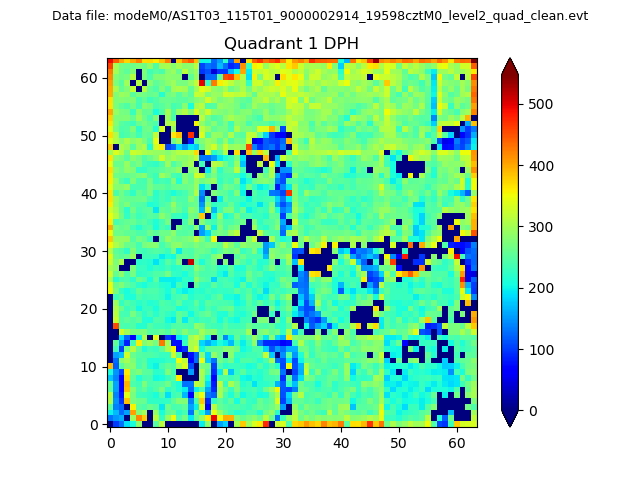 |
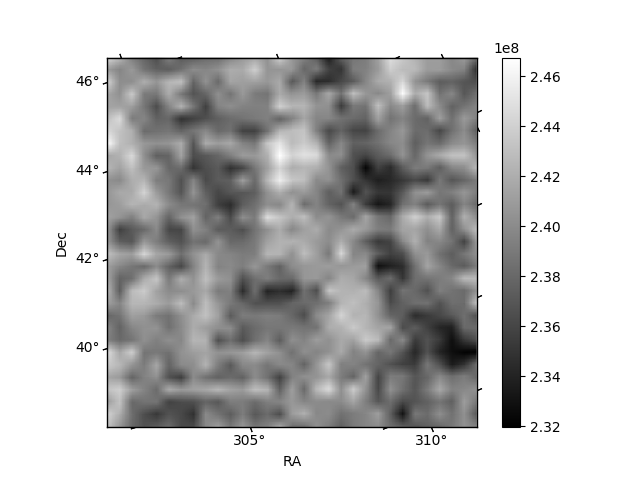
Quadrant B |
|---|---|---|---|
| Quadrant D | 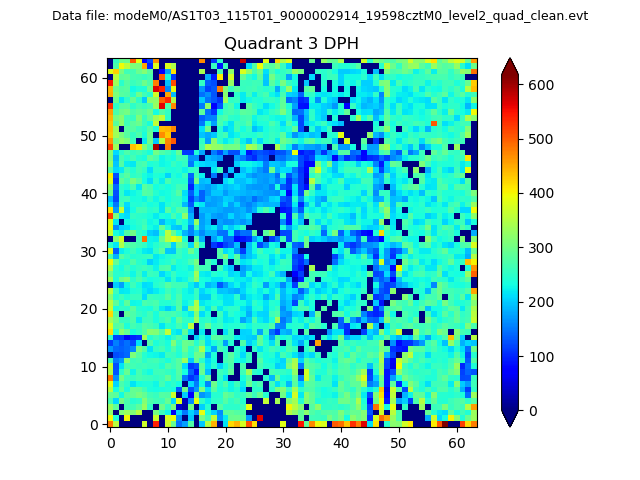 |
 |
Quadrant C |
| Plot type | Count rate plots | Images |
|---|---|---|
| Comparison with Poisson distribution Blue bars denote a histogram of data divided into 1 sec bins. Red curve is a Poisson curve with rate = median count rate of data. |
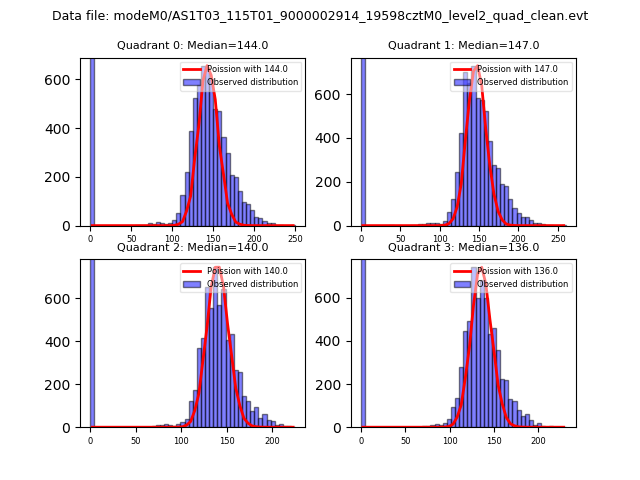 |
 |
| Quadrant-wise count rates Data is divided into 100 sec bins |
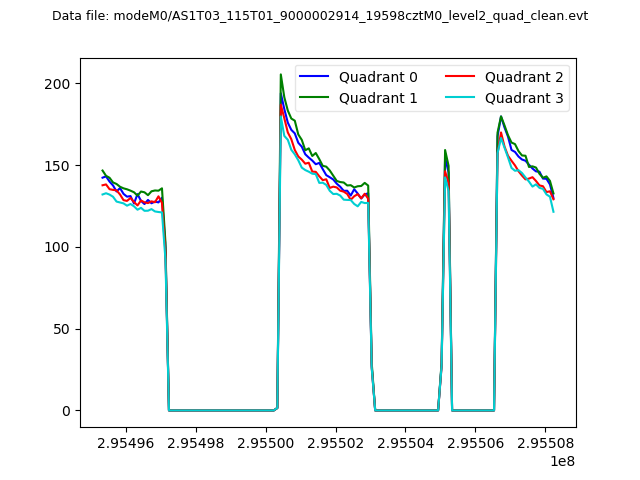 |
|
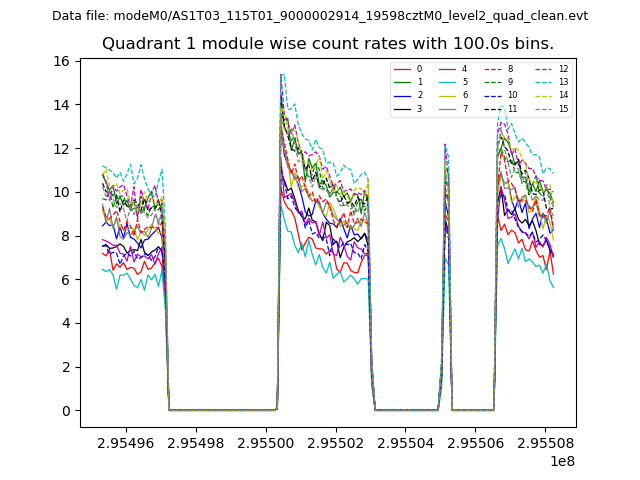
| Module-wise count rates for Quadrant A Data is divided into 100 sec bins |
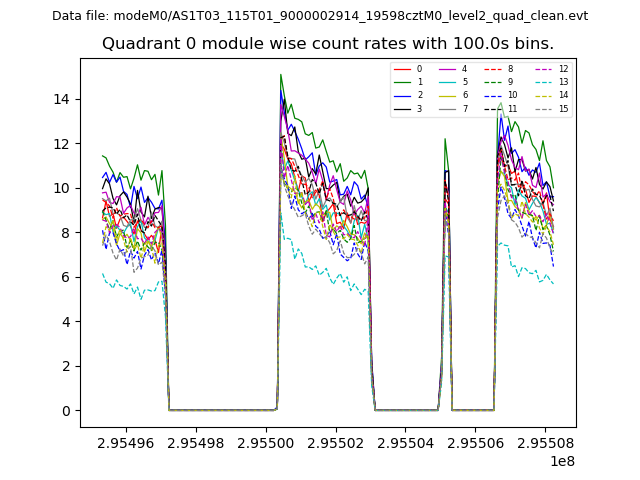 |
 |
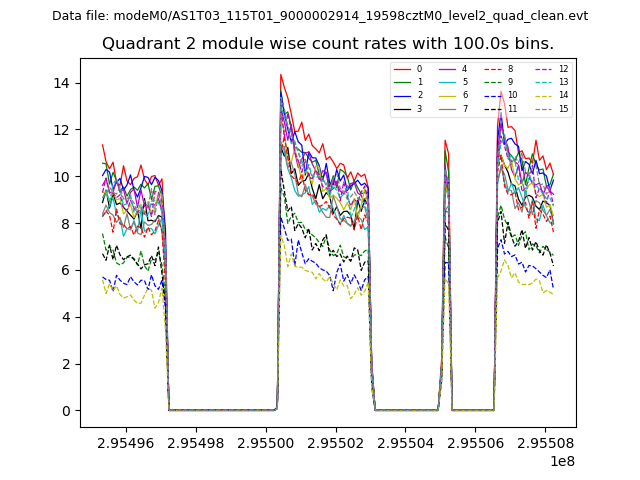
| Module-wise count rates for Quadrant B Data is divided into 100 sec bins |
 |
 |
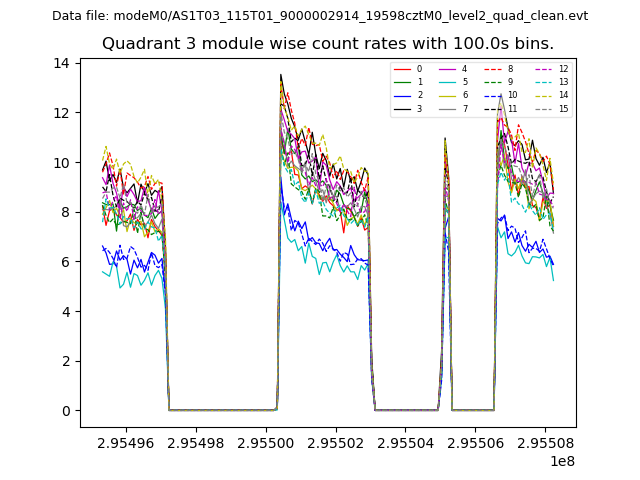
| Module-wise count rates for Quadrant C Data is divided into 100 sec bins |
 |
 |
| Module-wise count rates for Quadrant D Data is divided into 100 sec bins |
 |
 |
| Parameter | Plot |
|---|---|
| CZT HV Monitor | 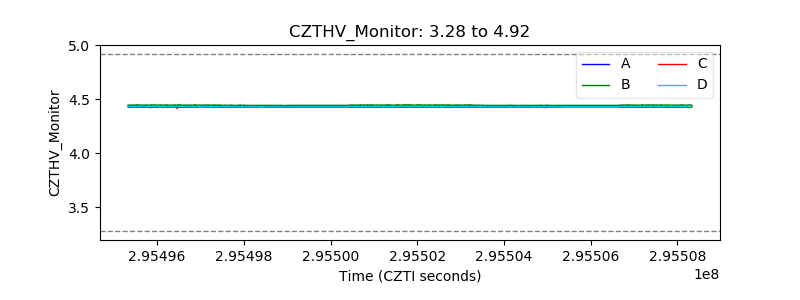 |
| D_VDD |  |
| Temperature 1 | 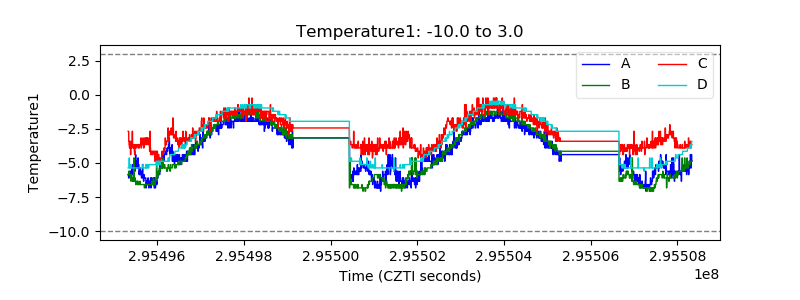 |
| Veto HV Monitor |  |
| Veto LLD | 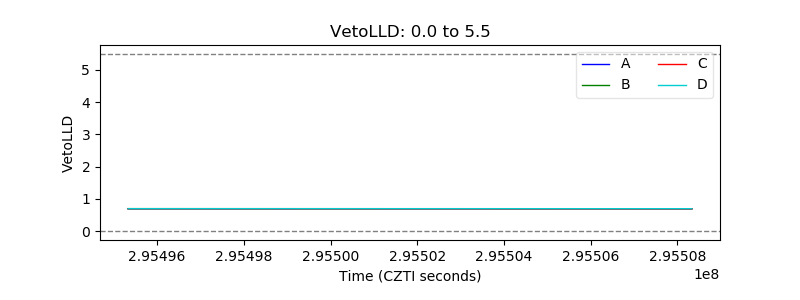 |
| Alpha Counter | 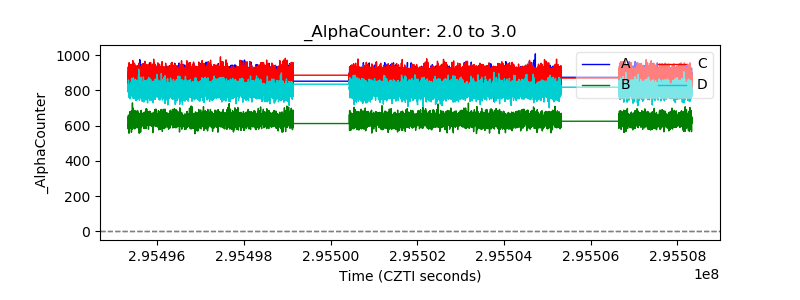 |
| _CPM_Rate | 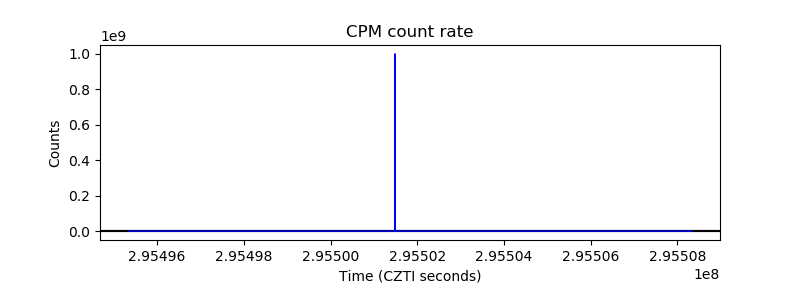 |
| CZT Counter | 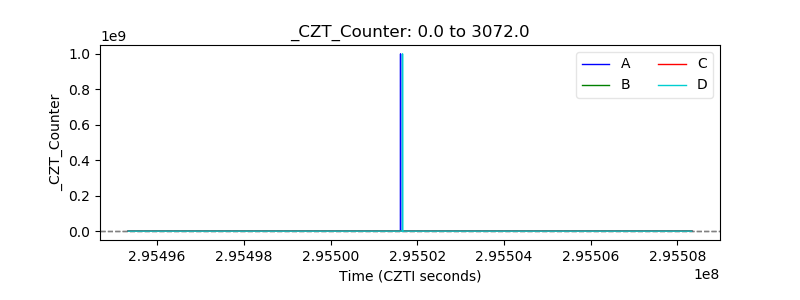 |
| +2.5 Volts monitor |  |
| +5 Volts monitor |  |
| _ROLL_ROT | 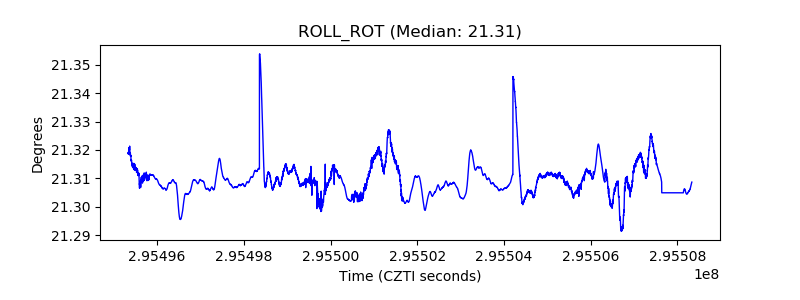 |
| _Roll_DEC | 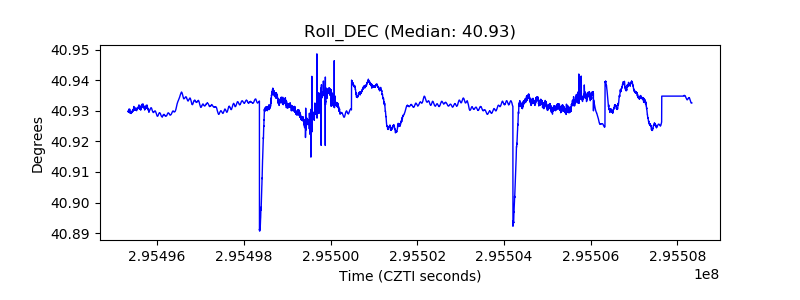 |
| _Roll_RA |  |
| Veto Counter | 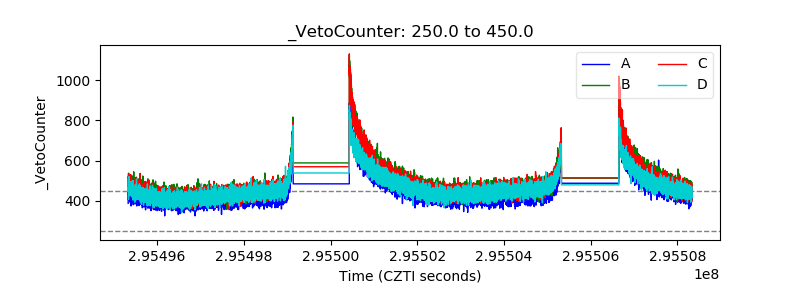 |