| Param | Original file | Final file |
|---|---|---|
| Filename | modeM0/AS1T03_115T01_9000002914_19601cztM0_level2.evt | modeM0/AS1T03_115T01_9000002914_19601cztM0_level2_quad_clean.evt |
| Size (bytes) | 429,408,000 | 91,275,840 |
| Size | 409.5 MB | 87.0 MB |
| Events in quadrant A | 3,154,629 | 588,876 |
| Events in quadrant B | 3,207,173 | 589,529 |
| Events in quadrant C | 3,099,975 | 564,620 |
| Events in quadrant D | 3,098,925 | 566,066 |
| Mode M9 | |||
|---|---|---|---|
| Quadrant | BADHDUFLAG | Total packets | Discarded packets |
| A | 0 | 7 | 0 |
| B | 0 | 7 | 0 |
| C | 0 | 7 | 0 |
| D | 0 | 7 | 0 |
| Mode SS | |||
|---|---|---|---|
| Quadrant | BADHDUFLAG | Total packets | Discarded packets |
| A | 0 | 132 | 0 |
| B | 0 | 132 | 0 |
| C | 0 | 132 | 0 |
| D | 0 | 132 | 0 |
| Mode M0 | |||
|---|---|---|---|
| Quadrant | BADHDUFLAG | Total packets | Discarded packets |
| A | 0 | 13560 | 1 |
| B | 0 | 13648 | 1 |
| C | 0 | 13449 | 2 |
| D | 0 | 13744 | 1 |
| Quadrant | Total seconds | Saturated seconds | Saturation percentage |
|---|---|---|---|
| A | 6526 | 138 | 2.114618% |
| B | 6527 | 131 | 2.007048% |
| C | 6526 | 137 | 2.099295% |
| D | 6526 | 112 | 1.716212% |
Noise dominated data is calculated using 1-second bins in cleaned event files. If a bin has >2000 counts, and if more than 50% of those come from <1% of pixels, then it is considered to be noise-dominated and hence unusable.
| Quadrant | # 1 sec bins | Bins with >0 counts | Bins with >2000 counts | High rate bins dominated by noise | Noise dominated (total time) | Noise dominated (detector-on time) | Marked lightcurve |
|---|---|---|---|---|---|---|---|
| A | 7216 | 6526 | 2 | 2 | 0.03% | 0.03% |  |
| B | 7217 | 6527 | 1 | 1 | 0.01% | 0.02% |  |
| C | 7216 | 6526 | 0 | 0 | 0.00% | 0.00% |  |
| D | 7216 | 6526 | 8 | 8 | 0.11% | 0.12% | 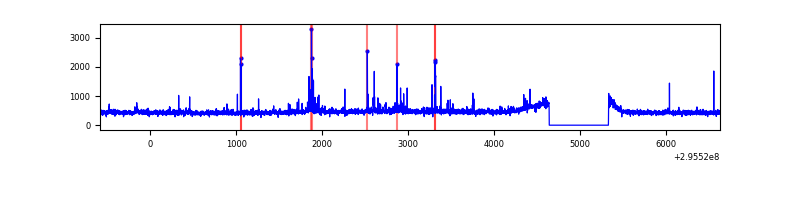 |
Top three noisy pixels from each quadrant. If the there are fewer than three noisy pixels in the level2.evt file, extra rows are filled as -1
| Pixel properties | Quadrant properties | ||||||
|---|---|---|---|---|---|---|---|
| Quadrant | DetID | PixID | Counts | Sigma | Mean | Median | Sigma |
| A | 11 | 29 | 36711 | 220.77 | 801 | 782 | 162.7 |
| A | 3 | 243 | 14518 | 84.4 | 801 | 782 | 162.7 |
| A | 9 | 143 | 11358 | 64.99 | 801 | 782 | 162.7 |
| B | 3 | 64 | 24772 | 160.52 | 792 | 772 | 149.5 |
| B | 12 | 111 | 17984 | 115.12 | 792 | 772 | 149.5 |
| B | 0 | 190 | 17035 | 108.77 | 792 | 772 | 149.5 |
| C | 14 | 238 | 118063 | 662.56 | 758 | 762 | 177.0 |
| C | 3 | 233 | 20772 | 113.02 | 758 | 762 | 177.0 |
| C | 13 | 61 | 5272 | 25.47 | 758 | 762 | 177.0 |
| D | 1 | 52 | 64551 | 339.77 | 776 | 754 | 187.8 |
| D | 7 | 38 | 33395 | 173.84 | 776 | 754 | 187.8 |
| D | 13 | 172 | 26413 | 136.66 | 776 | 754 | 187.8 |
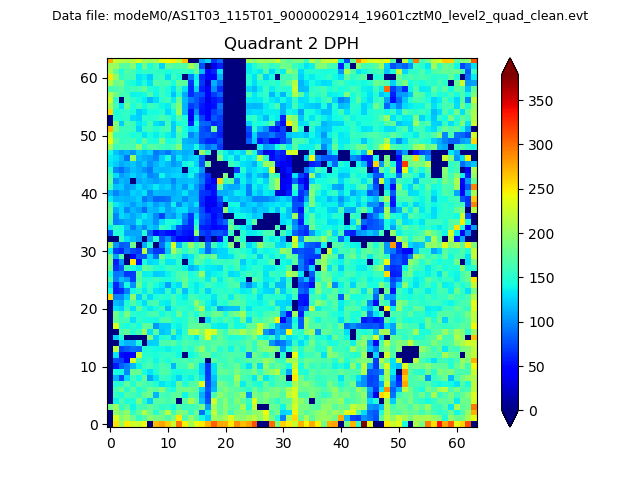
Histogram calculated using DETX and DETY for each event in the final _common_clean file
| Quadrant A | 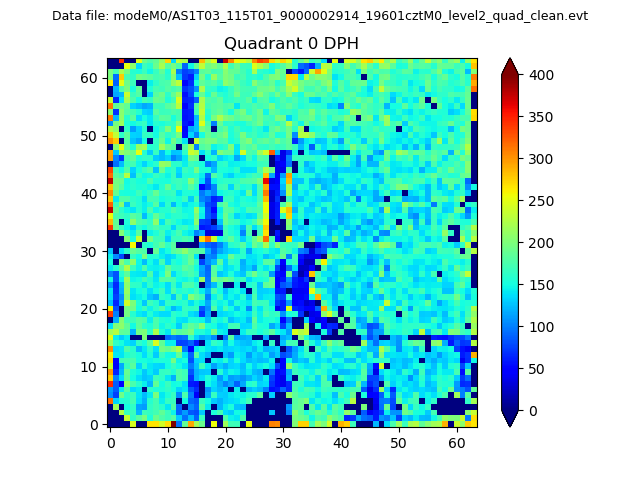 |
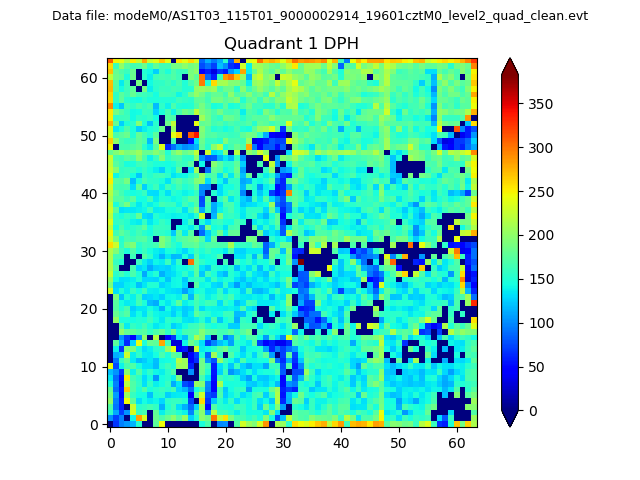 |
Quadrant B |
|---|---|---|---|
| Quadrant D | 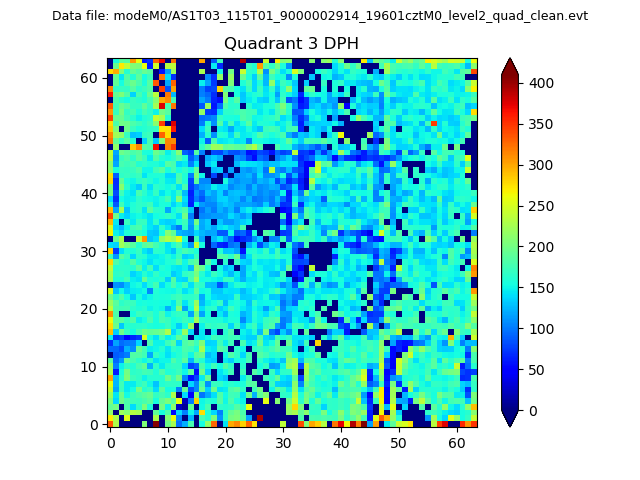 |
 |
Quadrant C |
| Plot type | Count rate plots | Images |
|---|---|---|
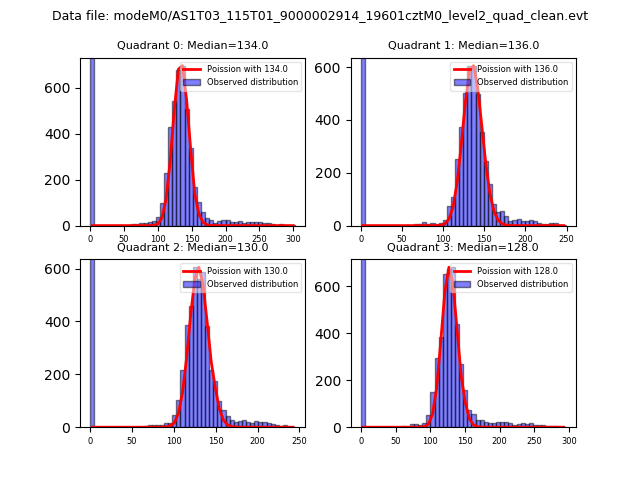
| Comparison with Poisson distribution Blue bars denote a histogram of data divided into 1 sec bins. Red curve is a Poisson curve with rate = median count rate of data. |
 |
 |
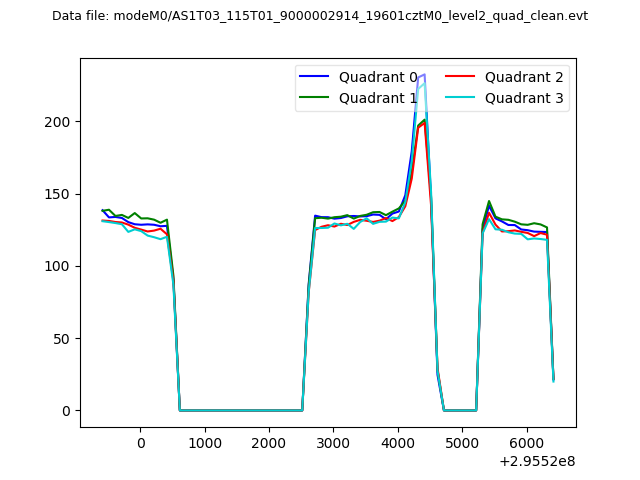
| Quadrant-wise count rates Data is divided into 100 sec bins |
 |
|
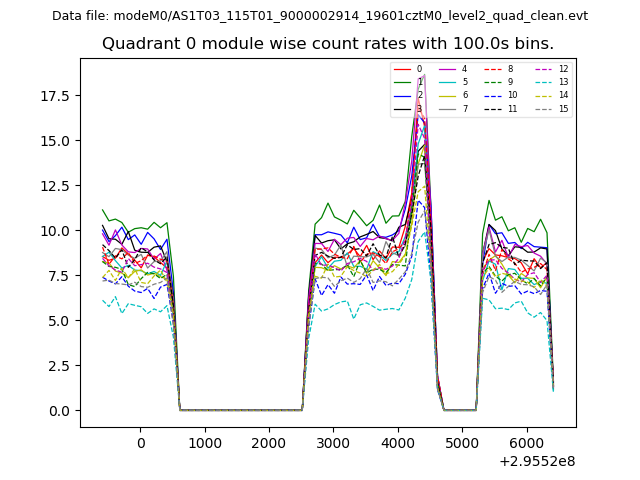
| Module-wise count rates for Quadrant A Data is divided into 100 sec bins |
 |
 |
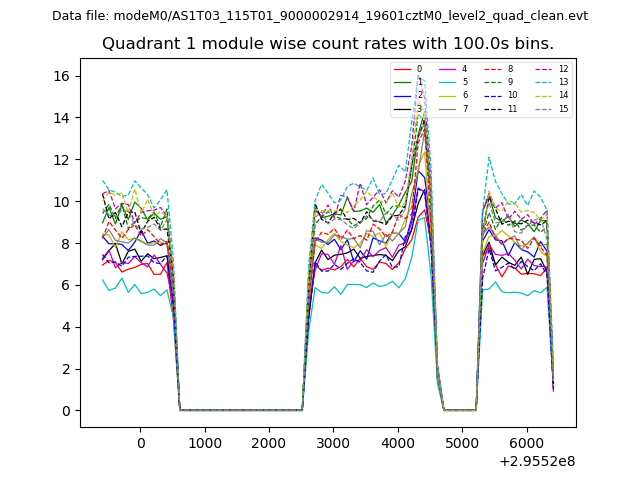
| Module-wise count rates for Quadrant B Data is divided into 100 sec bins |
 |
 |
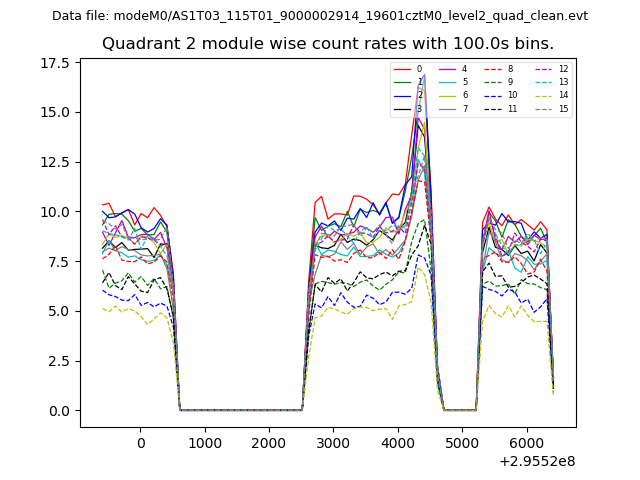
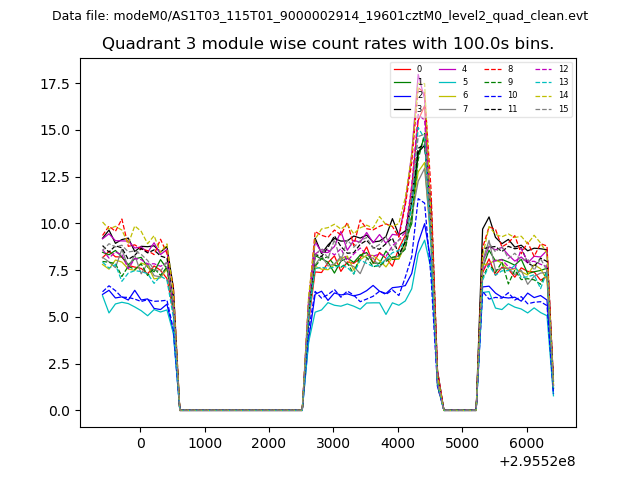
| Module-wise count rates for Quadrant C Data is divided into 100 sec bins |
 |
 |
| Module-wise count rates for Quadrant D Data is divided into 100 sec bins |
 |
 |
| Parameter | Plot |
|---|---|
| CZT HV Monitor | 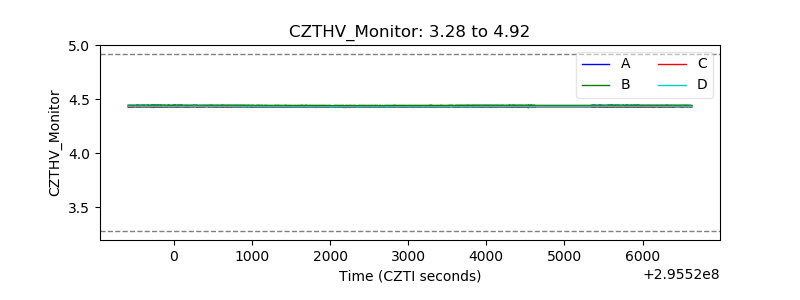 |
| D_VDD | 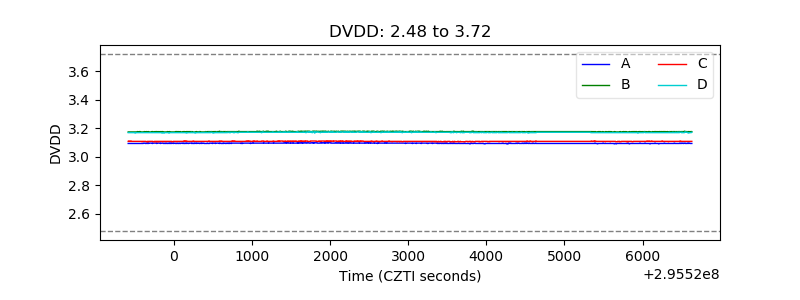 |
| Temperature 1 | 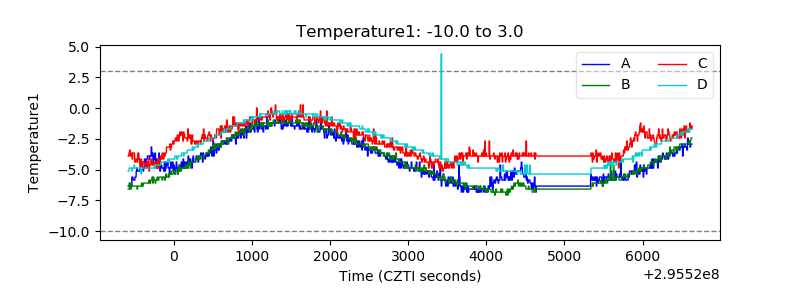 |
| Veto HV Monitor | 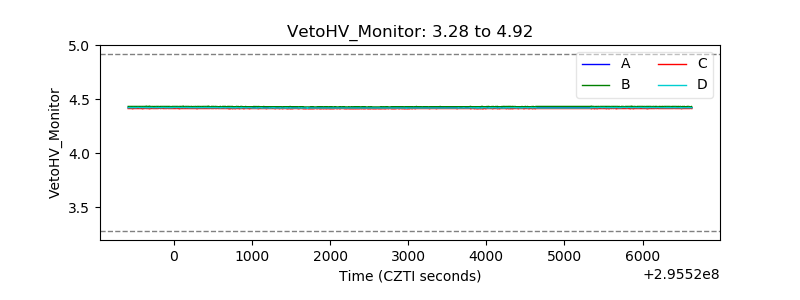 |
| Veto LLD | 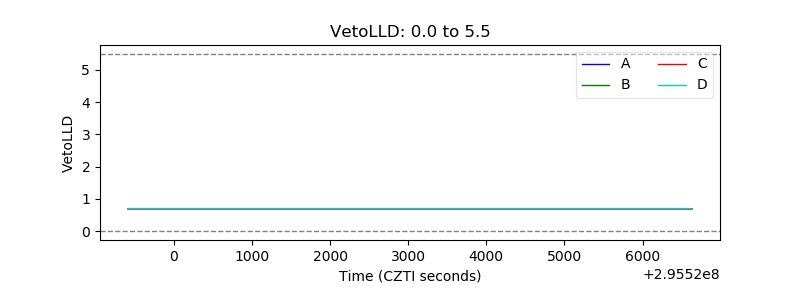 |
| Alpha Counter | 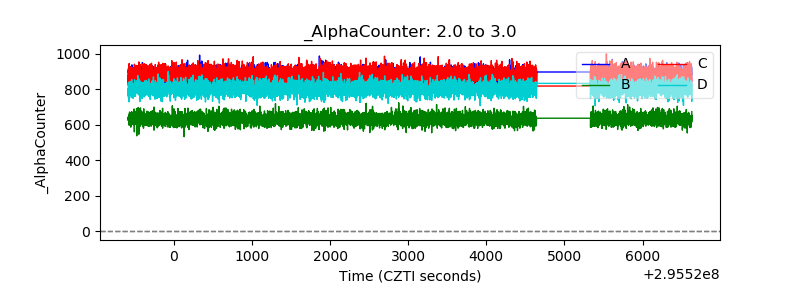 |
| _CPM_Rate | 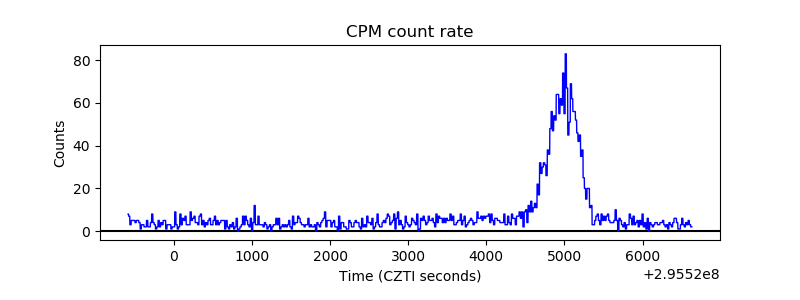 |
| CZT Counter | 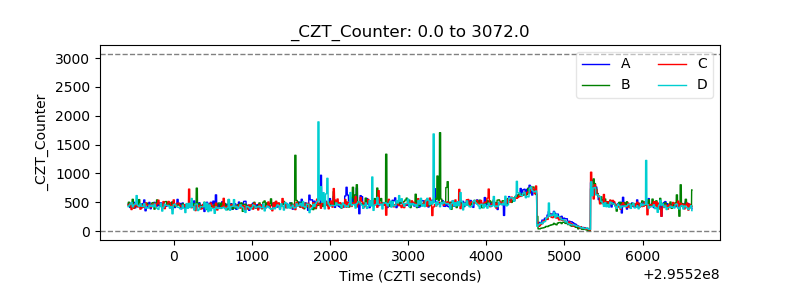 |
| +2.5 Volts monitor |  |
| +5 Volts monitor |  |
| _ROLL_ROT | 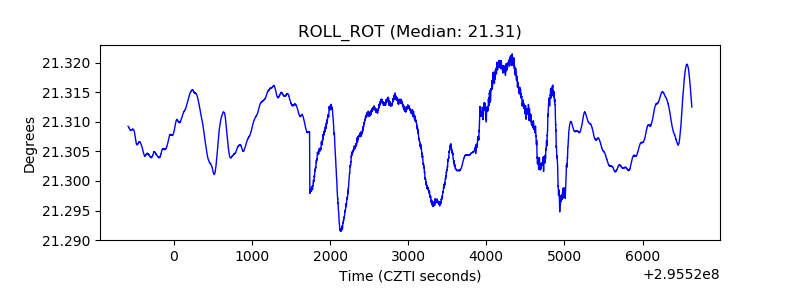 |
| _Roll_DEC | 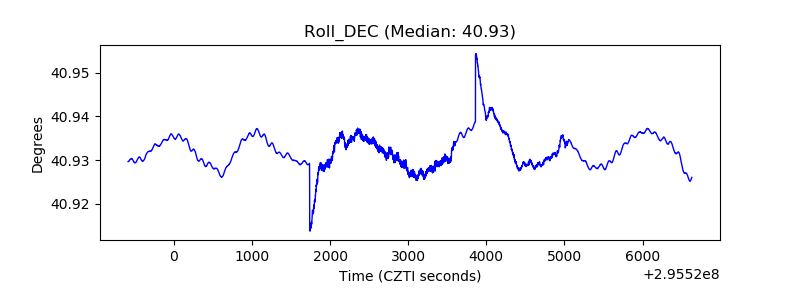 |
| _Roll_RA | 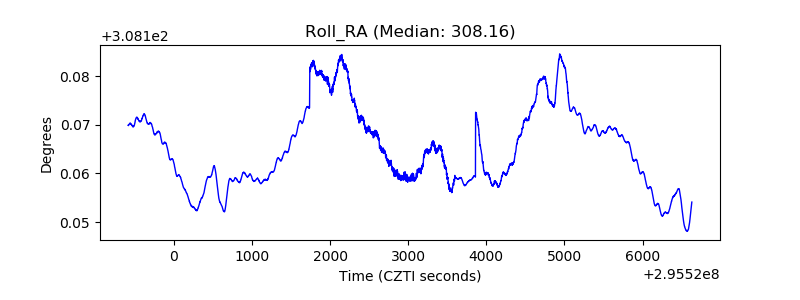 |
| Veto Counter | 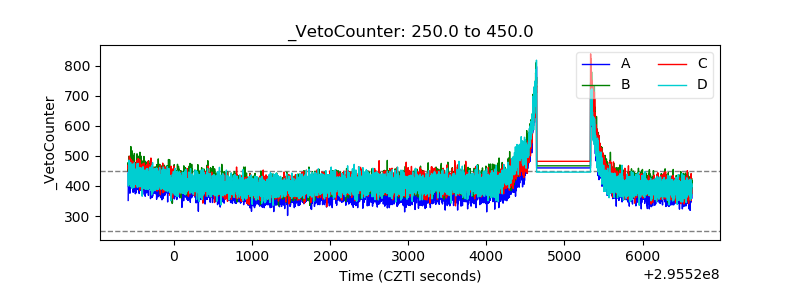 |