| Param | Original file | Final file |
|---|---|---|
| Filename | modeM0/AS1T03_115T01_9000002914_19602cztM0_level2.evt | modeM0/AS1T03_115T01_9000002914_19602cztM0_level2_quad_clean.evt |
| Size (bytes) | 542,151,360 | 101,609,280 |
| Size | 517.0 MB | 96.9 MB |
| Events in quadrant A | 3,889,897 | 627,439 |
| Events in quadrant B | 3,869,918 | 669,088 |
| Events in quadrant C | 3,802,778 | 640,192 |
| Events in quadrant D | 4,345,011 | 615,802 |
| Mode M9 | |||
|---|---|---|---|
| Quadrant | BADHDUFLAG | Total packets | Discarded packets |
| A | 0 | 2 | 0 |
| B | 0 | 2 | 0 |
| C | 0 | 2 | 0 |
| D | 0 | 2 | 0 |
| Mode SS | |||
|---|---|---|---|
| Quadrant | BADHDUFLAG | Total packets | Discarded packets |
| A | 0 | 154 | 0 |
| B | 0 | 154 | 0 |
| C | 0 | 154 | 0 |
| D | 0 | 154 | 0 |
| Mode M0 | |||
|---|---|---|---|
| Quadrant | BADHDUFLAG | Total packets | Discarded packets |
| A | 0 | 16496 | 2 |
| B | 0 | 16362 | 2 |
| C | 0 | 16260 | 2 |
| D | 0 | 18192 | 2 |
| Quadrant | Total seconds | Saturated seconds | Saturation percentage |
|---|---|---|---|
| A | 7532 | 205 | 2.721721% |
| B | 7532 | 214 | 2.841211% |
| C | 7532 | 221 | 2.934148% |
| D | 7531 | 214 | 2.841588% |
Noise dominated data is calculated using 1-second bins in cleaned event files. If a bin has >2000 counts, and if more than 50% of those come from <1% of pixels, then it is considered to be noise-dominated and hence unusable.
| Quadrant | # 1 sec bins | Bins with >0 counts | Bins with >2000 counts | High rate bins dominated by noise | Noise dominated (total time) | Noise dominated (detector-on time) | Marked lightcurve |
|---|---|---|---|---|---|---|---|
| A | 7772 | 7532 | 1 | 1 | 0.01% | 0.01% | 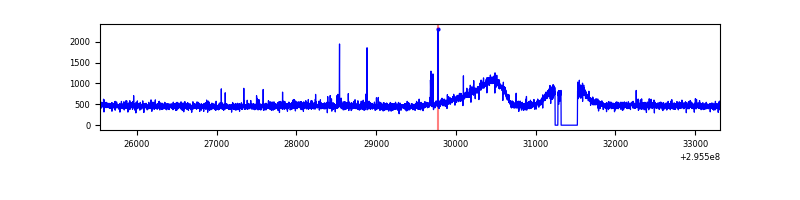 |
| B | 7772 | 7533 | 3 | 3 | 0.04% | 0.04% | 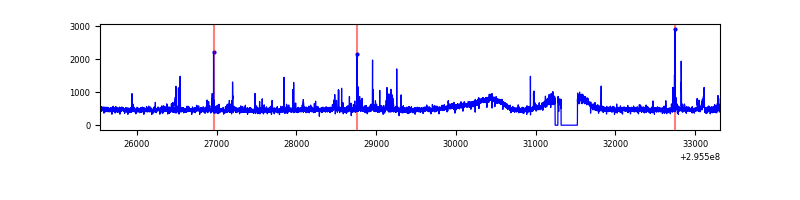 |
| C | 7772 | 7533 | 3 | 3 | 0.04% | 0.04% | 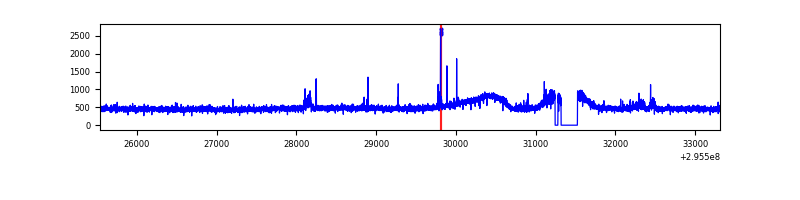 |
| D | 7771 | 7532 | 65 | 65 | 0.84% | 0.86% | 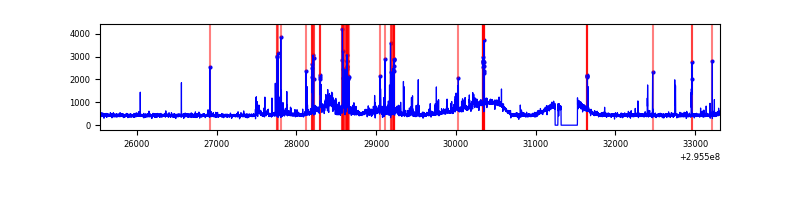 |
Top three noisy pixels from each quadrant. If the there are fewer than three noisy pixels in the level2.evt file, extra rows are filled as -1
| Pixel properties | Quadrant properties | ||||||
|---|---|---|---|---|---|---|---|
| Quadrant | DetID | PixID | Counts | Sigma | Mean | Median | Sigma |
| A | 11 | 29 | 31166 | 145.32 | 994 | 977 | 207.7 |
| A | 5 | 16 | 17396 | 79.03 | 994 | 977 | 207.7 |
| A | 9 | 143 | 13840 | 61.92 | 994 | 977 | 207.7 |
| B | 4 | 216 | 29951 | 156.42 | 950 | 927 | 185.5 |
| B | 7 | 220 | 28237 | 147.19 | 950 | 927 | 185.5 |
| B | 12 | 111 | 21382 | 110.24 | 950 | 927 | 185.5 |
| C | 14 | 238 | 139520 | 633.1 | 913 | 919 | 218.9 |
| C | 3 | 233 | 71004 | 320.13 | 913 | 919 | 218.9 |
| C | 5 | 112 | 31624 | 140.25 | 913 | 919 | 218.9 |
| D | 1 | 52 | 476622 | 1962.82 | 960 | 934 | 242.3 |
| D | 13 | 104 | 88395 | 360.89 | 960 | 934 | 242.3 |
| D | 12 | 225 | 48295 | 195.42 | 960 | 934 | 242.3 |
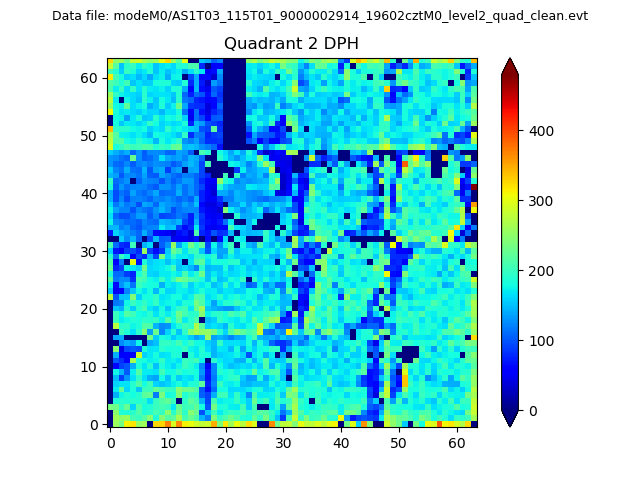
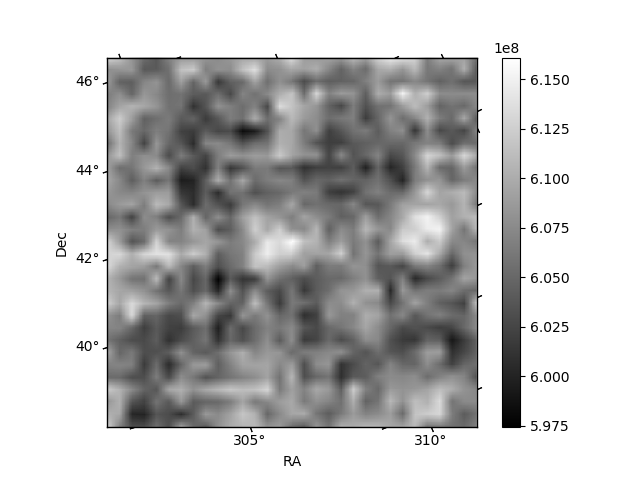
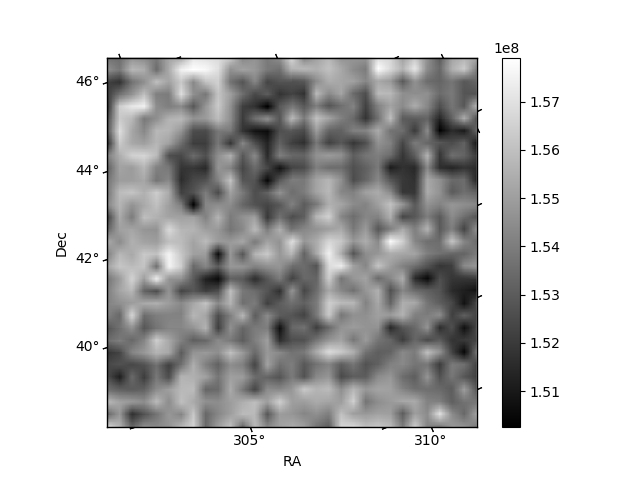
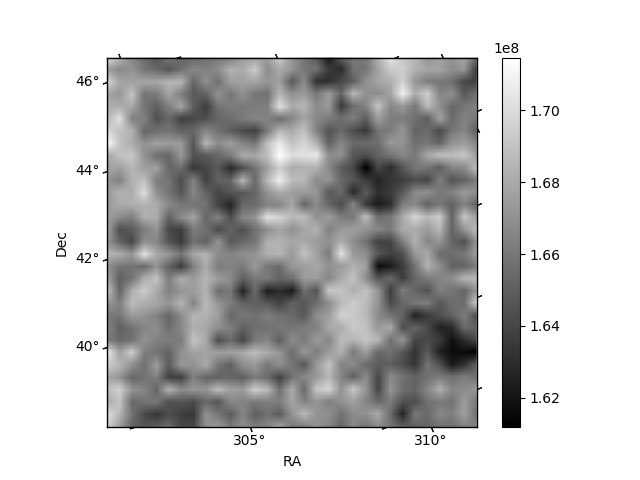
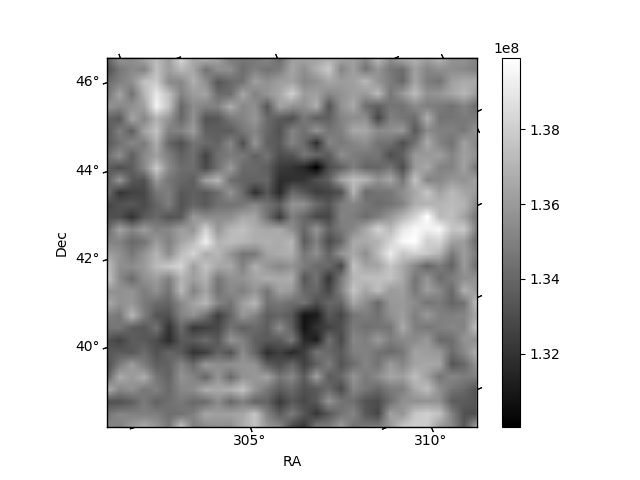
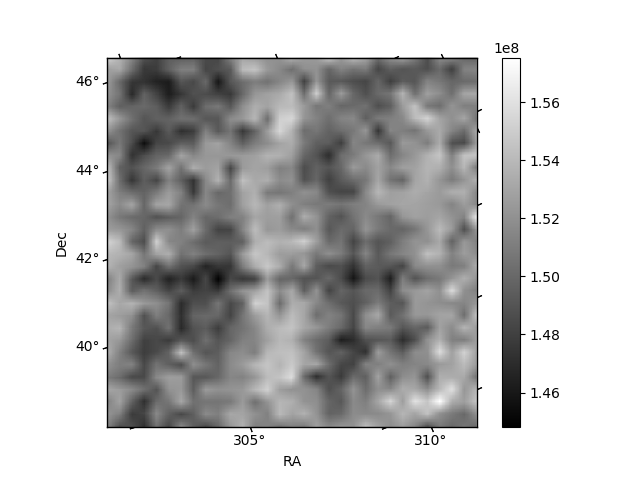
Histogram calculated using DETX and DETY for each event in the final _common_clean file
| Quadrant A | 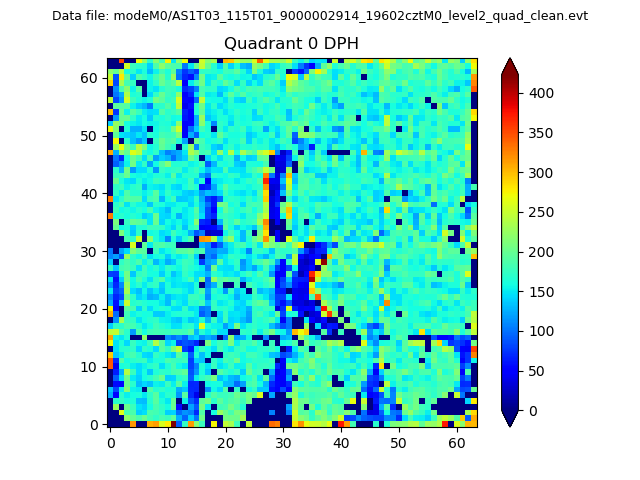 |
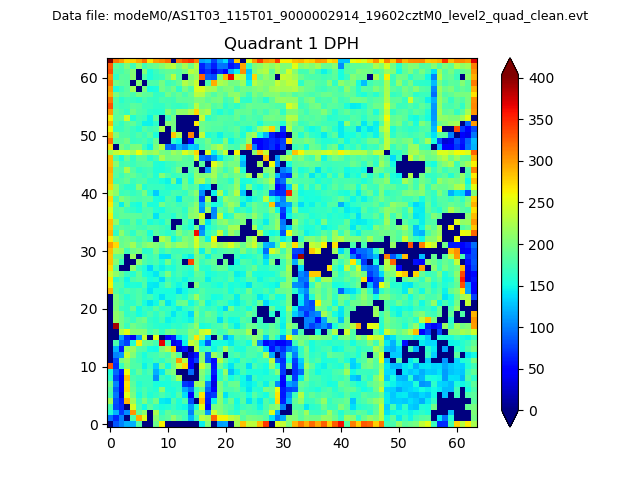 |
Quadrant B |
|---|---|---|---|
| Quadrant D | 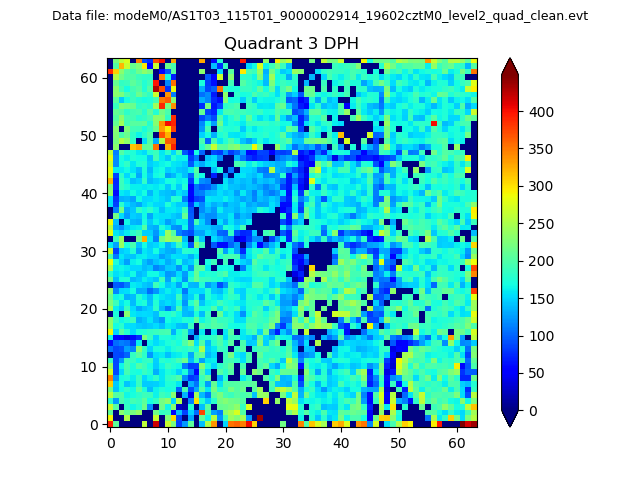 |
 |
Quadrant C |
| Plot type | Count rate plots | Images |
|---|---|---|
| Comparison with Poisson distribution Blue bars denote a histogram of data divided into 1 sec bins. Red curve is a Poisson curve with rate = median count rate of data. |
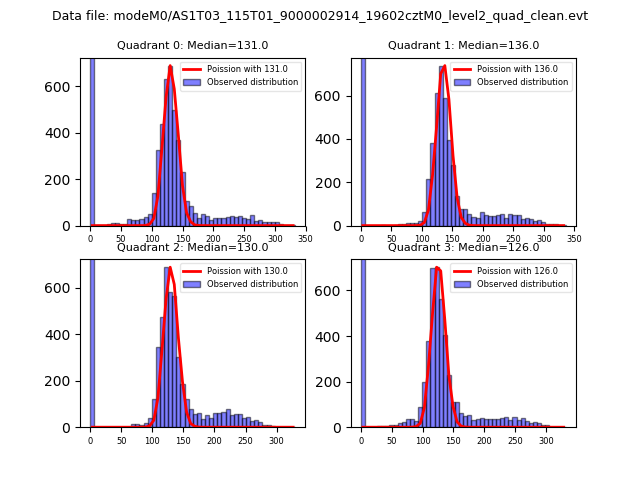 |
 |
| Quadrant-wise count rates Data is divided into 100 sec bins |
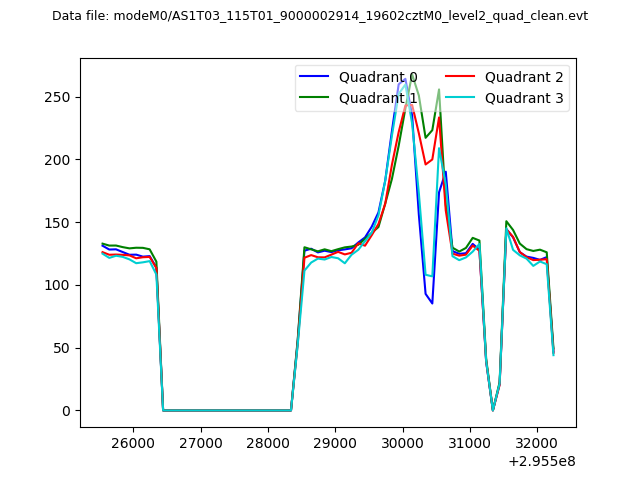 |
|
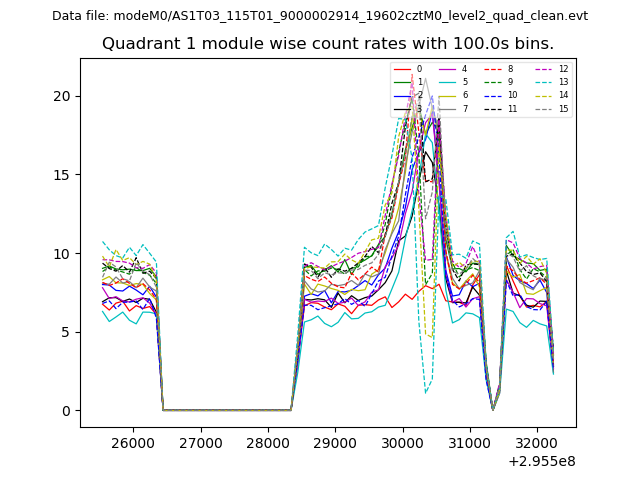
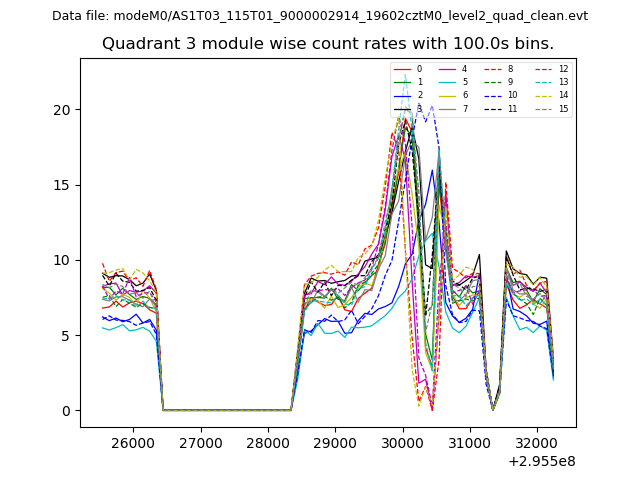
| Module-wise count rates for Quadrant A Data is divided into 100 sec bins |
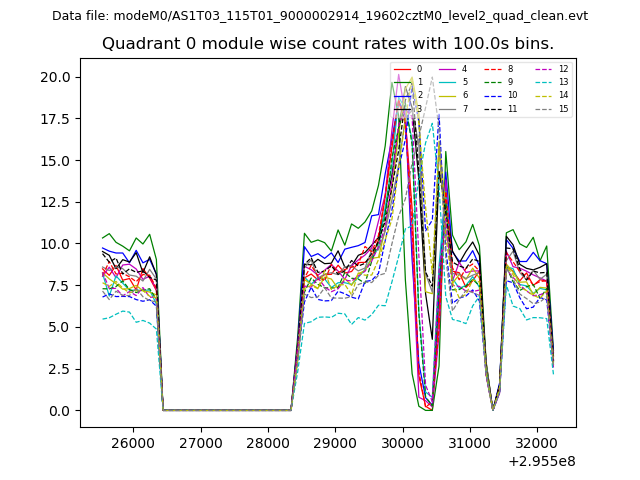 |
 |
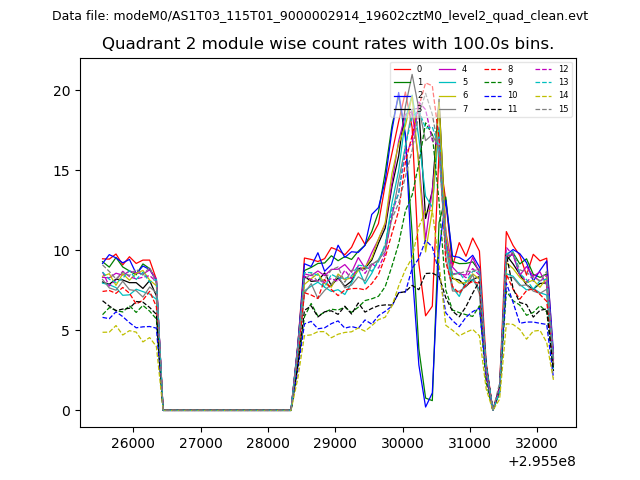
| Module-wise count rates for Quadrant B Data is divided into 100 sec bins |
 |
 |
| Module-wise count rates for Quadrant C Data is divided into 100 sec bins |
 |
 |
| Module-wise count rates for Quadrant D Data is divided into 100 sec bins |
 |
 |
| Parameter | Plot |
|---|---|
| CZT HV Monitor | 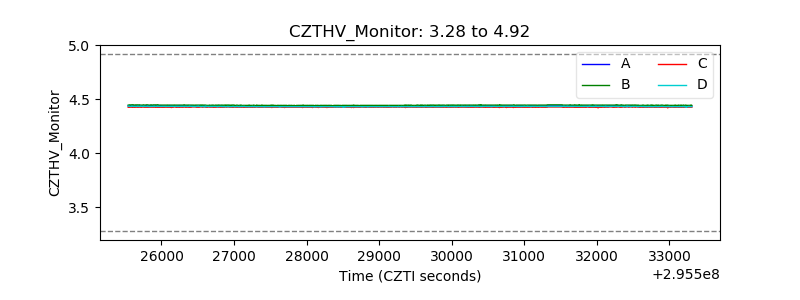 |
| D_VDD |  |
| Temperature 1 | 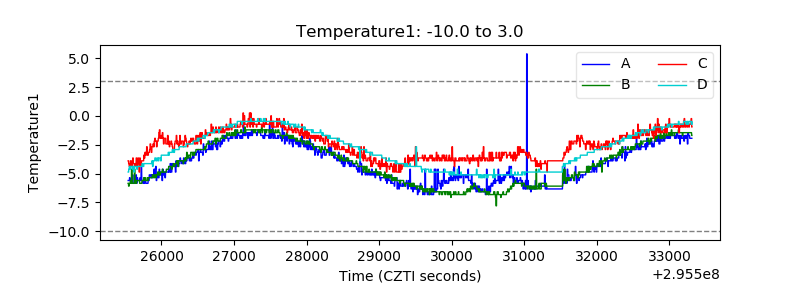 |
| Veto HV Monitor | 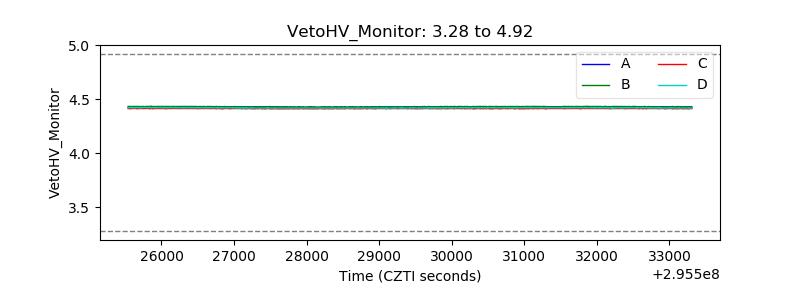 |
| Veto LLD | 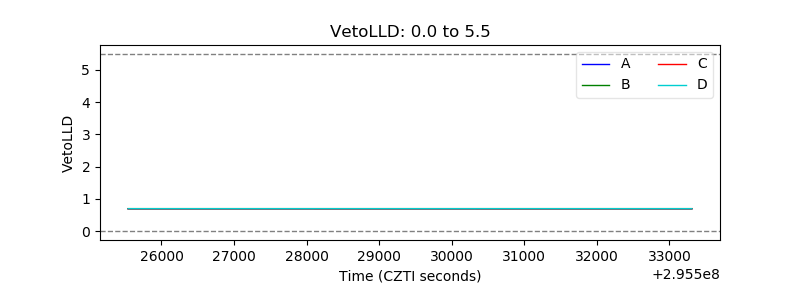 |
| Alpha Counter | 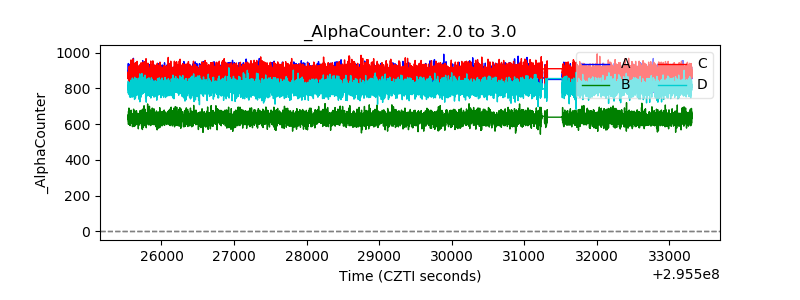 |
| _CPM_Rate | 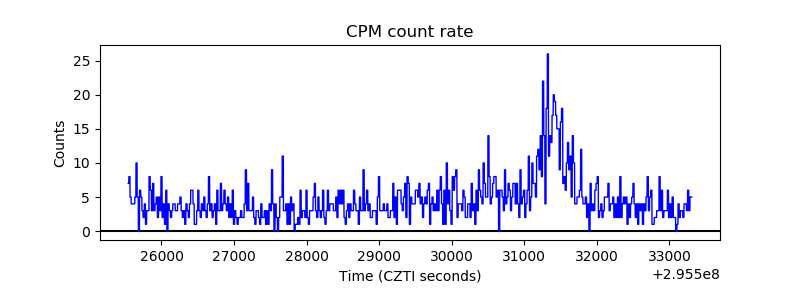 |
| CZT Counter | 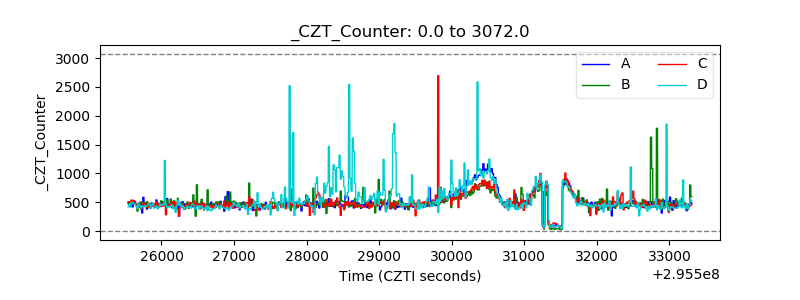 |
| +2.5 Volts monitor |  |
| +5 Volts monitor |  |
| _ROLL_ROT | 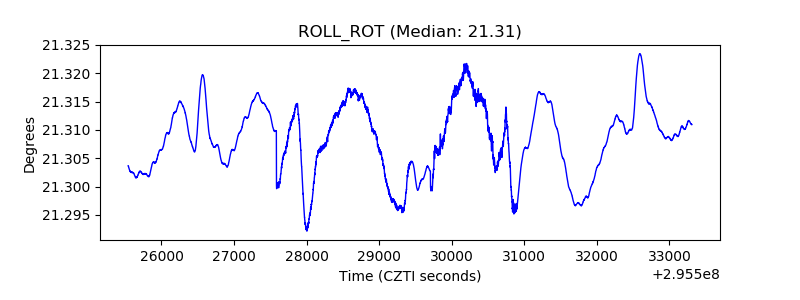 |
| _Roll_DEC | 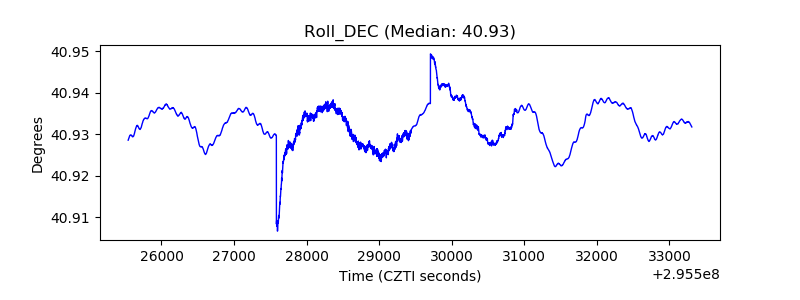 |
| _Roll_RA | 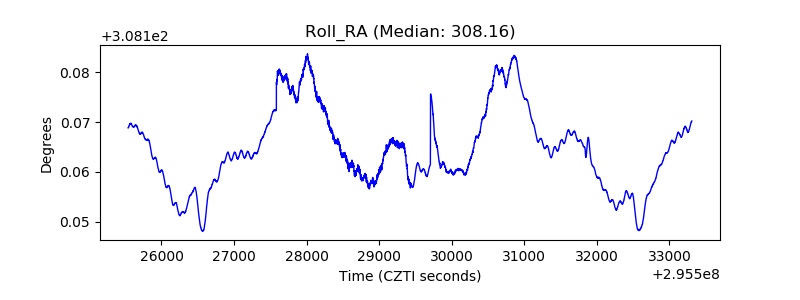 |
| Veto Counter | 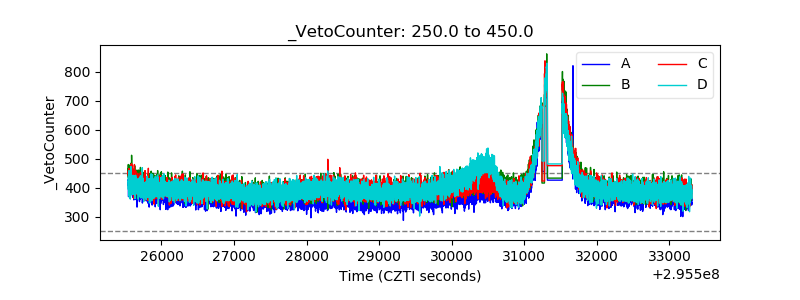 |