| Param | Original file | Final file |
|---|---|---|
| Filename | modeM0/AS1T03_115T01_9000002914_19606cztM0_level2.evt | modeM0/AS1T03_115T01_9000002914_19606cztM0_level2_quad_clean.evt |
| Size (bytes) | 934,764,480 | 168,379,200 |
| Size | 891.5 MB | 160.6 MB |
| Events in quadrant A | 6,338,823 | 1,066,735 |
| Events in quadrant B | 6,590,788 | 1,069,267 |
| Events in quadrant C | 6,715,838 | 1,029,393 |
| Events in quadrant D | 7,762,488 | 1,014,055 |
| Mode M9 | |||
|---|---|---|---|
| Quadrant | BADHDUFLAG | Total packets | Discarded packets |
| A | 0 | 16 | 0 |
| B | 0 | 16 | 0 |
| C | 0 | 16 | 0 |
| D | 0 | 16 | 0 |
| Mode SS | |||
|---|---|---|---|
| Quadrant | BADHDUFLAG | Total packets | Discarded packets |
| A | 0 | 272 | 0 |
| B | 0 | 272 | 0 |
| C | 0 | 272 | 0 |
| D | 0 | 272 | 0 |
| Mode M0 | |||
|---|---|---|---|
| Quadrant | BADHDUFLAG | Total packets | Discarded packets |
| A | 0 | 27611 | 3 |
| B | 0 | 28282 | 3 |
| C | 0 | 28201 | 3 |
| D | 0 | 32343 | 4 |
| Quadrant | Total seconds | Saturated seconds | Saturation percentage |
|---|---|---|---|
| A | 13320 | 154 | 1.156156% |
| B | 13321 | 212 | 1.591472% |
| C | 13321 | 267 | 2.004354% |
| D | 13320 | 331 | 2.484985% |
Noise dominated data is calculated using 1-second bins in cleaned event files. If a bin has >2000 counts, and if more than 50% of those come from <1% of pixels, then it is considered to be noise-dominated and hence unusable.
| Quadrant | # 1 sec bins | Bins with >0 counts | Bins with >2000 counts | High rate bins dominated by noise | Noise dominated (total time) | Noise dominated (detector-on time) | Marked lightcurve |
|---|---|---|---|---|---|---|---|
| A | 14930 | 13321 | 6 | 6 | 0.04% | 0.05% | 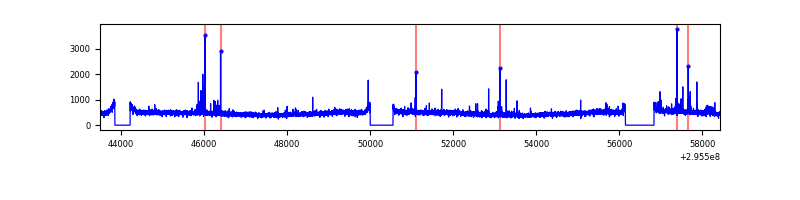 |
| B | 14931 | 13321 | 36 | 36 | 0.24% | 0.27% | 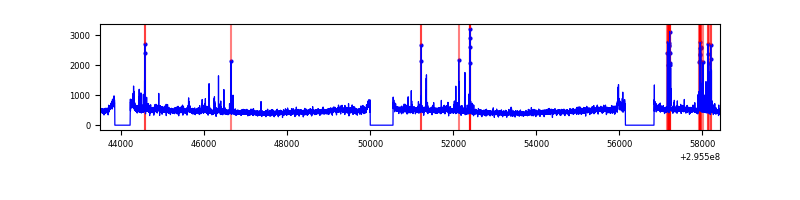 |
| C | 14931 | 13322 | 0 | 0 | 0.00% | 0.00% | 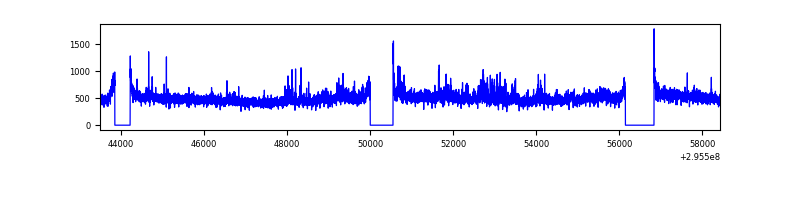 |
| D | 14930 | 13320 | 204 | 204 | 1.37% | 1.53% | 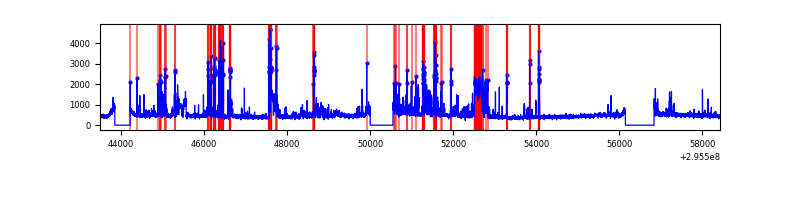 |
Top three noisy pixels from each quadrant. If the there are fewer than three noisy pixels in the level2.evt file, extra rows are filled as -1
| Pixel properties | Quadrant properties | ||||||
|---|---|---|---|---|---|---|---|
| Quadrant | DetID | PixID | Counts | Sigma | Mean | Median | Sigma |
| A | 9 | 143 | 85358 | 258.43 | 1600 | 1563 | 324.3 |
| A | 5 | 16 | 56608 | 169.76 | 1600 | 1563 | 324.3 |
| A | 11 | 29 | 26492 | 76.88 | 1600 | 1563 | 324.3 |
| B | 7 | 220 | 130731 | 424.65 | 1591 | 1550 | 304.2 |
| B | 4 | 216 | 113899 | 369.32 | 1591 | 1550 | 304.2 |
| B | 0 | 197 | 43838 | 139.01 | 1591 | 1550 | 304.2 |
| C | 3 | 233 | 512779 | 1430.38 | 1527 | 1534 | 357.4 |
| C | 14 | 238 | 237207 | 659.38 | 1527 | 1534 | 357.4 |
| C | 13 | 61 | 10786 | 25.89 | 1527 | 1534 | 357.4 |
| D | 1 | 52 | 1744584 | 4611.58 | 1547 | 1500 | 378.0 |
| D | 7 | 238 | 61819 | 159.58 | 1547 | 1500 | 378.0 |
| D | 2 | 234 | 55769 | 143.58 | 1547 | 1500 | 378.0 |
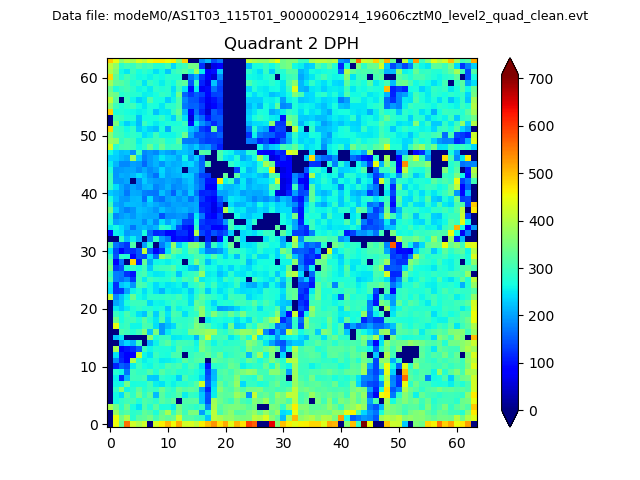
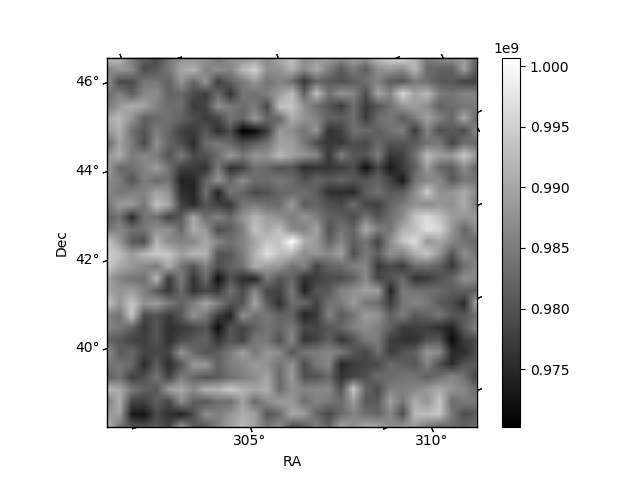
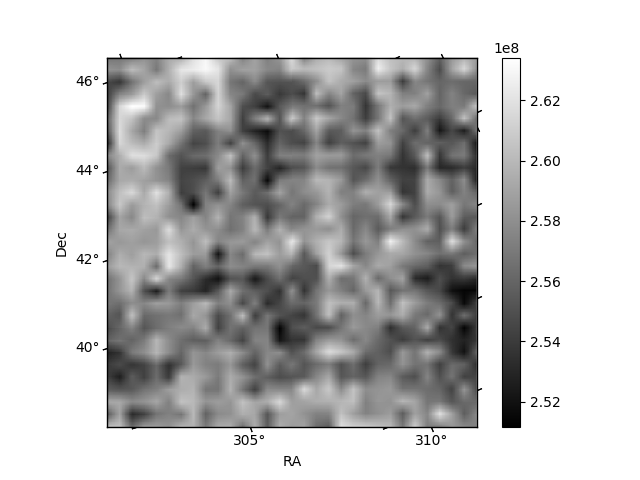
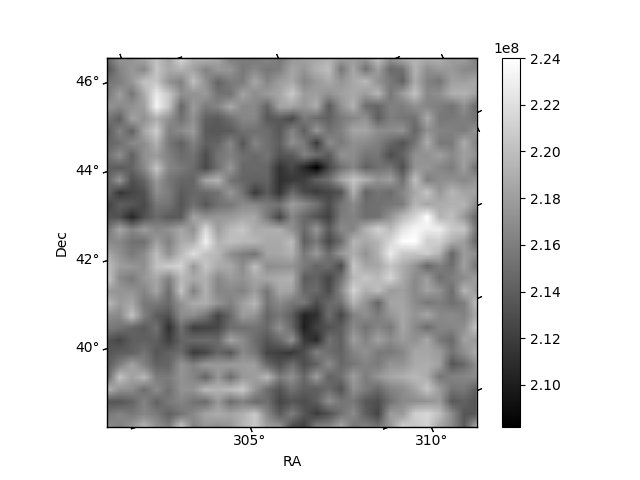
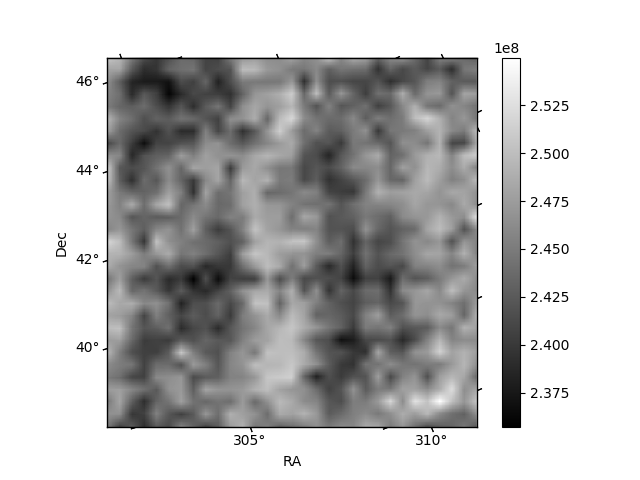
Histogram calculated using DETX and DETY for each event in the final _common_clean file
| Quadrant A | 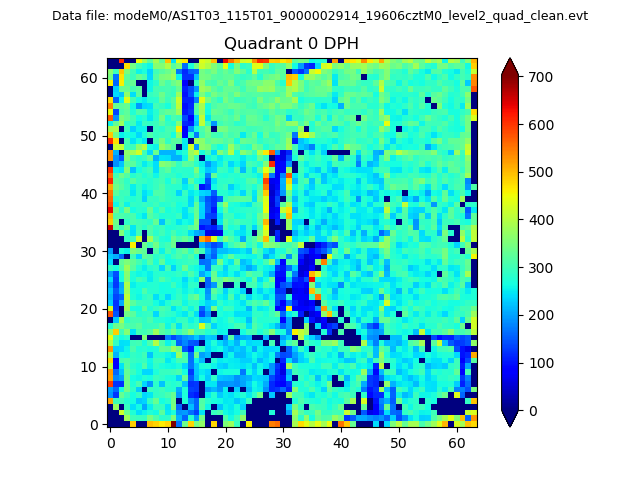 |
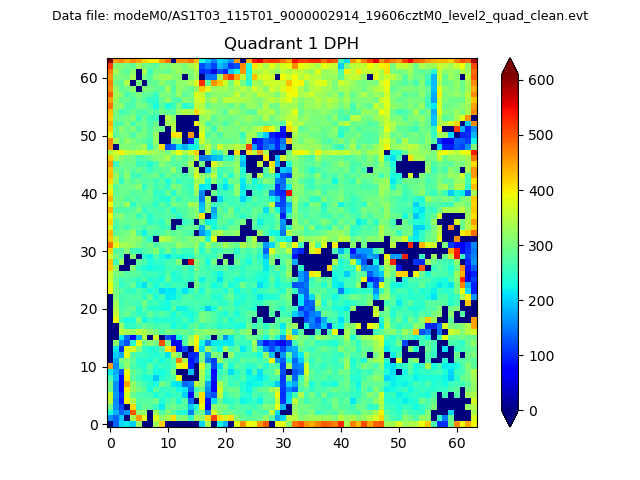 |
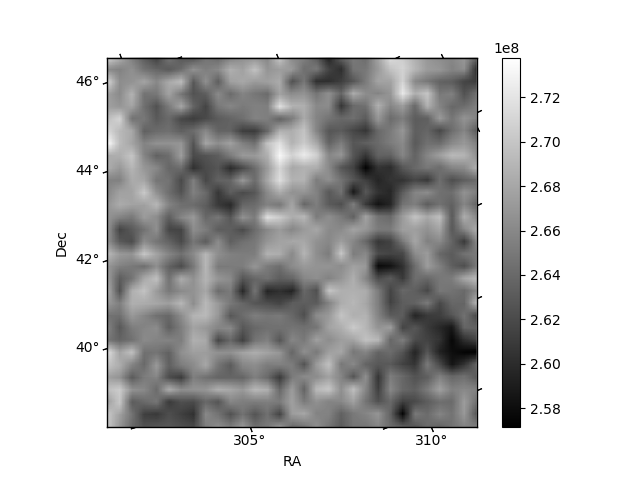
Quadrant B |
|---|---|---|---|
| Quadrant D | 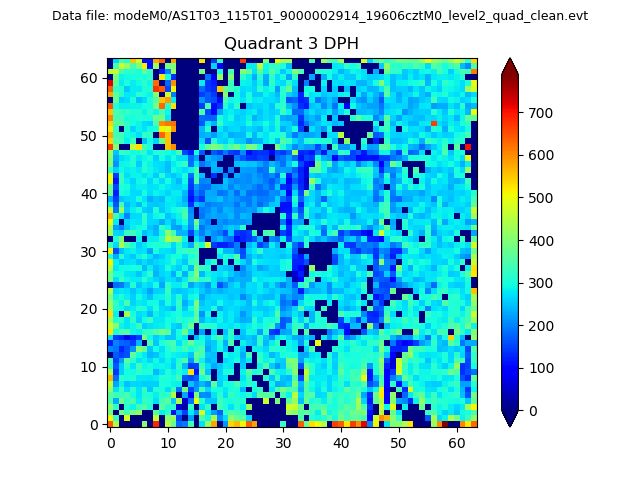 |
 |
Quadrant C |
| Plot type | Count rate plots | Images |
|---|---|---|
| Comparison with Poisson distribution Blue bars denote a histogram of data divided into 1 sec bins. Red curve is a Poisson curve with rate = median count rate of data. |
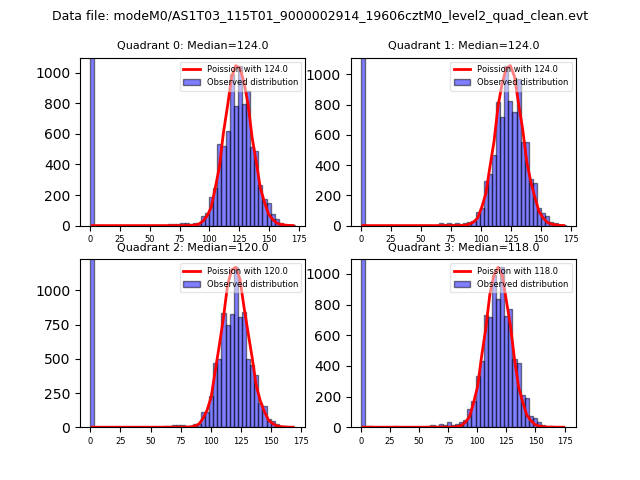 |
 |
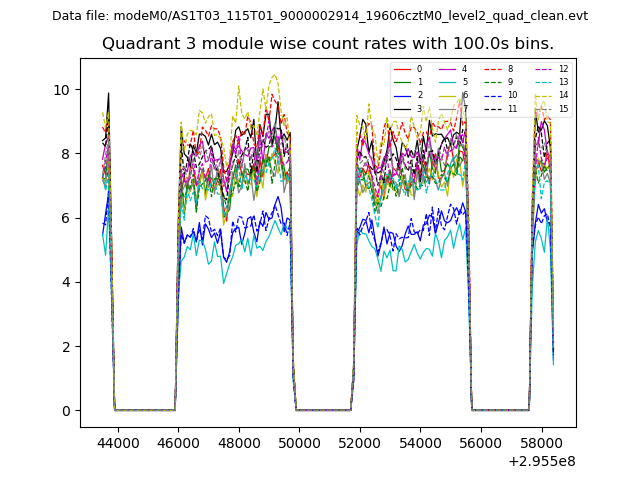
| Quadrant-wise count rates Data is divided into 100 sec bins |
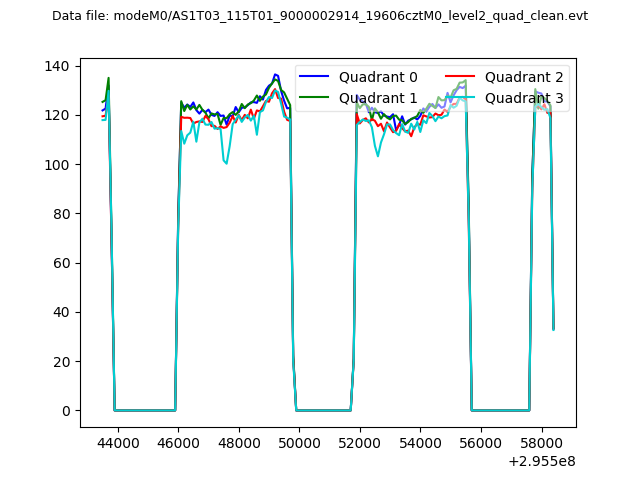 |
|
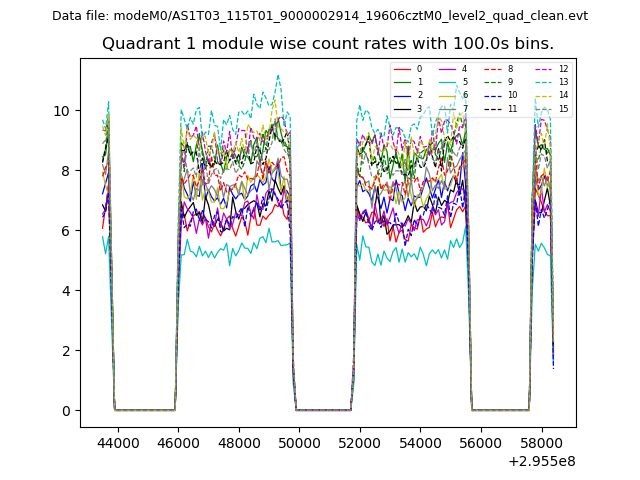
| Module-wise count rates for Quadrant A Data is divided into 100 sec bins |
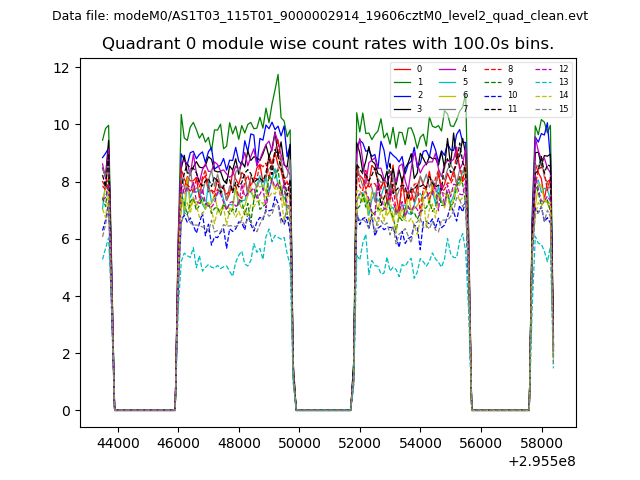 |
 |
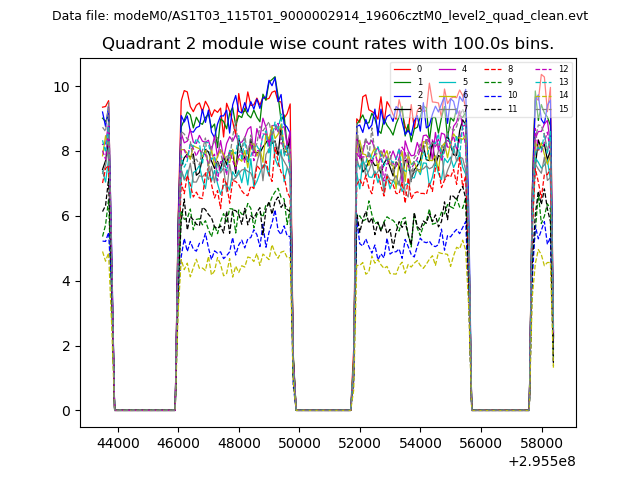
| Module-wise count rates for Quadrant B Data is divided into 100 sec bins |
 |
 |
| Module-wise count rates for Quadrant C Data is divided into 100 sec bins |
 |
 |
| Module-wise count rates for Quadrant D Data is divided into 100 sec bins |
 |
 |
| Parameter | Plot |
|---|---|
| CZT HV Monitor | 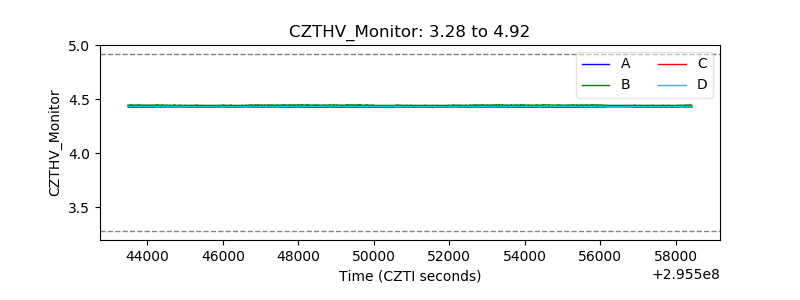 |
| D_VDD | 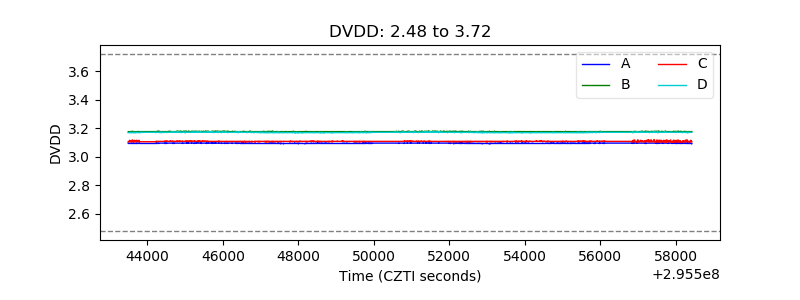 |
| Temperature 1 | 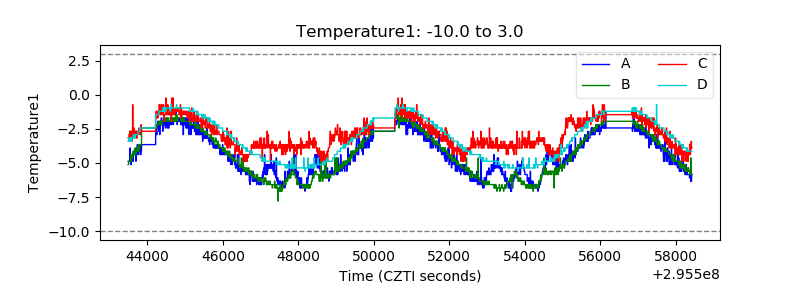 |
| Veto HV Monitor | 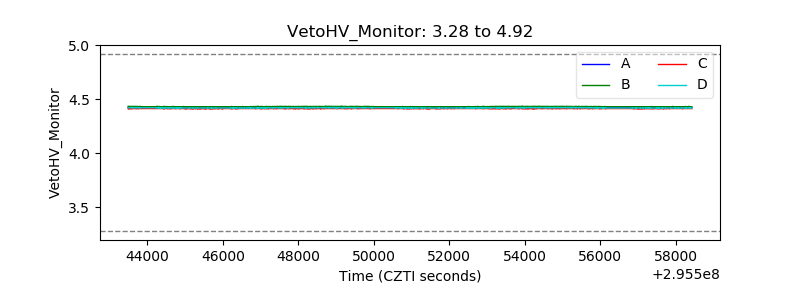 |
| Veto LLD | 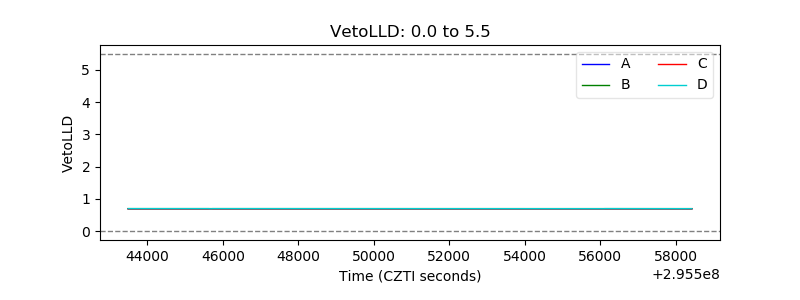 |
| Alpha Counter | 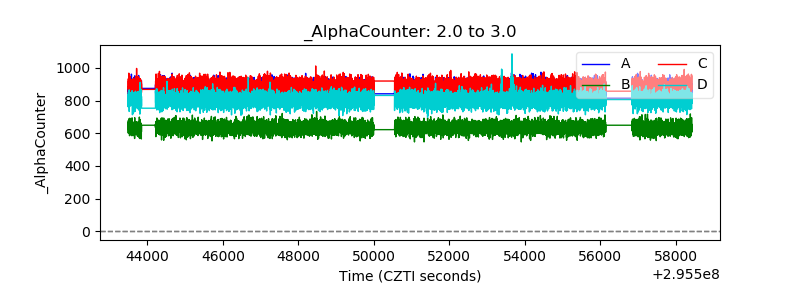 |
| _CPM_Rate | 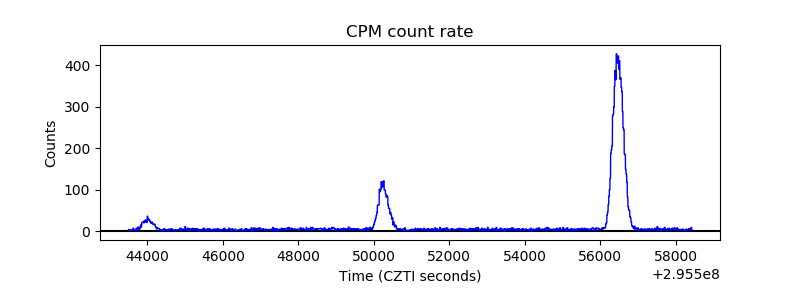 |
| CZT Counter | 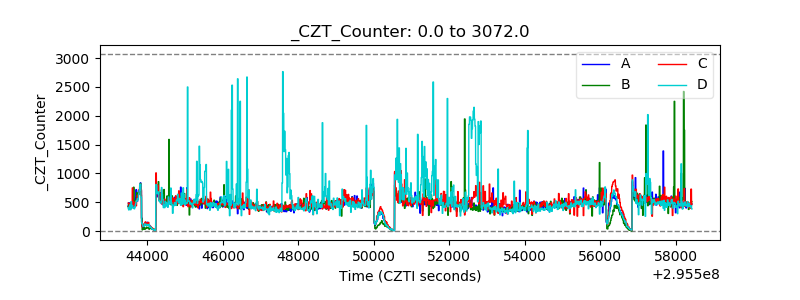 |
| +2.5 Volts monitor | 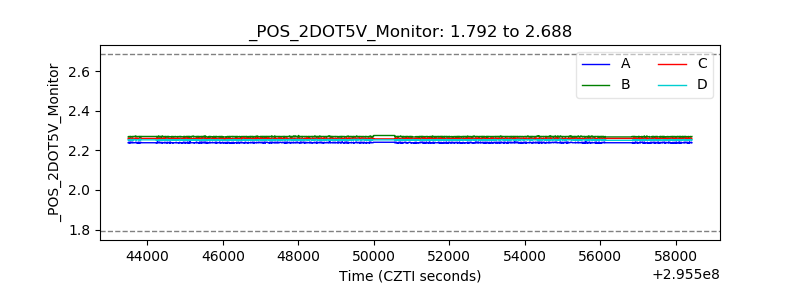 |
| +5 Volts monitor | 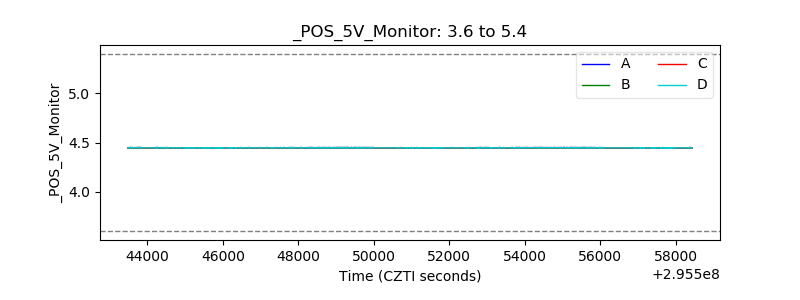 |
| _ROLL_ROT | 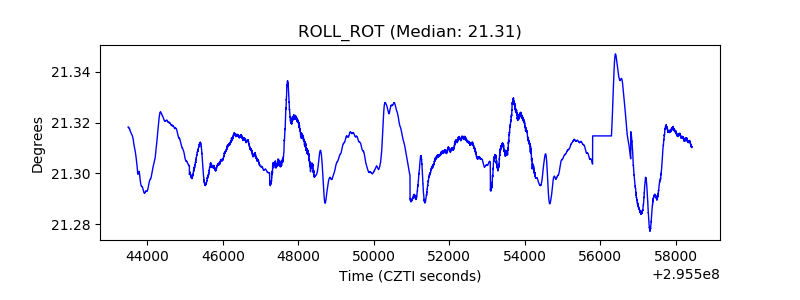 |
| _Roll_DEC | 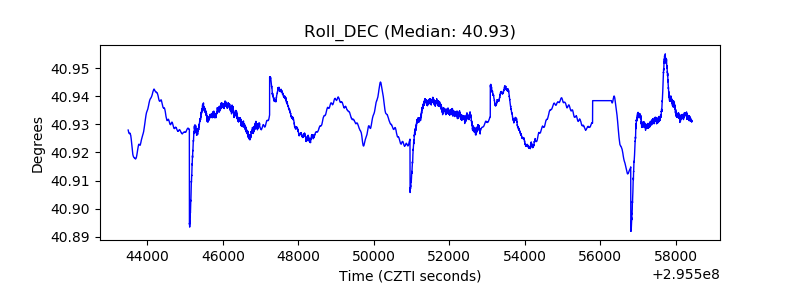 |
| _Roll_RA | 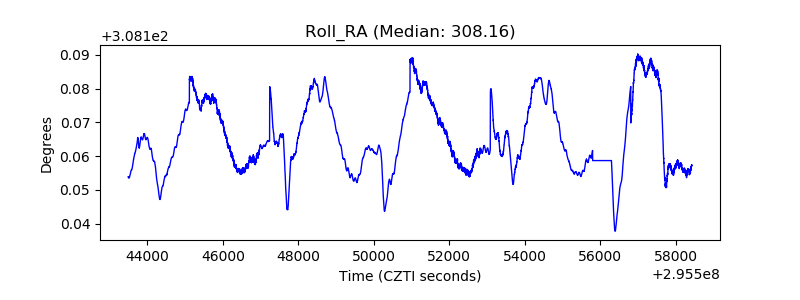 |
| Veto Counter | 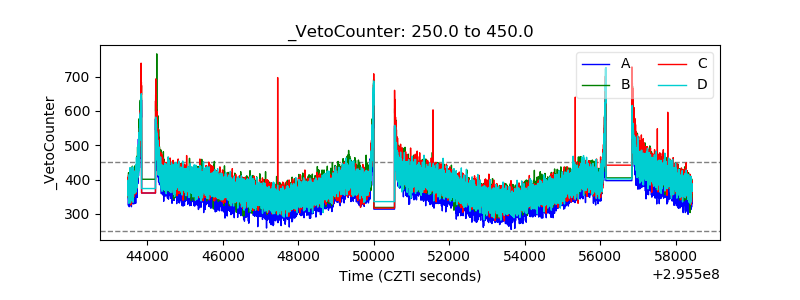 |