| Param | Original file | Final file |
|---|---|---|
| Filename | modeM0/AS1T03_115T01_9000002914_19607cztM0_level2.evt | modeM0/AS1T03_115T01_9000002914_19607cztM0_level2_quad_clean.evt |
| Size (bytes) | 1,957,014,720 | 396,478,080 |
| Size | 1.8 GB | 378.1 MB |
| Events in quadrant A | 13,745,675 | 2,577,560 |
| Events in quadrant B | 14,309,870 | 2,532,374 |
| Events in quadrant C | 14,141,080 | 2,448,450 |
| Events in quadrant D | 15,119,772 | 2,464,730 |
| Mode M9 | |||
|---|---|---|---|
| Quadrant | BADHDUFLAG | Total packets | Discarded packets |
| A | 0 | 26 | 0 |
| B | 0 | 26 | 0 |
| C | 0 | 26 | 0 |
| D | 0 | 26 | 0 |
| Mode SS | |||
|---|---|---|---|
| Quadrant | BADHDUFLAG | Total packets | Discarded packets |
| A | 0 | 588 | 0 |
| B | 0 | 588 | 0 |
| C | 0 | 588 | 0 |
| D | 0 | 588 | 0 |
| Mode M0 | |||
|---|---|---|---|
| Quadrant | BADHDUFLAG | Total packets | Discarded packets |
| A | 0 | 60011 | 5 |
| B | 0 | 61444 | 5 |
| C | 0 | 60279 | 5 |
| D | 0 | 65243 | 5 |
| Quadrant | Total seconds | Saturated seconds | Saturation percentage |
|---|---|---|---|
| A | 28885 | 407 | 1.409036% |
| B | 28886 | 577 | 1.997507% |
| C | 28886 | 593 | 2.052898% |
| D | 28886 | 553 | 1.914422% |
Noise dominated data is calculated using 1-second bins in cleaned event files. If a bin has >2000 counts, and if more than 50% of those come from <1% of pixels, then it is considered to be noise-dominated and hence unusable.
| Quadrant | # 1 sec bins | Bins with >0 counts | Bins with >2000 counts | High rate bins dominated by noise | Noise dominated (total time) | Noise dominated (detector-on time) | Marked lightcurve |
|---|---|---|---|---|---|---|---|
| A | 31445 | 28888 | 13 | 13 | 0.04% | 0.05% | 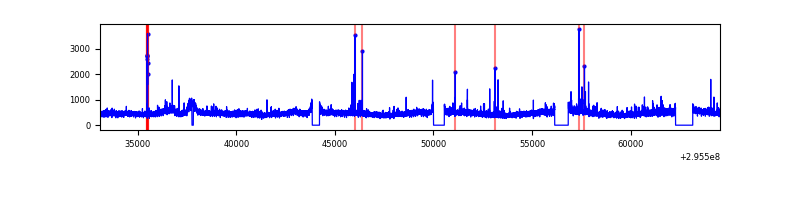 |
| B | 31446 | 28886 | 101 | 101 | 0.32% | 0.35% | 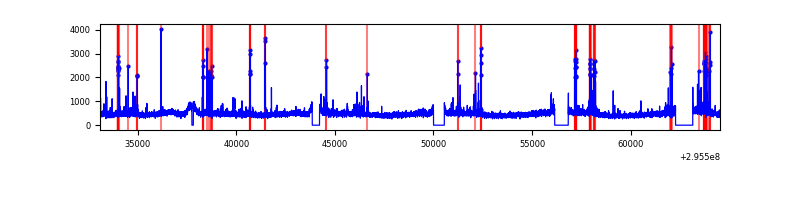 |
| C | 31446 | 28887 | 4 | 4 | 0.01% | 0.01% | 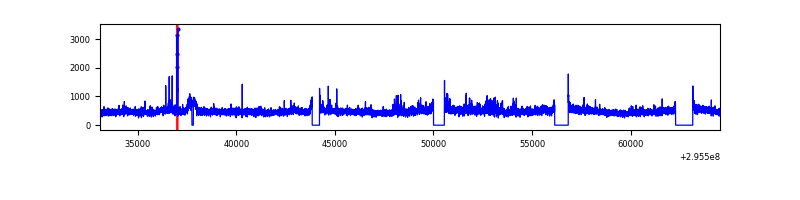 |
| D | 31446 | 28888 | 228 | 228 | 0.73% | 0.79% | 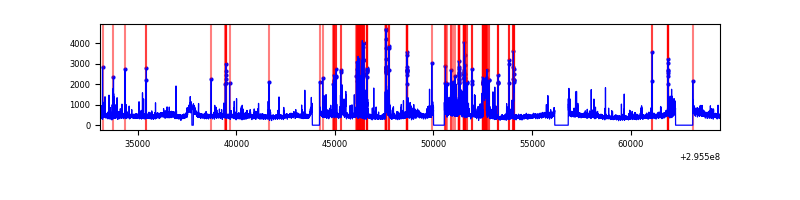 |
Top three noisy pixels from each quadrant. If the there are fewer than three noisy pixels in the level2.evt file, extra rows are filled as -1
| Pixel properties | Quadrant properties | ||||||
|---|---|---|---|---|---|---|---|
| Quadrant | DetID | PixID | Counts | Sigma | Mean | Median | Sigma |
| A | 9 | 143 | 166135 | 232.02 | 3486 | 3412 | 701.3 |
| A | 5 | 16 | 83292 | 113.9 | 3486 | 3412 | 701.3 |
| A | 11 | 29 | 54007 | 72.14 | 3486 | 3412 | 701.3 |
| B | 7 | 220 | 325089 | 493.65 | 3446 | 3361 | 651.7 |
| B | 4 | 216 | 206224 | 311.27 | 3446 | 3361 | 651.7 |
| B | 0 | 197 | 89925 | 132.82 | 3446 | 3361 | 651.7 |
| C | 3 | 233 | 603385 | 772.47 | 3316 | 3333 | 776.8 |
| C | 14 | 238 | 512605 | 655.61 | 3316 | 3333 | 776.8 |
| C | 5 | 112 | 51260 | 61.7 | 3316 | 3333 | 776.8 |
| D | 1 | 52 | 1905156 | 2325.68 | 3378 | 3289 | 817.8 |
| D | 7 | 238 | 161153 | 193.04 | 3378 | 3289 | 817.8 |
| D | 2 | 234 | 123693 | 147.23 | 3378 | 3289 | 817.8 |
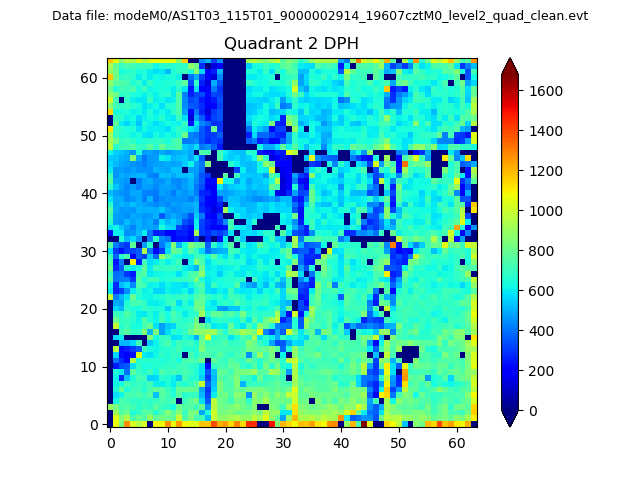
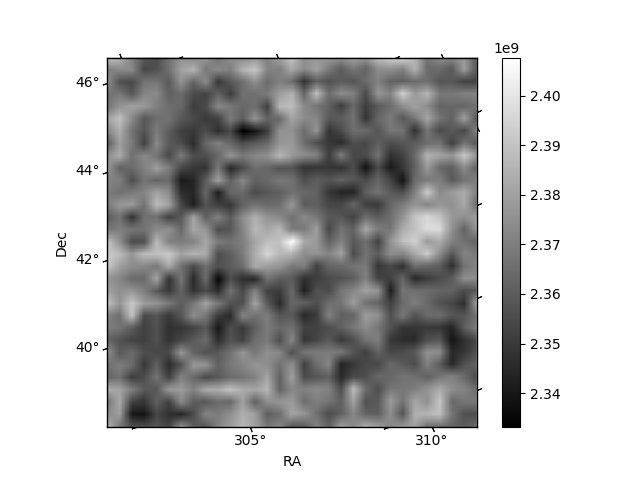
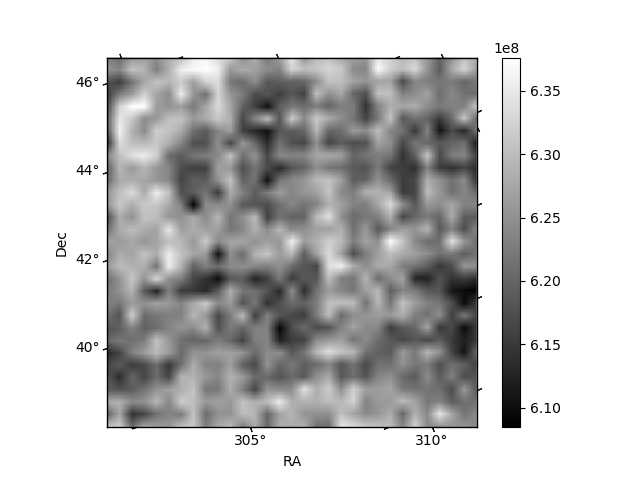
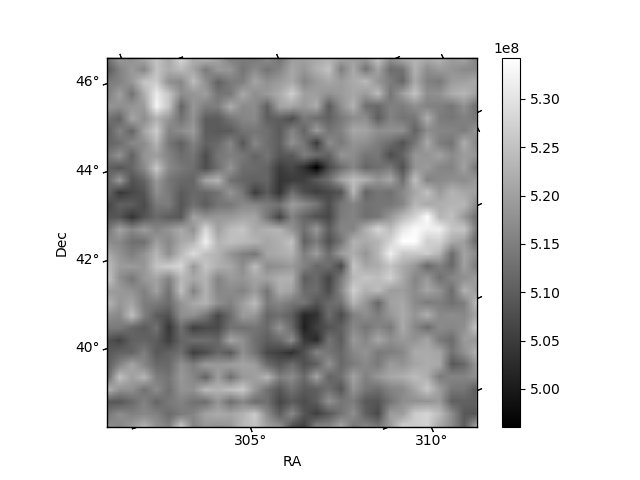
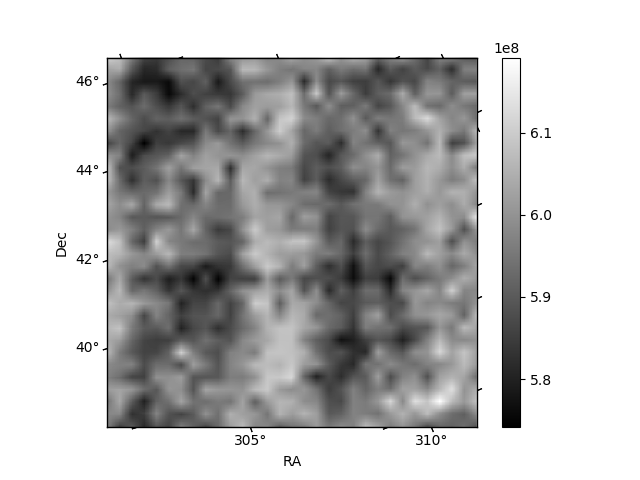
Histogram calculated using DETX and DETY for each event in the final _common_clean file
| Quadrant A | 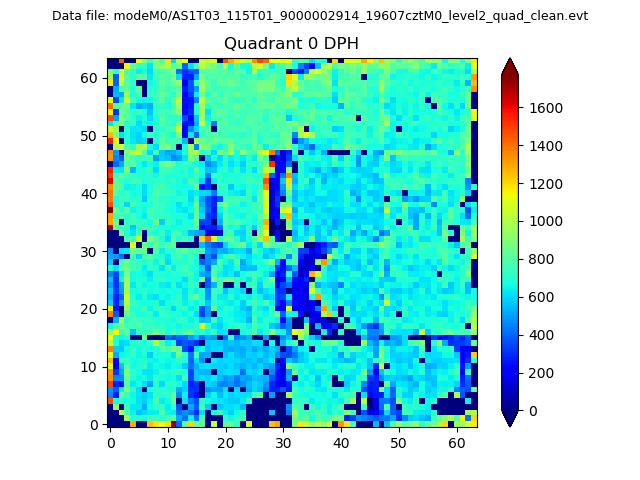 |
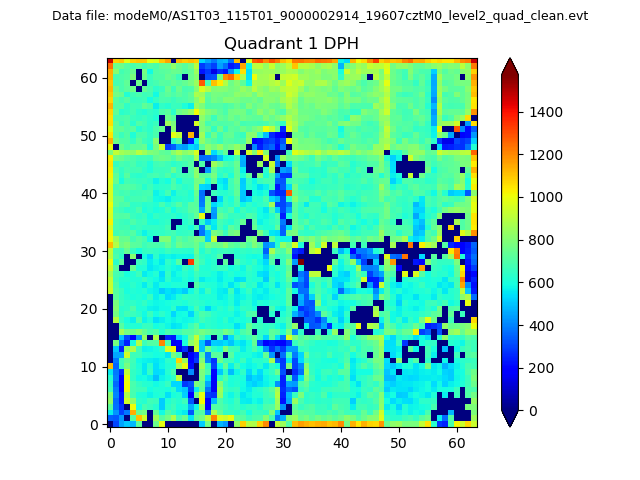 |
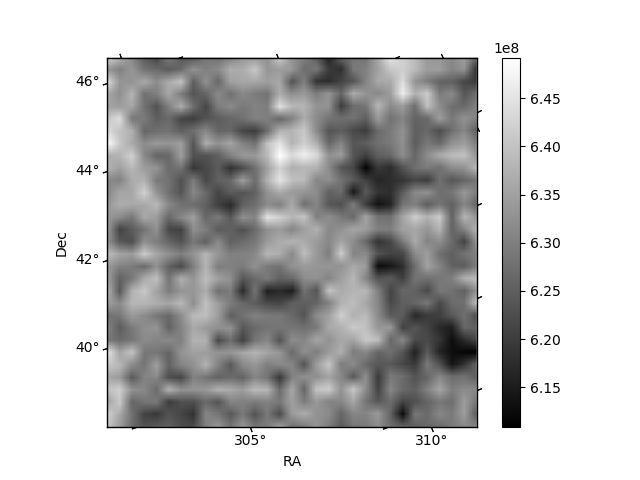
Quadrant B |
|---|---|---|---|
| Quadrant D | 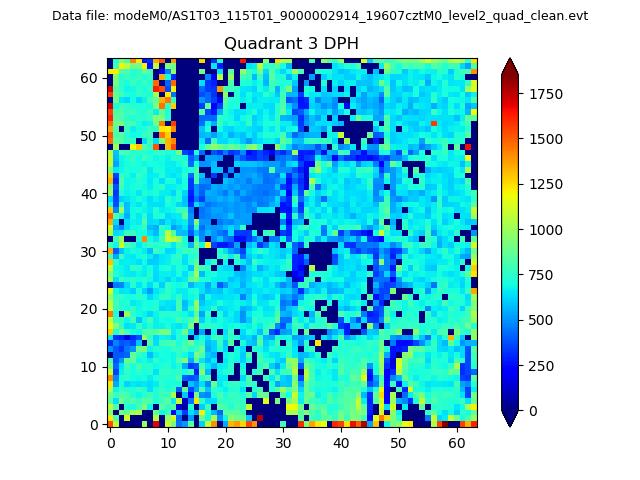 |
 |
Quadrant C |
| Plot type | Count rate plots | Images |
|---|---|---|
| Comparison with Poisson distribution Blue bars denote a histogram of data divided into 1 sec bins. Red curve is a Poisson curve with rate = median count rate of data. |
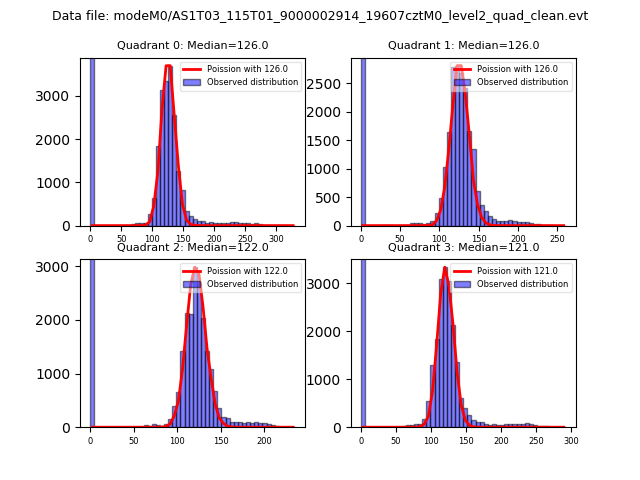 |
 |
| Quadrant-wise count rates Data is divided into 100 sec bins |
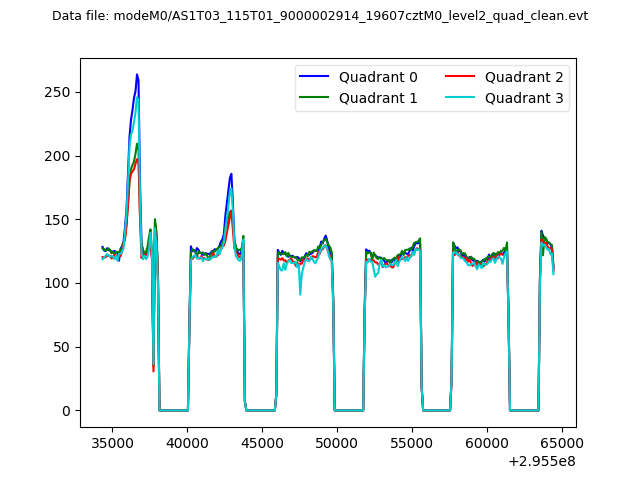 |
|
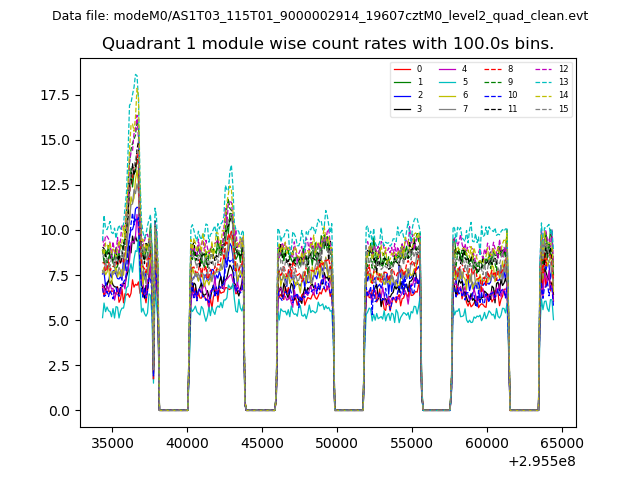
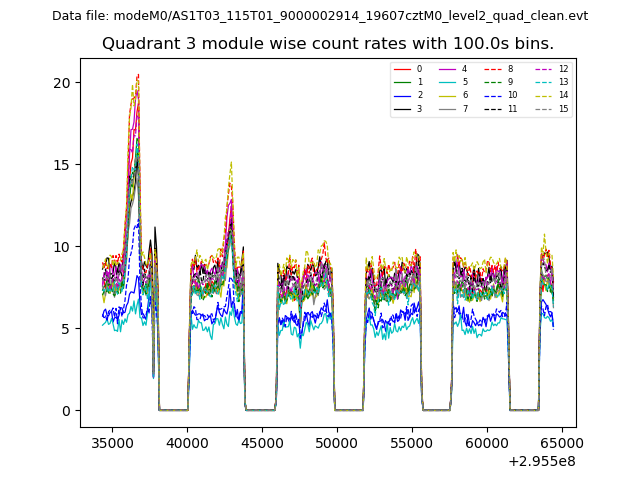
| Module-wise count rates for Quadrant A Data is divided into 100 sec bins |
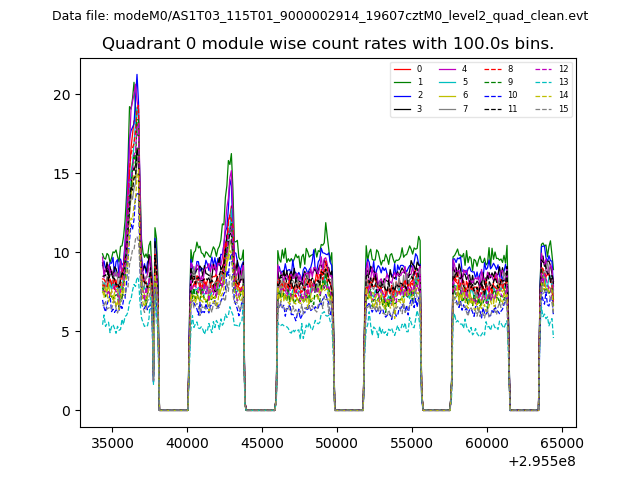 |
 |
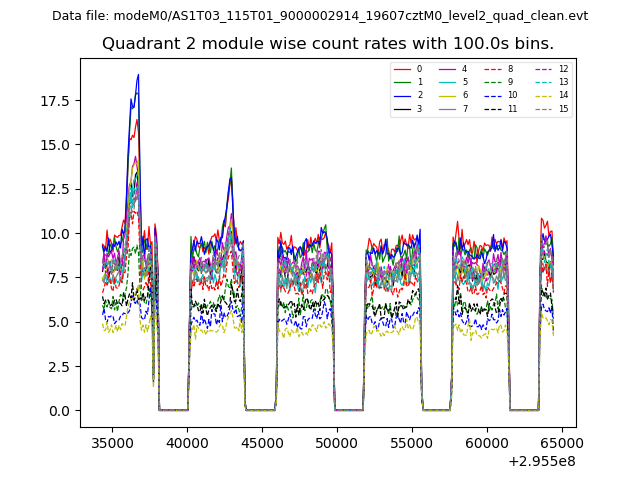
| Module-wise count rates for Quadrant B Data is divided into 100 sec bins |
 |
 |
| Module-wise count rates for Quadrant C Data is divided into 100 sec bins |
 |
 |
| Module-wise count rates for Quadrant D Data is divided into 100 sec bins |
 |
 |
| Parameter | Plot |
|---|---|
| CZT HV Monitor | 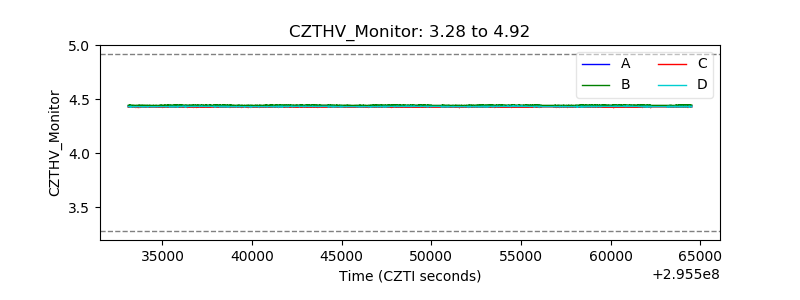 |
| D_VDD | 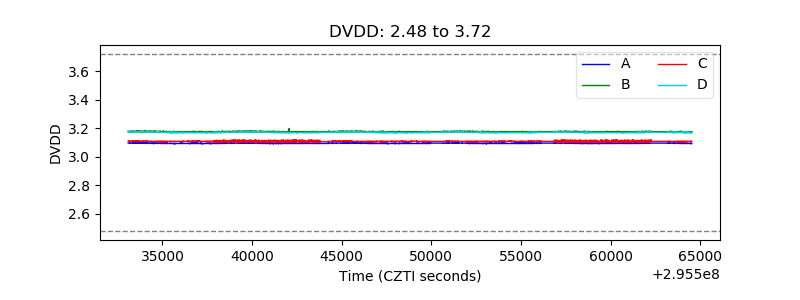 |
| Temperature 1 | 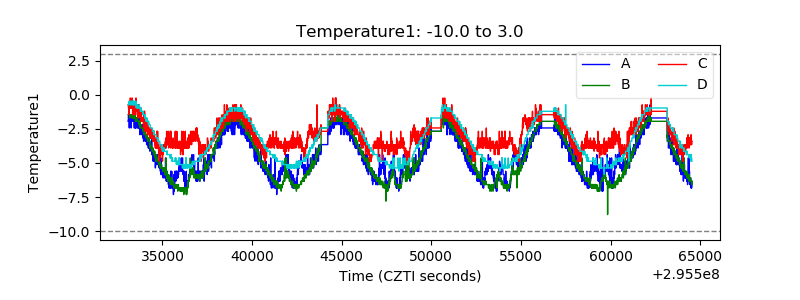 |
| Veto HV Monitor | 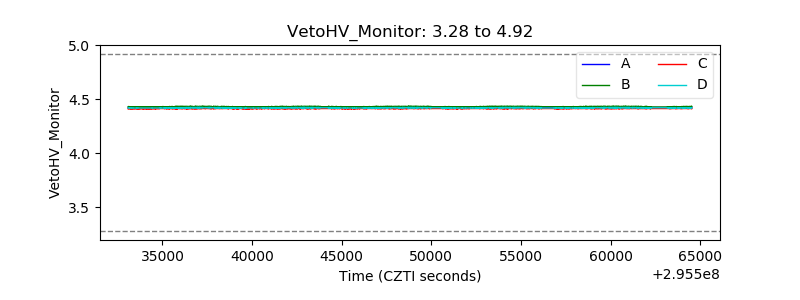 |
| Veto LLD |  |
| Alpha Counter | 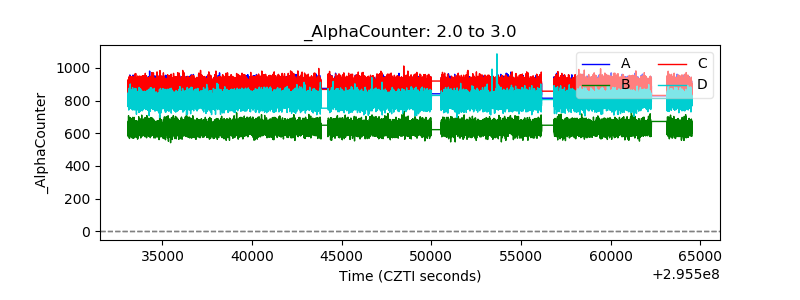 |
| _CPM_Rate | 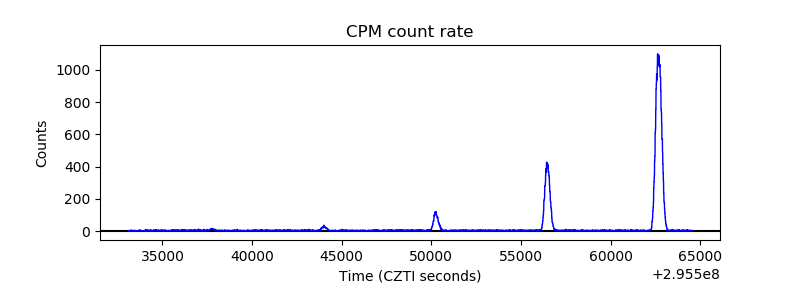 |
| CZT Counter | 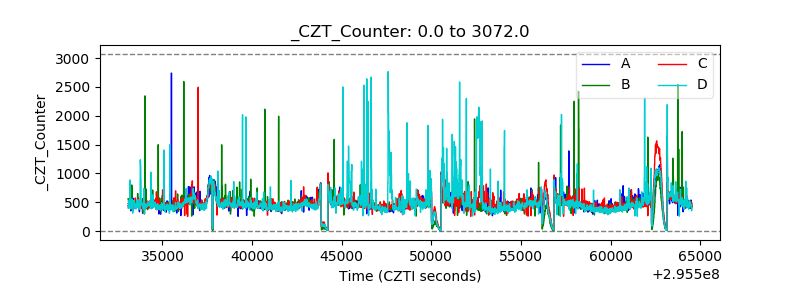 |
| +2.5 Volts monitor |  |
| +5 Volts monitor |  |
| _ROLL_ROT | 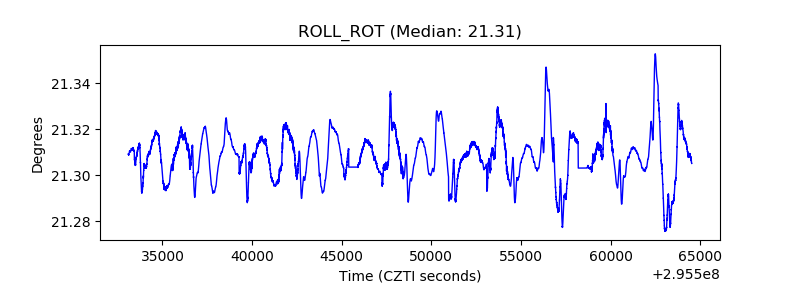 |
| _Roll_DEC | 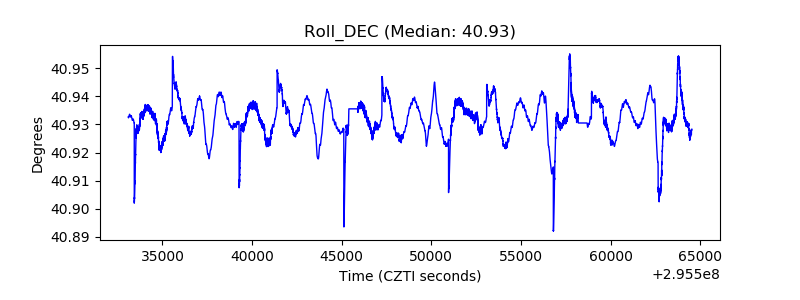 |
| _Roll_RA | 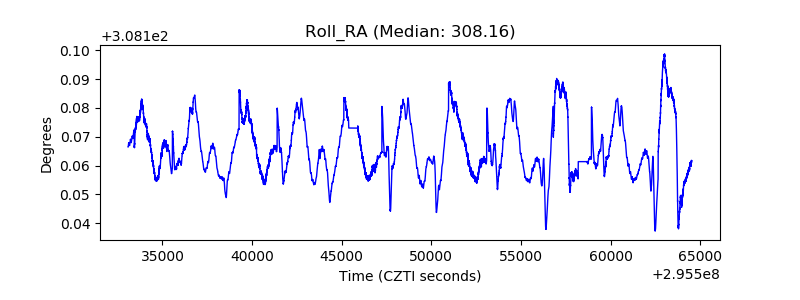 |
| Veto Counter | 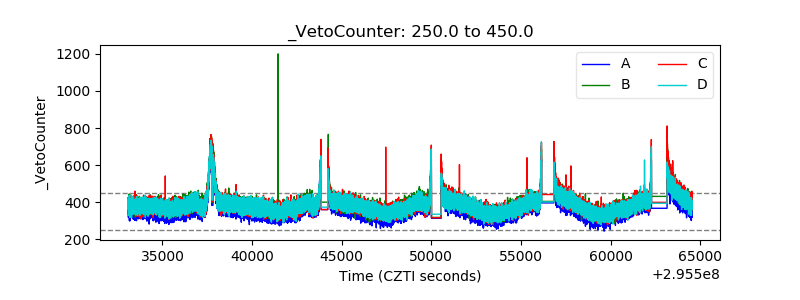 |