| Param | Original file | Final file |
|---|---|---|
| Filename | modeM0/AS1T03_115T01_9000002914_19608cztM0_level2.evt | modeM0/AS1T03_115T01_9000002914_19608cztM0_level2_quad_clean.evt |
| Size (bytes) | 447,177,600 | 101,759,040 |
| Size | 426.5 MB | 97.0 MB |
| Events in quadrant A | 3,202,929 | 662,763 |
| Events in quadrant B | 3,353,060 | 670,610 |
| Events in quadrant C | 3,190,414 | 651,038 |
| Events in quadrant D | 3,348,011 | 637,434 |
| Mode M9 | |||
|---|---|---|---|
| Quadrant | BADHDUFLAG | Total packets | Discarded packets |
| A | 0 | 16 | 0 |
| B | 0 | 17 | 0 |
| C | 0 | 17 | 0 |
| D | 0 | 17 | 0 |
| Mode SS | |||
|---|---|---|---|
| Quadrant | BADHDUFLAG | Total packets | Discarded packets |
| A | 0 | 136 | 0 |
| B | 0 | 136 | 0 |
| C | 0 | 136 | 0 |
| D | 0 | 136 | 0 |
| Mode M0 | |||
|---|---|---|---|
| Quadrant | BADHDUFLAG | Total packets | Discarded packets |
| A | 0 | 13932 | 2 |
| B | 0 | 14467 | 2 |
| C | 0 | 13840 | 2 |
| D | 0 | 14723 | 2 |
| Quadrant | Total seconds | Saturated seconds | Saturation percentage |
|---|---|---|---|
| A | 6590 | 30 | 0.455235% |
| B | 6590 | 75 | 1.138088% |
| C | 6590 | 66 | 1.001517% |
| D | 6590 | 46 | 0.698027% |
Noise dominated data is calculated using 1-second bins in cleaned event files. If a bin has >2000 counts, and if more than 50% of those come from <1% of pixels, then it is considered to be noise-dominated and hence unusable.
| Quadrant | # 1 sec bins | Bins with >0 counts | Bins with >2000 counts | High rate bins dominated by noise | Noise dominated (total time) | Noise dominated (detector-on time) | Marked lightcurve |
|---|---|---|---|---|---|---|---|
| A | 7640 | 6591 | 1 | 1 | 0.01% | 0.02% | 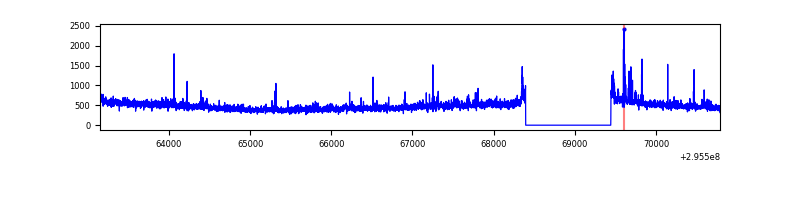 |
| B | 7640 | 6591 | 28 | 28 | 0.37% | 0.42% | 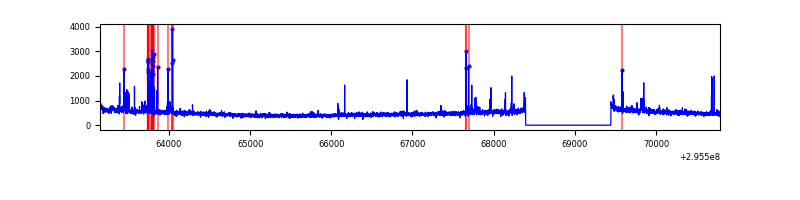 |
| C | 7640 | 6591 | 0 | 0 | 0.00% | 0.00% | 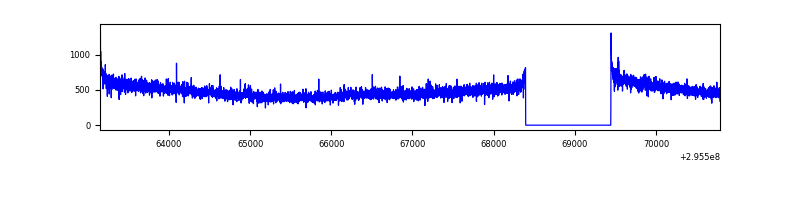 |
| D | 7640 | 6591 | 24 | 24 | 0.31% | 0.36% | 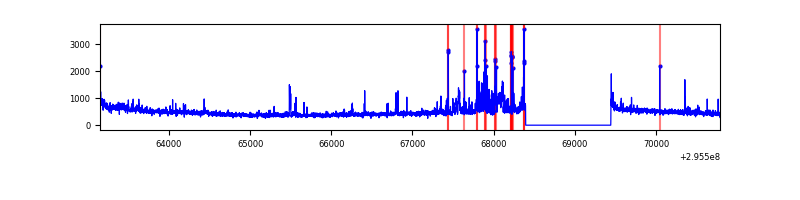 |
Top three noisy pixels from each quadrant. If the there are fewer than three noisy pixels in the level2.evt file, extra rows are filled as -1
| Pixel properties | Quadrant properties | ||||||
|---|---|---|---|---|---|---|---|
| Quadrant | DetID | PixID | Counts | Sigma | Mean | Median | Sigma |
| A | 9 | 143 | 97217 | 602.54 | 795 | 780 | 160.1 |
| A | 5 | 16 | 28755 | 174.79 | 795 | 780 | 160.1 |
| A | 11 | 29 | 8351 | 47.3 | 795 | 780 | 160.1 |
| B | 7 | 220 | 148963 | 984.73 | 793 | 772 | 150.5 |
| B | 4 | 216 | 26566 | 171.4 | 793 | 772 | 150.5 |
| B | 3 | 64 | 22520 | 144.52 | 793 | 772 | 150.5 |
| C | 14 | 238 | 119726 | 650.24 | 770 | 775 | 182.9 |
| C | 3 | 233 | 65688 | 354.85 | 770 | 775 | 182.9 |
| C | 13 | 61 | 5407 | 25.32 | 770 | 775 | 182.9 |
| D | 1 | 52 | 181414 | 954.59 | 775 | 752 | 189.3 |
| D | 10 | 199 | 88926 | 465.9 | 775 | 752 | 189.3 |
| D | 2 | 16 | 81119 | 424.65 | 775 | 752 | 189.3 |
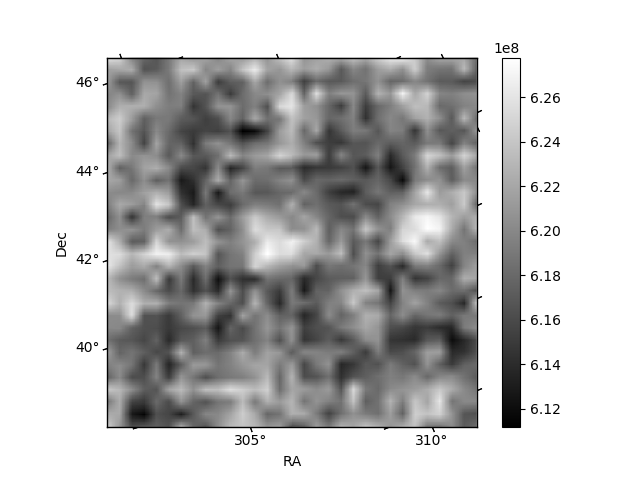
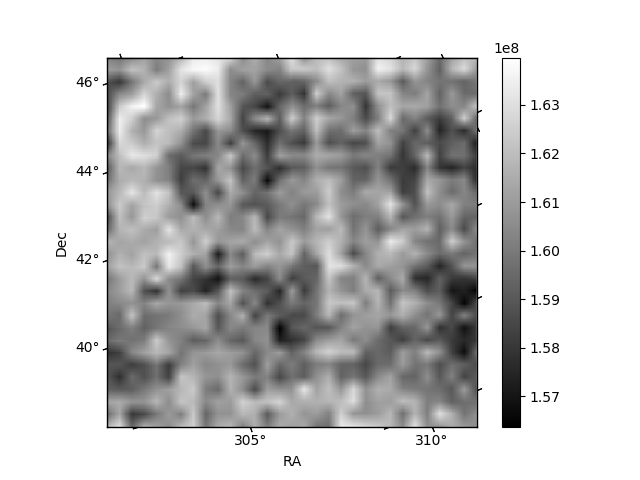
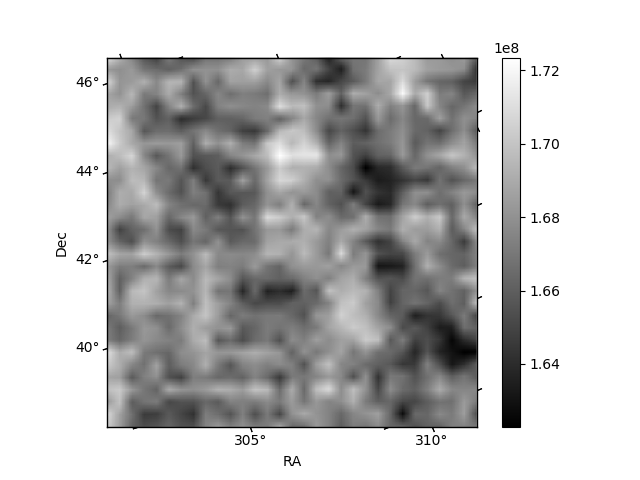
Histogram calculated using DETX and DETY for each event in the final _common_clean file
| Quadrant A | 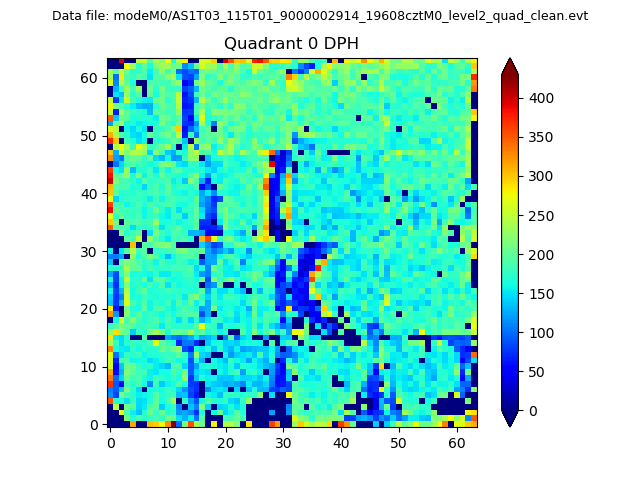 |
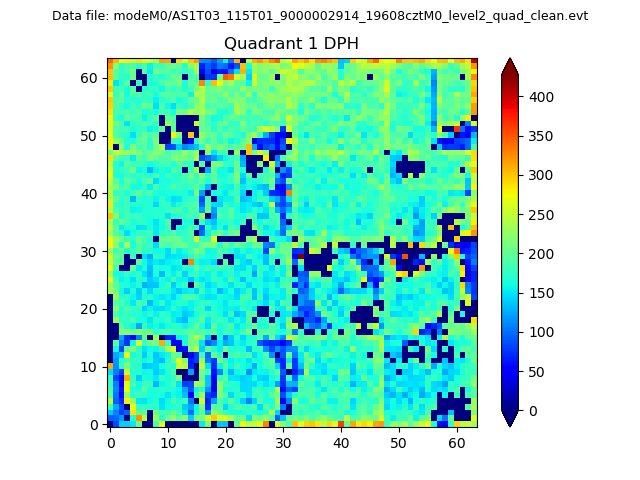 |
Quadrant B |
|---|---|---|---|
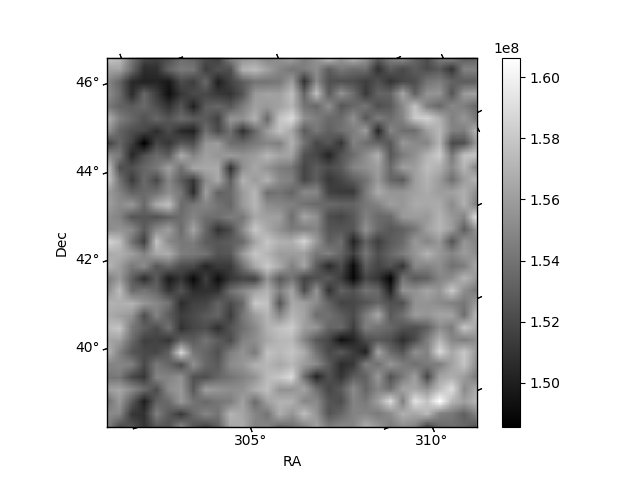
| Quadrant D | 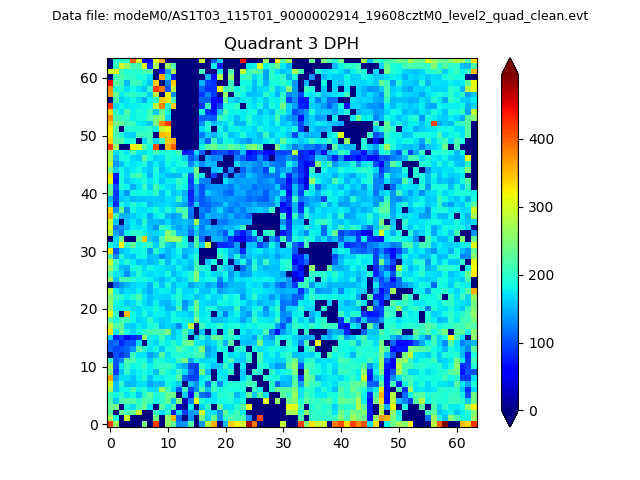 |
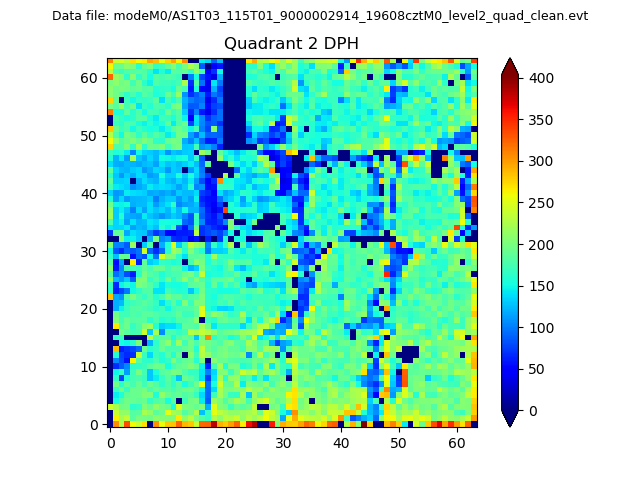 |
Quadrant C |
| Plot type | Count rate plots | Images |
|---|---|---|
| Comparison with Poisson distribution Blue bars denote a histogram of data divided into 1 sec bins. Red curve is a Poisson curve with rate = median count rate of data. |
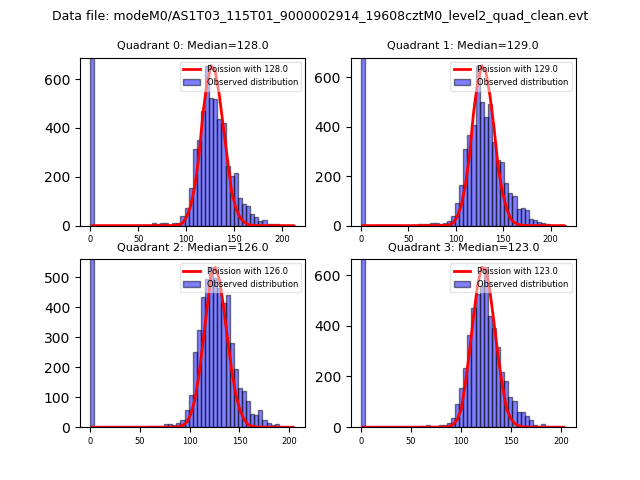 |
 |
| Quadrant-wise count rates Data is divided into 100 sec bins |
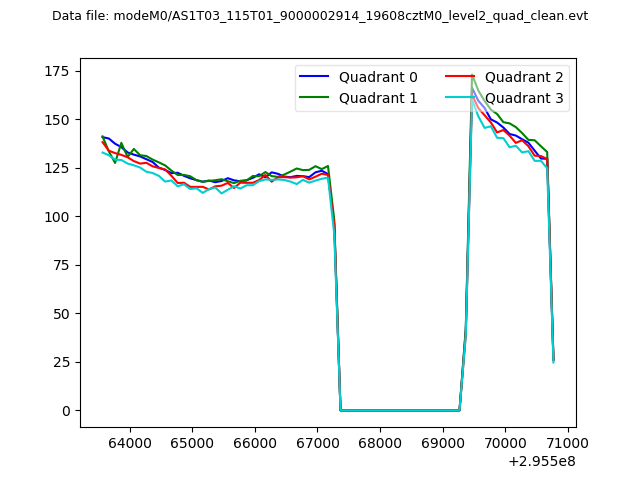 |
|
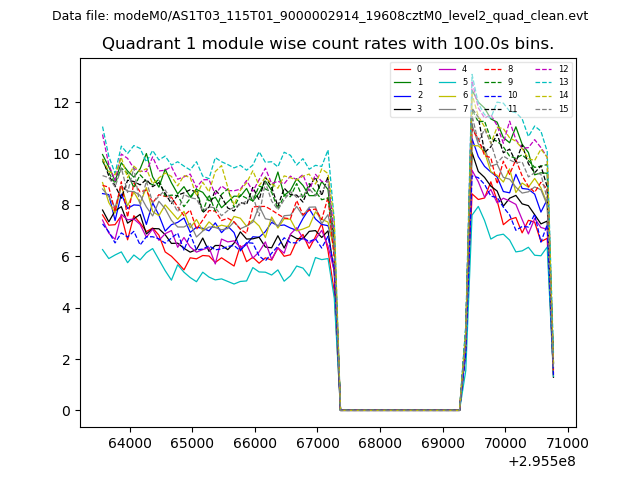
| Module-wise count rates for Quadrant A Data is divided into 100 sec bins |
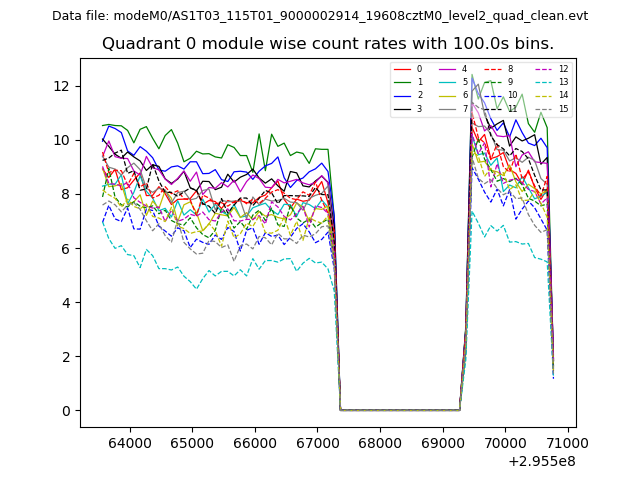 |
 |
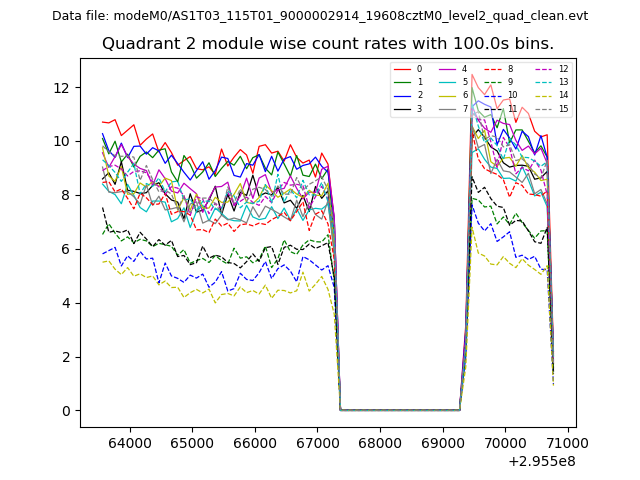
| Module-wise count rates for Quadrant B Data is divided into 100 sec bins |
 |
 |
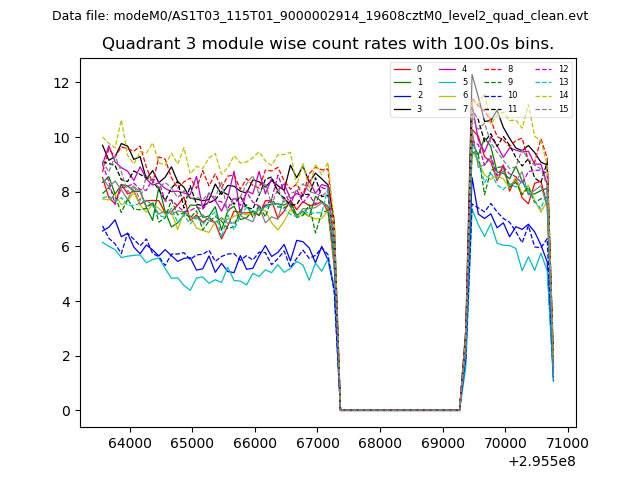
| Module-wise count rates for Quadrant C Data is divided into 100 sec bins |
 |
 |
| Module-wise count rates for Quadrant D Data is divided into 100 sec bins |
 |
 |
| Parameter | Plot |
|---|---|
| CZT HV Monitor | 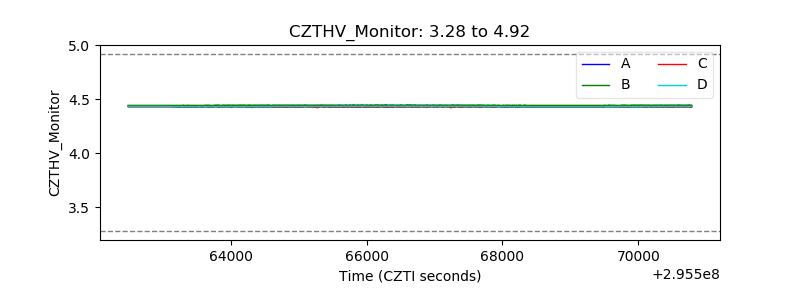 |
| D_VDD | 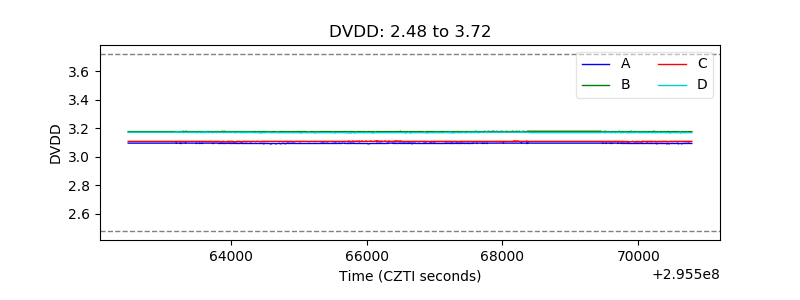 |
| Temperature 1 | 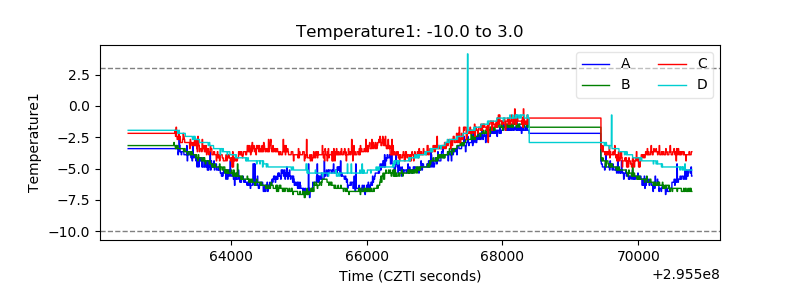 |
| Veto HV Monitor | 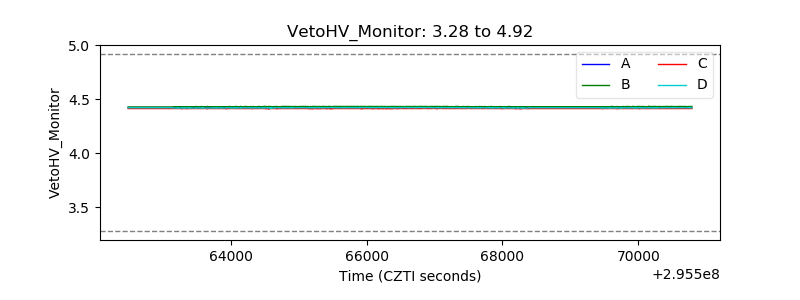 |
| Veto LLD | 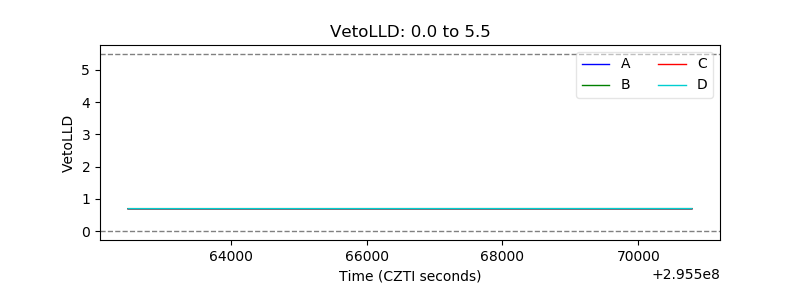 |
| Alpha Counter | 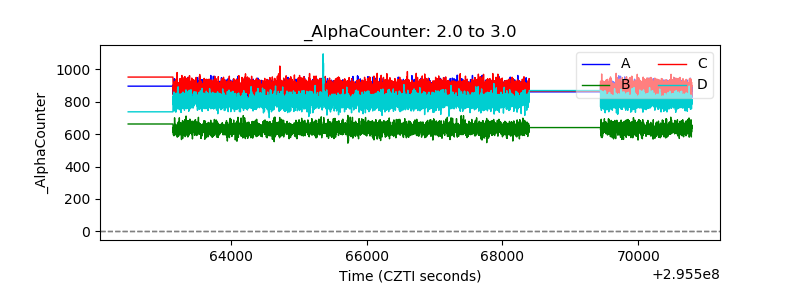 |
| _CPM_Rate | 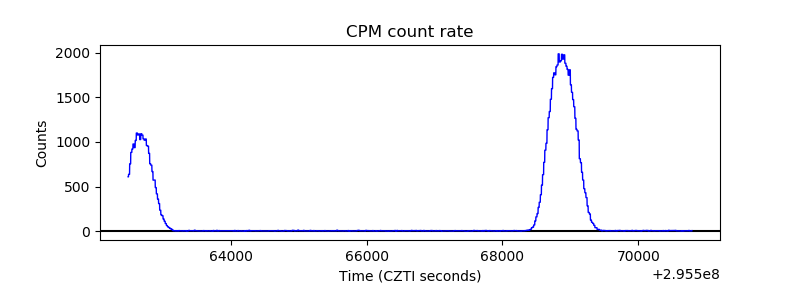 |
| CZT Counter | 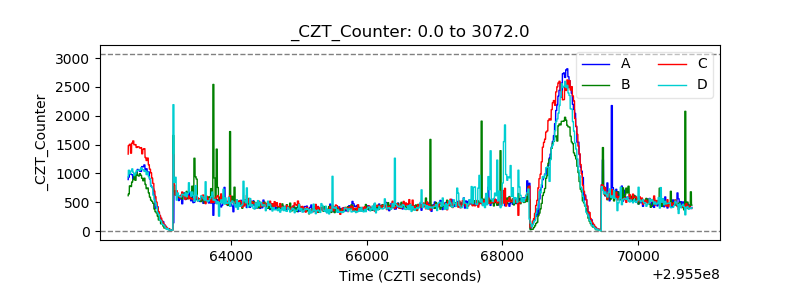 |
| +2.5 Volts monitor |  |
| +5 Volts monitor |  |
| _ROLL_ROT | 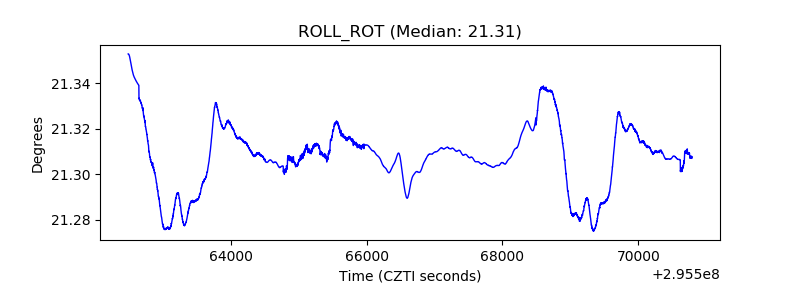 |
| _Roll_DEC | 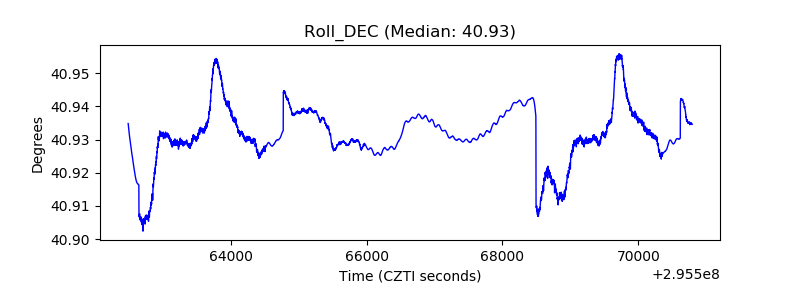 |
| _Roll_RA | 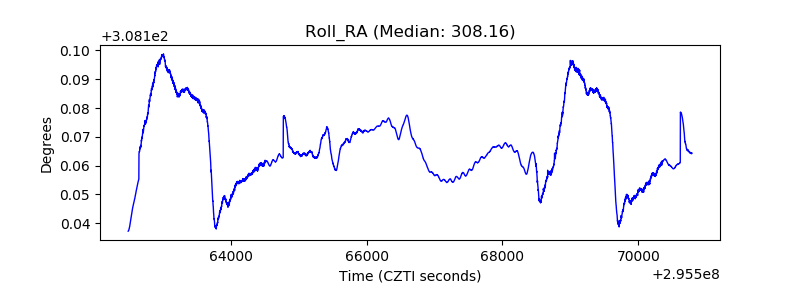 |
| Veto Counter | 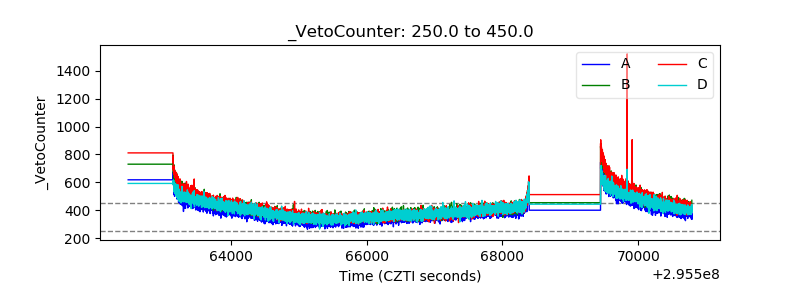 |