| Param | Original file | Final file |
|---|---|---|
| Filename | modeM0/AS1T03_115T01_9000002914_19610cztM0_level2.evt | modeM0/AS1T03_115T01_9000002914_19610cztM0_level2_quad_clean.evt |
| Size (bytes) | 439,741,440 | 106,182,720 |
| Size | 419.4 MB | 101.3 MB |
| Events in quadrant A | 3,178,333 | 697,981 |
| Events in quadrant B | 3,318,057 | 712,947 |
| Events in quadrant C | 3,187,318 | 687,447 |
| Events in quadrant D | 3,196,272 | 668,488 |
| Mode M9 | |||
|---|---|---|---|
| Quadrant | BADHDUFLAG | Total packets | Discarded packets |
| A | 0 | 18 | 0 |
| B | 0 | 19 | 0 |
| C | 0 | 19 | 0 |
| D | 0 | 19 | 0 |
| Mode SS | |||
|---|---|---|---|
| Quadrant | BADHDUFLAG | Total packets | Discarded packets |
| A | 0 | 130 | 0 |
| B | 0 | 130 | 0 |
| C | 0 | 130 | 0 |
| D | 0 | 130 | 0 |
| Mode M0 | |||
|---|---|---|---|
| Quadrant | BADHDUFLAG | Total packets | Discarded packets |
| A | 0 | 13784 | 3 |
| B | 0 | 14156 | 2 |
| C | 0 | 13703 | 2 |
| D | 0 | 13998 | 2 |
| Quadrant | Total seconds | Saturated seconds | Saturation percentage |
|---|---|---|---|
| A | 6440 | 28 | 0.434783% |
| B | 6440 | 96 | 1.490683% |
| C | 6440 | 69 | 1.071429% |
| D | 6440 | 37 | 0.574534% |
Noise dominated data is calculated using 1-second bins in cleaned event files. If a bin has >2000 counts, and if more than 50% of those come from <1% of pixels, then it is considered to be noise-dominated and hence unusable.
| Quadrant | # 1 sec bins | Bins with >0 counts | Bins with >2000 counts | High rate bins dominated by noise | Noise dominated (total time) | Noise dominated (detector-on time) | Marked lightcurve |
|---|---|---|---|---|---|---|---|
| A | 7600 | 6441 | 11 | 11 | 0.14% | 0.17% |  |
| B | 7600 | 6441 | 52 | 52 | 0.68% | 0.81% |  |
| C | 7600 | 6441 | 0 | 0 | 0.00% | 0.00% | 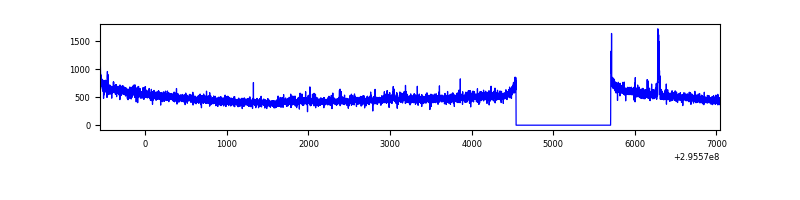 |
| D | 7600 | 6441 | 6 | 6 | 0.08% | 0.09% |  |
Top three noisy pixels from each quadrant. If the there are fewer than three noisy pixels in the level2.evt file, extra rows are filled as -1
| Pixel properties | Quadrant properties | ||||||
|---|---|---|---|---|---|---|---|
| Quadrant | DetID | PixID | Counts | Sigma | Mean | Median | Sigma |
| A | 9 | 143 | 88937 | 558.43 | 787 | 770 | 157.9 |
| A | 5 | 16 | 48733 | 303.79 | 787 | 770 | 157.9 |
| A | 15 | 174 | 8970 | 51.94 | 787 | 770 | 157.9 |
| B | 3 | 64 | 144516 | 967.35 | 790 | 769 | 148.6 |
| B | 7 | 220 | 38476 | 253.75 | 790 | 769 | 148.6 |
| B | 12 | 111 | 17727 | 114.12 | 790 | 769 | 148.6 |
| C | 14 | 238 | 119220 | 659.67 | 764 | 770 | 179.6 |
| C | 3 | 233 | 61465 | 338.02 | 764 | 770 | 179.6 |
| C | 9 | 54 | 21631 | 116.18 | 764 | 770 | 179.6 |
| D | 1 | 52 | 175561 | 939.04 | 766 | 746 | 186.2 |
| D | 7 | 238 | 86669 | 461.54 | 766 | 746 | 186.2 |
| D | 2 | 234 | 26405 | 137.83 | 766 | 746 | 186.2 |
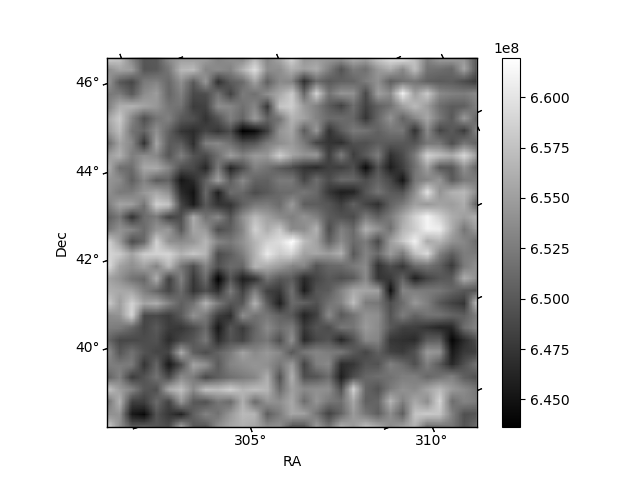
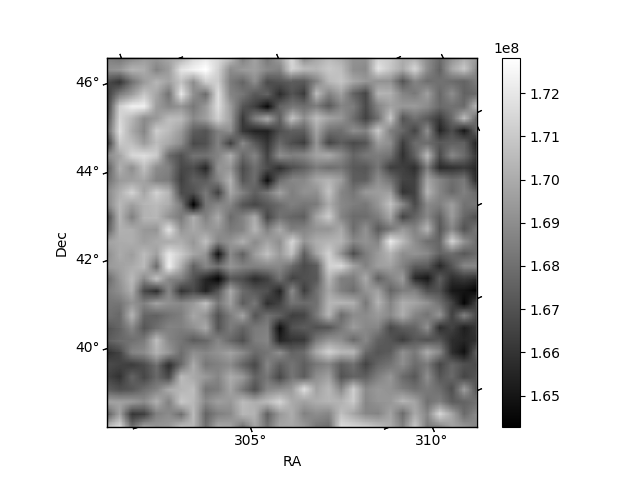
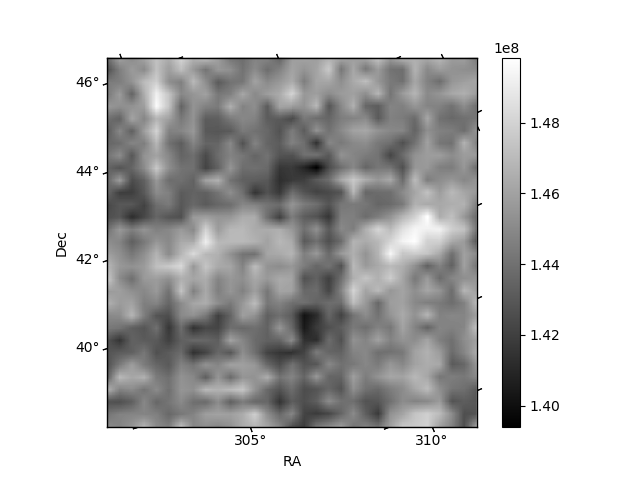
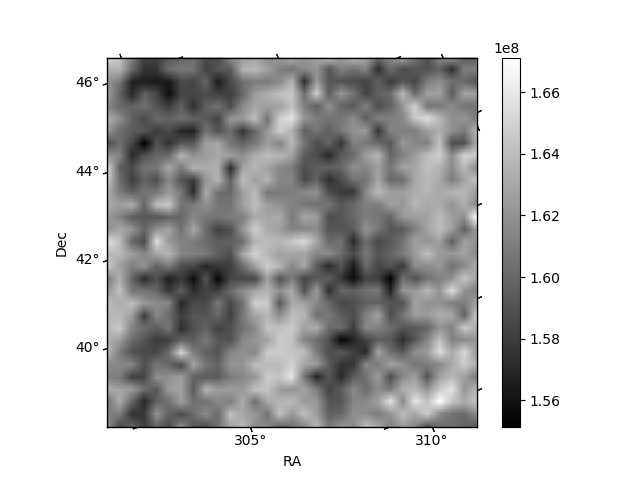
Histogram calculated using DETX and DETY for each event in the final _common_clean file
| Quadrant A | 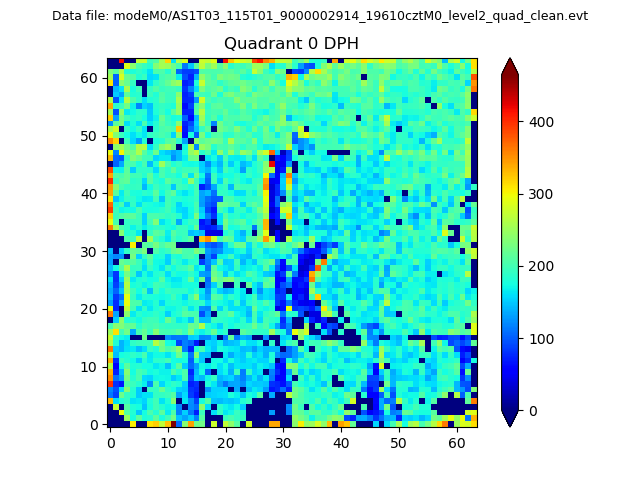 |
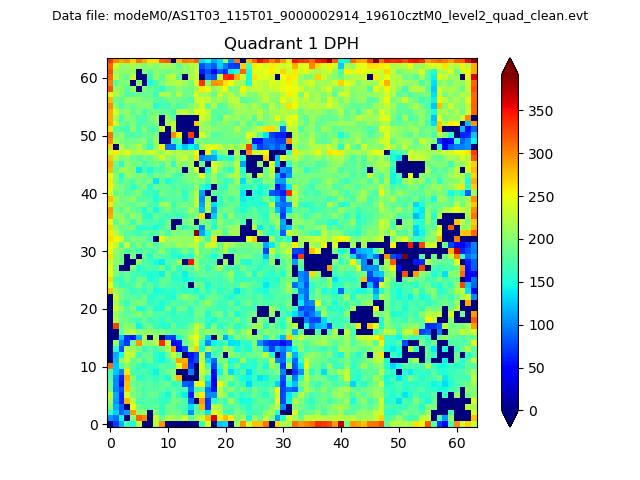 |
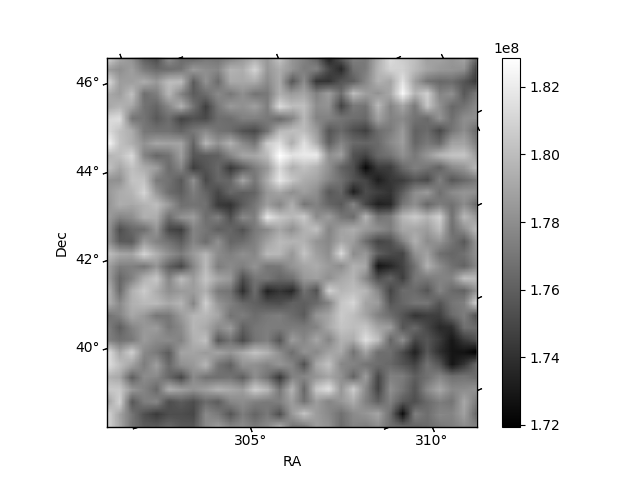
Quadrant B |
|---|---|---|---|
| Quadrant D |  |
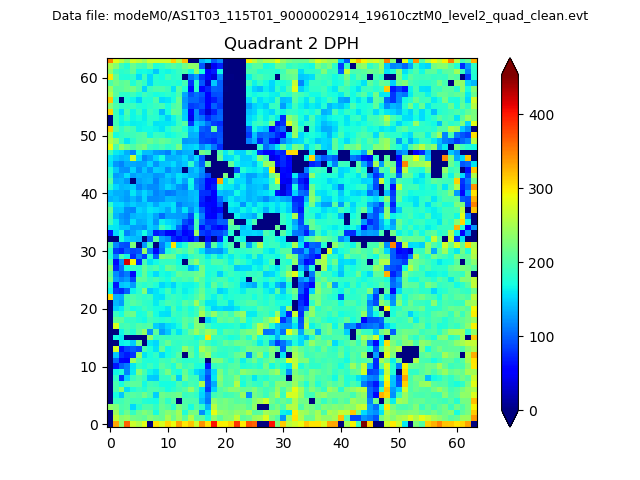 |
Quadrant C |
| Plot type | Count rate plots | Images |
|---|---|---|
| Comparison with Poisson distribution Blue bars denote a histogram of data divided into 1 sec bins. Red curve is a Poisson curve with rate = median count rate of data. |
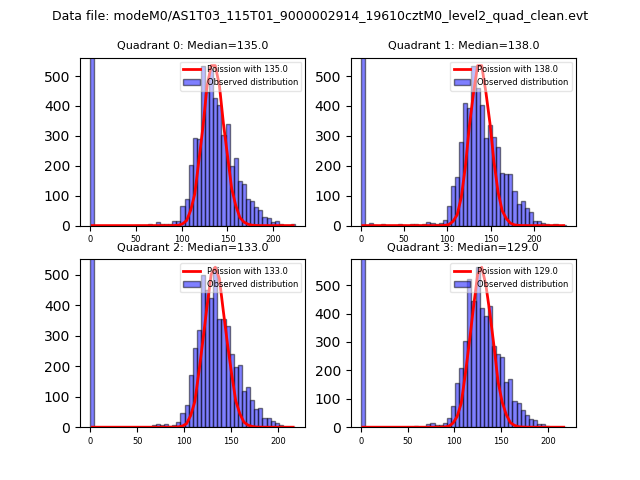 |
 |
| Quadrant-wise count rates Data is divided into 100 sec bins |
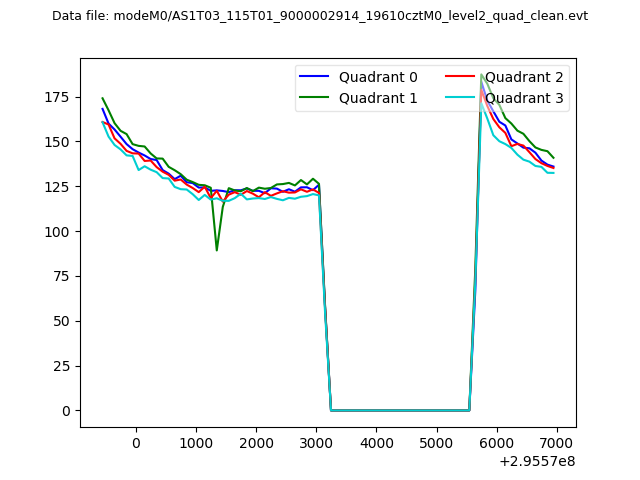 |
|
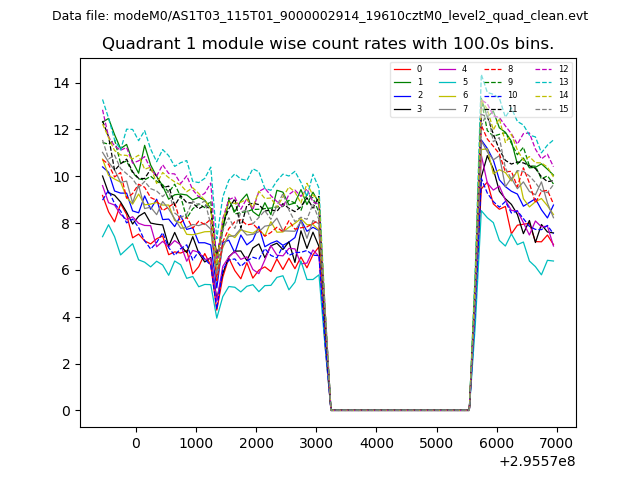
| Module-wise count rates for Quadrant A Data is divided into 100 sec bins |
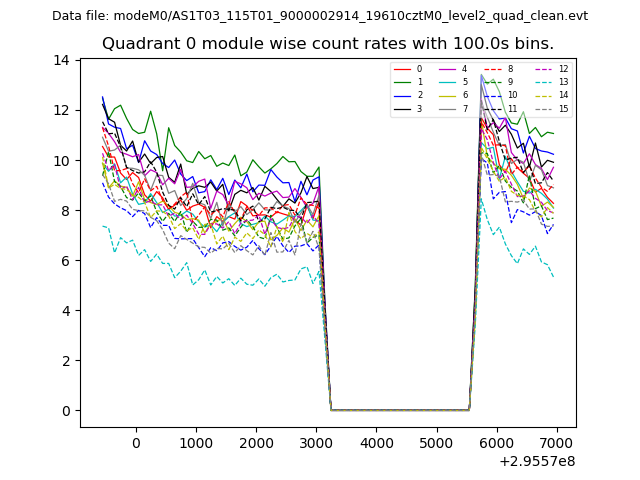 |
 |
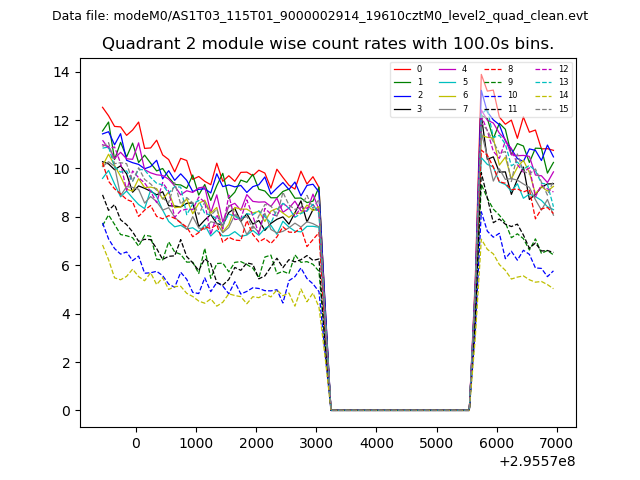
| Module-wise count rates for Quadrant B Data is divided into 100 sec bins |
 |
 |
| Module-wise count rates for Quadrant C Data is divided into 100 sec bins |
 |
 |
| Module-wise count rates for Quadrant D Data is divided into 100 sec bins |
 |
 |
| Parameter | Plot |
|---|---|
| CZT HV Monitor | 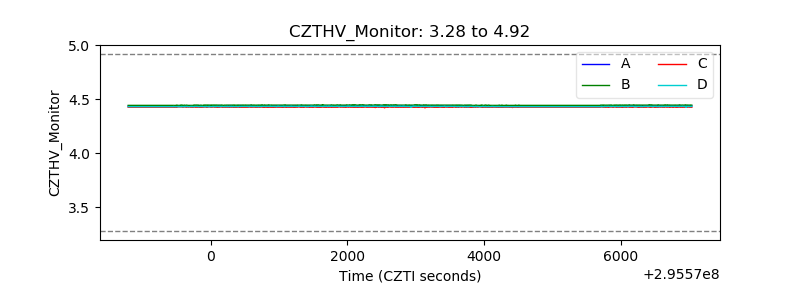 |
| D_VDD | 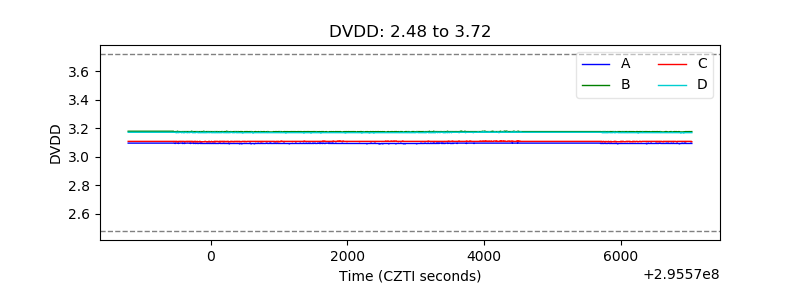 |
| Temperature 1 | 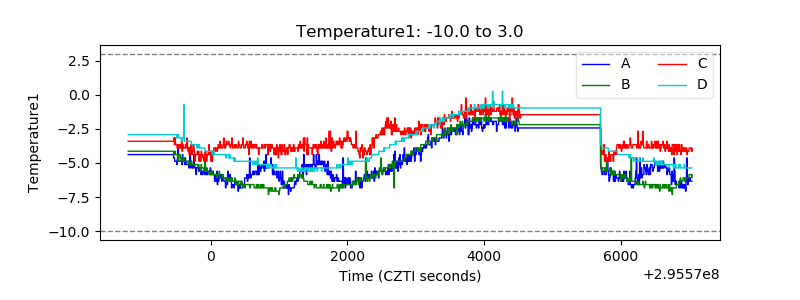 |
| Veto HV Monitor | 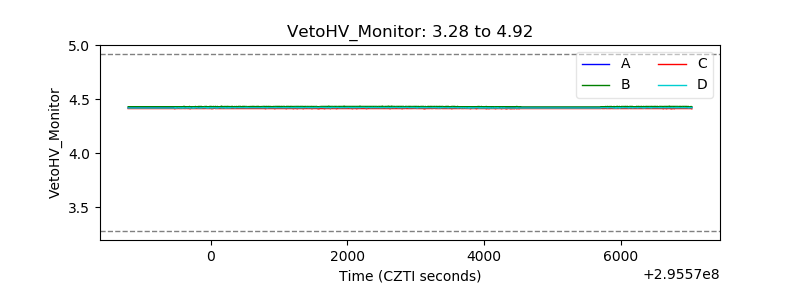 |
| Veto LLD |  |
| Alpha Counter | 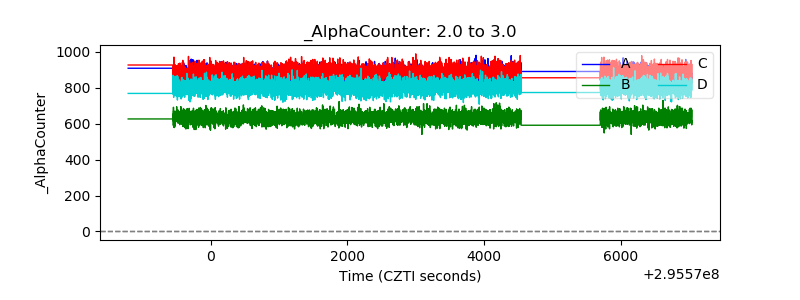 |
| _CPM_Rate | 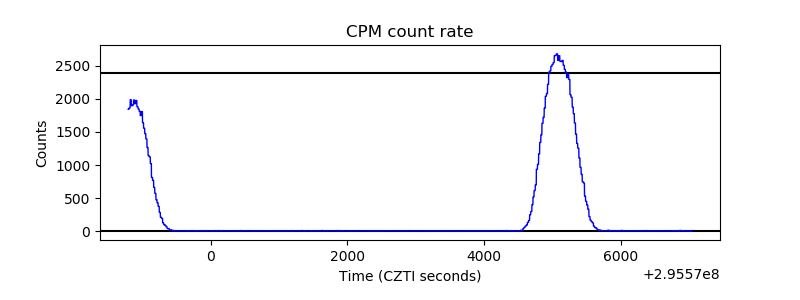 |
| CZT Counter | 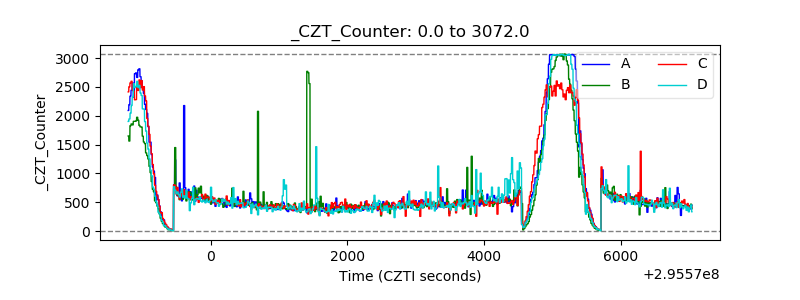 |
| +2.5 Volts monitor |  |
| +5 Volts monitor |  |
| _ROLL_ROT | 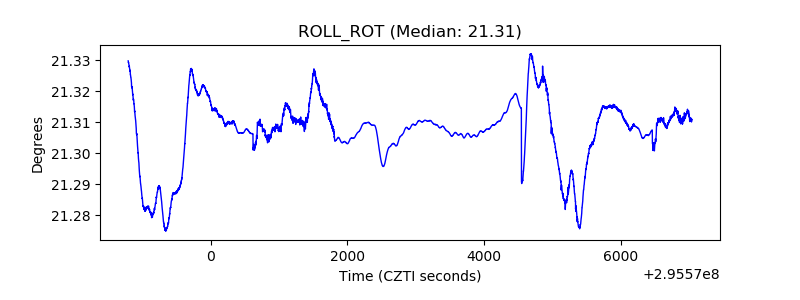 |
| _Roll_DEC | 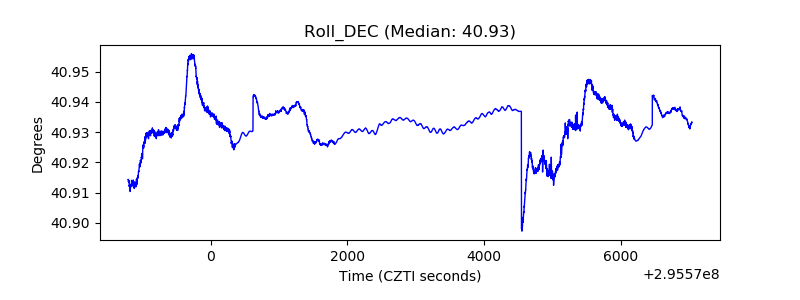 |
| _Roll_RA | 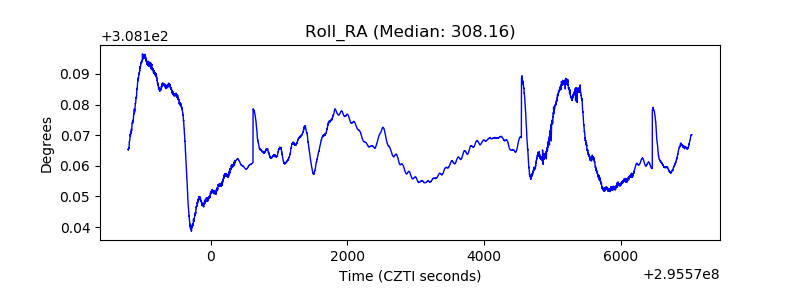 |
| Veto Counter | 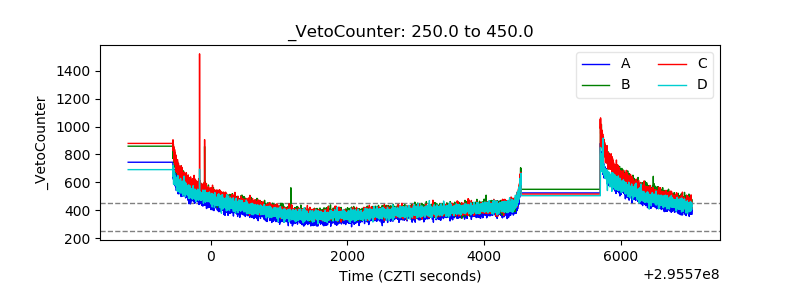 |