| Param | Original file | Final file |
|---|---|---|
| Filename | modeM0/AS1T03_116T01_9000002916cztM0_level2.fits | modeM0/AS1T03_116T01_9000002916cztM0_level2_quad_clean.evt |
| Size (bytes) | 889,940,160 | 659,410,560 |
| Size | 848.7 MB | 628.9 MB |
| Events in quadrant A | 5,565,348 | 3,657,896 |
| Events in quadrant B | 5,315,124 | 3,646,618 |
| Events in quadrant C | 5,345,842 | 3,463,514 |
| Events in quadrant D | 4,550,938 | 3,027,539 |
| Mode SS | |||
|---|---|---|---|
| Quadrant | BADHDUFLAG | Total packets | Discarded packets |
| A | 0 | 1828 | 0 |
| B | 0 | 1828 | 0 |
| C | 0 | 1828 | 0 |
| D | 0 | 1828 | 0 |
| Mode M0 | |||
|---|---|---|---|
| Quadrant | BADHDUFLAG | Total packets | Discarded packets |
| A | 0 | 187359 | 0 |
| B | 0 | 191013 | 0 |
| C | 0 | 192256 | 0 |
| D | 0 | 280828 | 0 |
| Mode M9 | |||
|---|---|---|---|
| Quadrant | BADHDUFLAG | Total packets | Discarded packets |
| A | 0 | 151 | 0 |
| B | 0 | 151 | 0 |
| C | 0 | 151 | 0 |
| D | 0 | 151 | 0 |
| Quadrant | Total seconds | Saturated seconds | Saturation percentage |
|---|---|---|---|
| A | 90048 | 1006 | 1.117182% |
| B | 90048 | 1391 | 1.544732% |
| C | 90048 | 1635 | 1.815698% |
| D | 90048 | 7372 | 8.186745% |
Noise dominated data is calculated using 1-second bins in cleaned event files. If a bin has >2000 counts, and if more than 50% of those come from <1% of pixels, then it is considered to be noise-dominated and hence unusable.
| Quadrant | # 1 sec bins | Bins with >0 counts | Bins with >2000 counts | High rate bins dominated by noise | Noise dominated (total time) | Noise dominated (detector-on time) | Marked lightcurve |
|---|---|---|---|---|---|---|---|
| A | 104907 | 90035 | 0 | 0 | 0.00% | 0.00% | 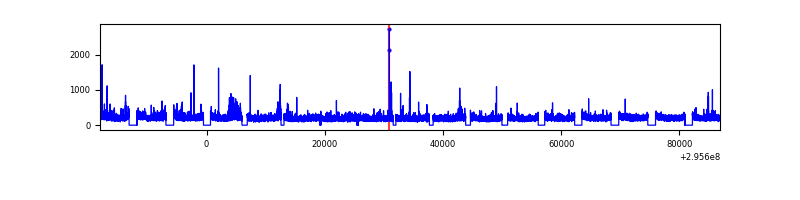 |
| B | 104907 | 90037 | 0 | 0 | 0.00% | 0.00% | 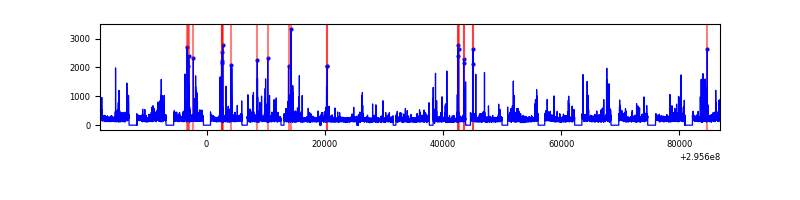 |
| C | 104907 | 90037 | 0 | 0 | 0.00% | 0.00% | 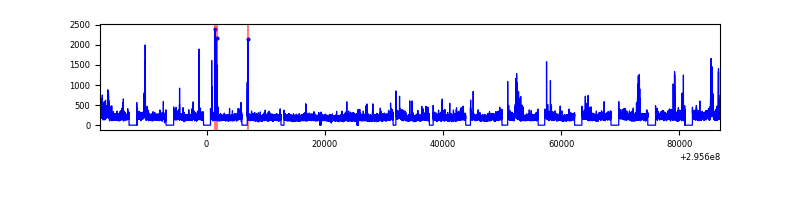 |
| D | 104907 | 89991 | 0 | 0 | 0.00% | 0.00% | 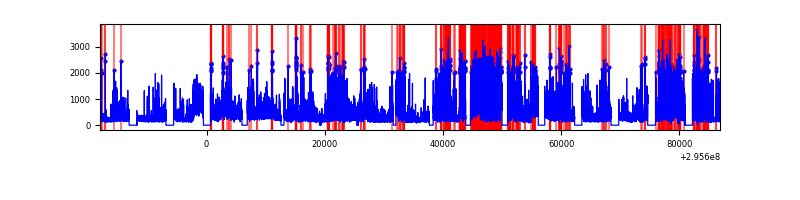 |
Top three noisy pixels from each quadrant. If the there are fewer than three noisy pixels in the level2.evt file, extra rows are filled as -1
| Pixel properties | Quadrant properties | ||||||
|---|---|---|---|---|---|---|---|
| Quadrant | DetID | PixID | Counts | Sigma | Mean | Median | Sigma |
| A | 0 | 29 | 5377 | 11.35 | 1448 | 1357 | 354.2 |
| A | 7 | 110 | 4469 | 8.79 | 1448 | 1357 | 354.2 |
| A | 9 | 19 | 4215 | 8.07 | 1448 | 1357 | 354.2 |
| B | 2 | 9 | 4402 | 11.25 | 1402 | 1340 | 272.1 |
| B | 2 | 8 | 3644 | 8.47 | 1402 | 1340 | 272.1 |
| B | 3 | 17 | 3514 | 7.99 | 1402 | 1340 | 272.1 |
| C | 12 | 241 | 3743 | 6.67 | 1412 | 1319 | 363.7 |
| C | 3 | 126 | 3626 | 6.34 | 1412 | 1319 | 363.7 |
| C | 12 | 250 | 3615 | 6.31 | 1412 | 1319 | 363.7 |
| D | 3 | 14 | 3282 | 6.11 | 1298 | 1180 | 343.9 |
| D | 6 | 231 | 3191 | 5.85 | 1298 | 1180 | 343.9 |
| D | 7 | 3 | 3174 | 5.8 | 1298 | 1180 | 343.9 |
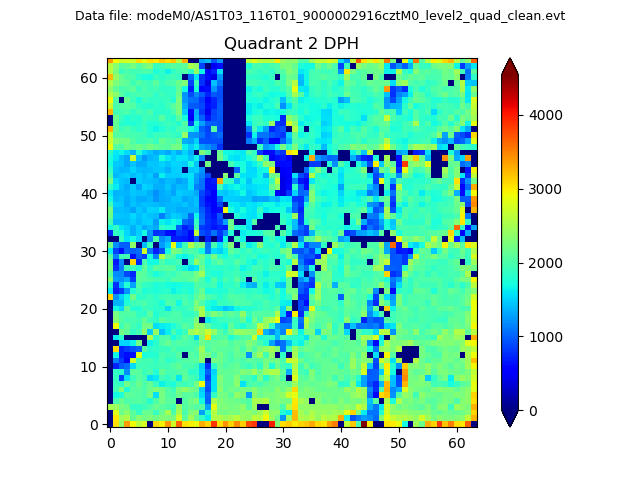
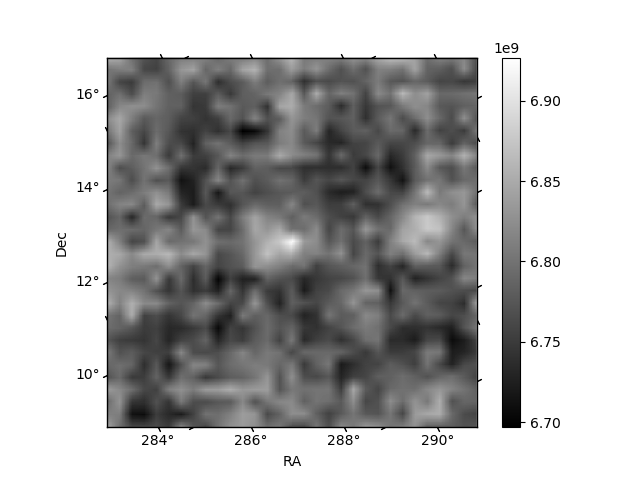
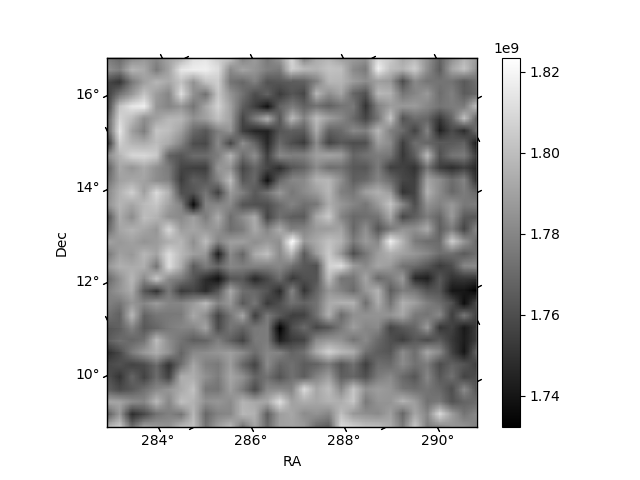
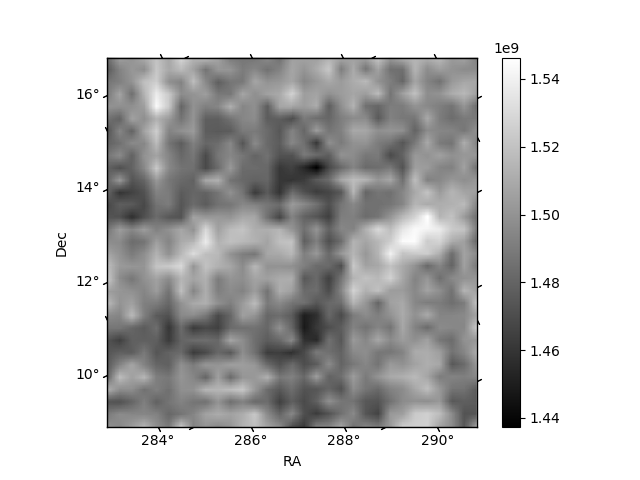
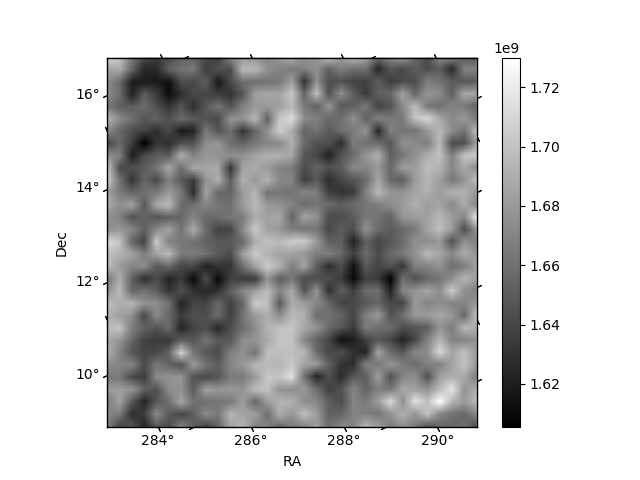
Histogram calculated using DETX and DETY for each event in the final _common_clean file
| Quadrant A | 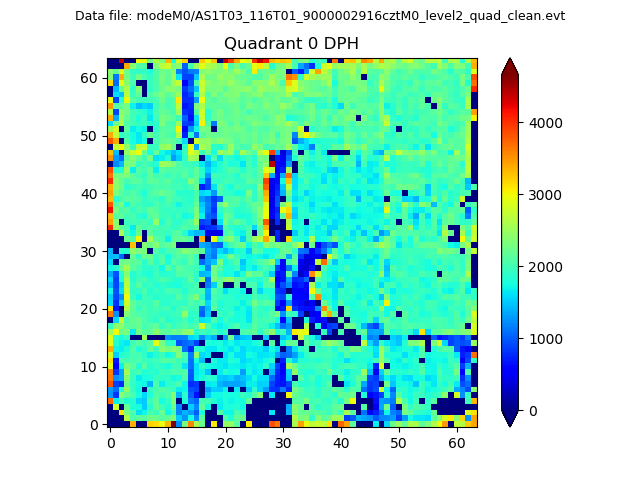 |
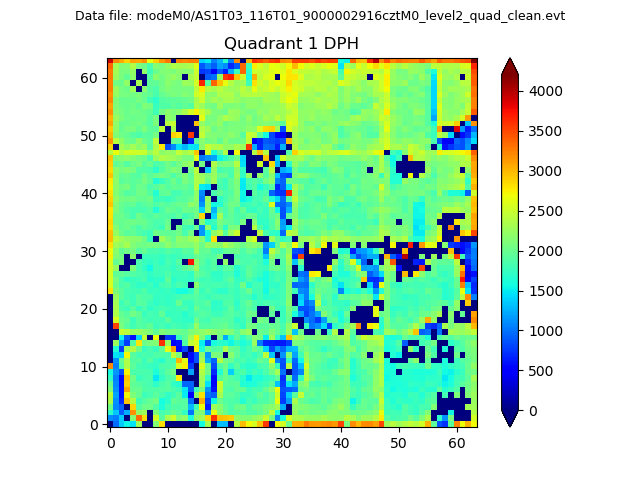 |
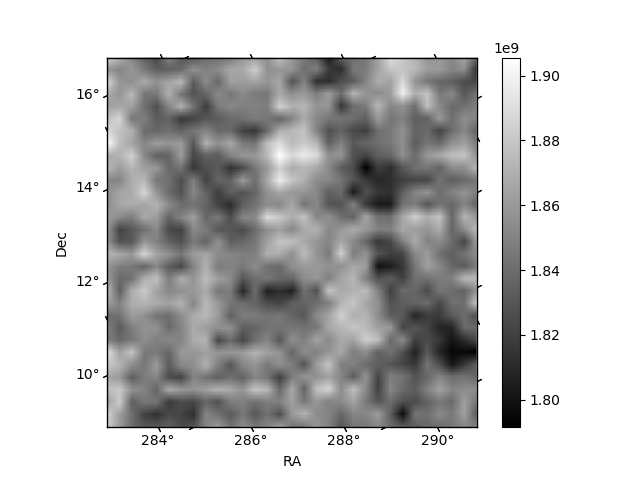
Quadrant B |
|---|---|---|---|
| Quadrant D | 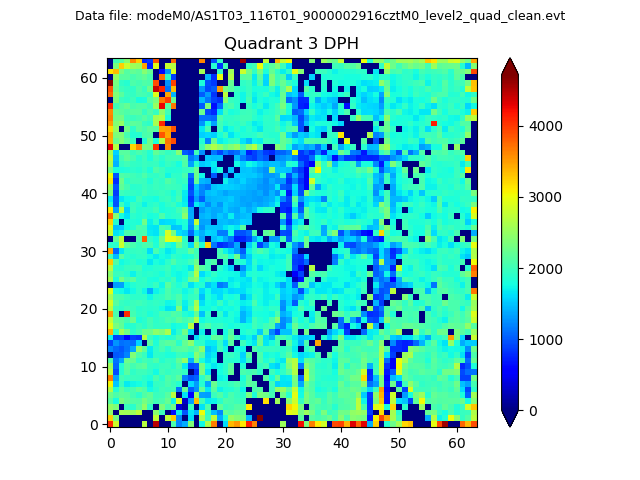 |
 |
Quadrant C |
| Plot type | Count rate plots | Images |
|---|---|---|
| Comparison with Poisson distribution Blue bars denote a histogram of data divided into 1 sec bins. Red curve is a Poisson curve with rate = median count rate of data. |
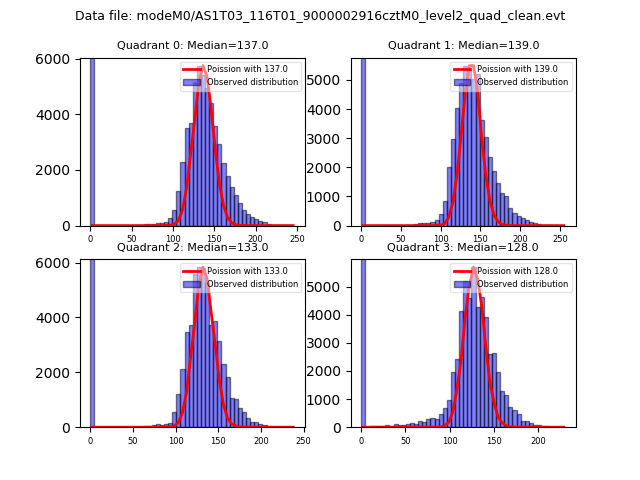 |
 |
| Quadrant-wise count rates Data is divided into 100 sec bins |
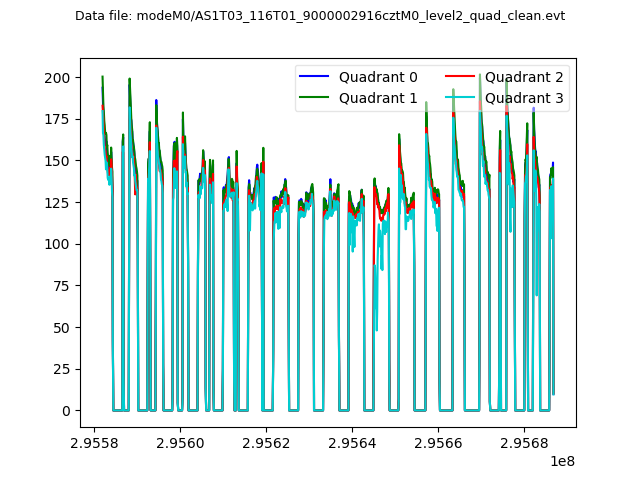 |
|
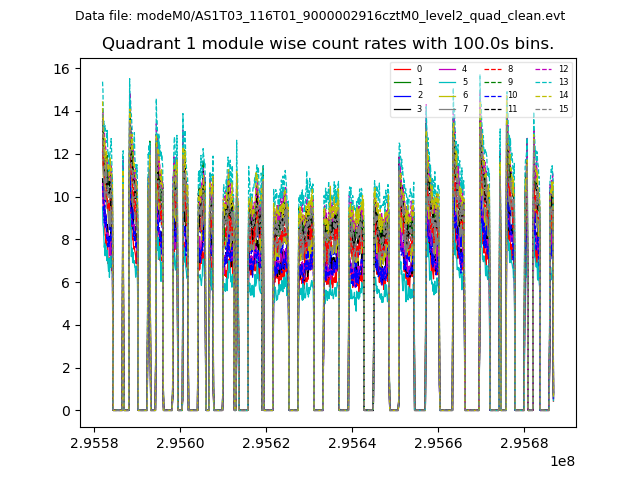
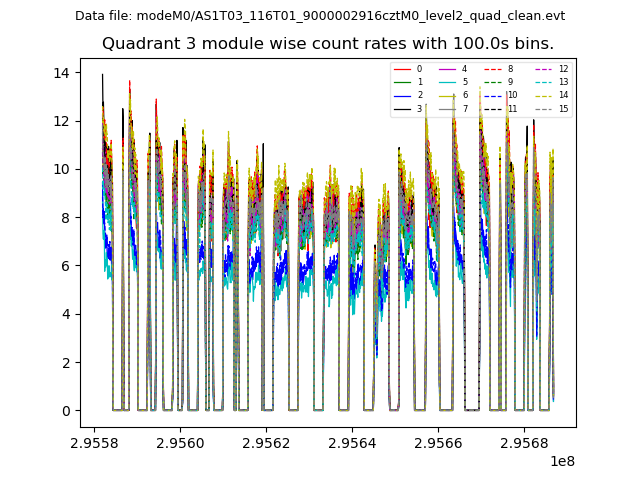
| Module-wise count rates for Quadrant A Data is divided into 100 sec bins |
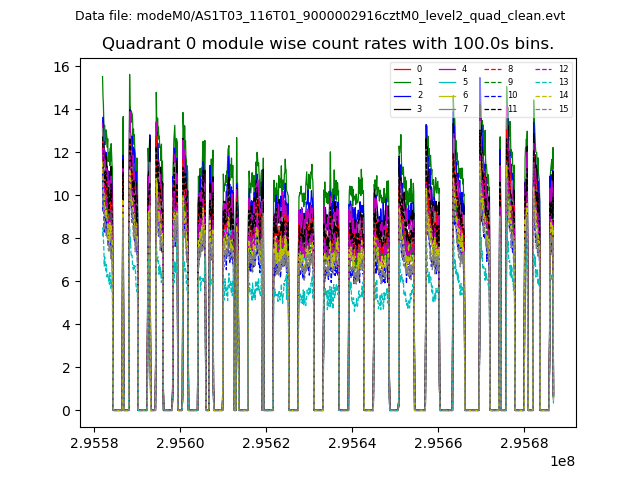 |
 |
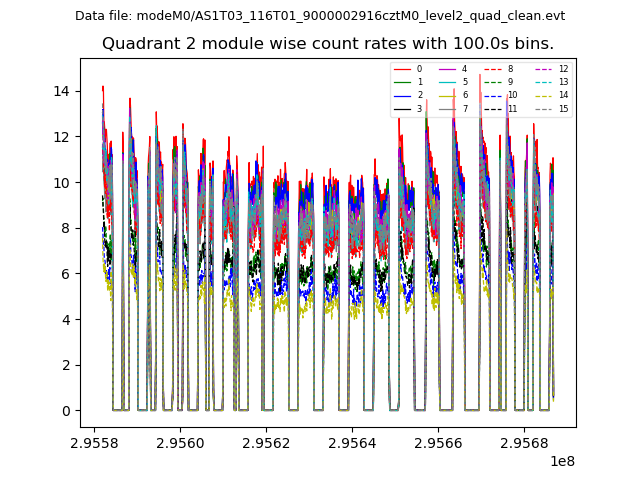
| Module-wise count rates for Quadrant B Data is divided into 100 sec bins |
 |
 |
| Module-wise count rates for Quadrant C Data is divided into 100 sec bins |
 |
 |
| Module-wise count rates for Quadrant D Data is divided into 100 sec bins |
 |
 |
| Parameter | Plot |
|---|---|
| CZT HV Monitor | 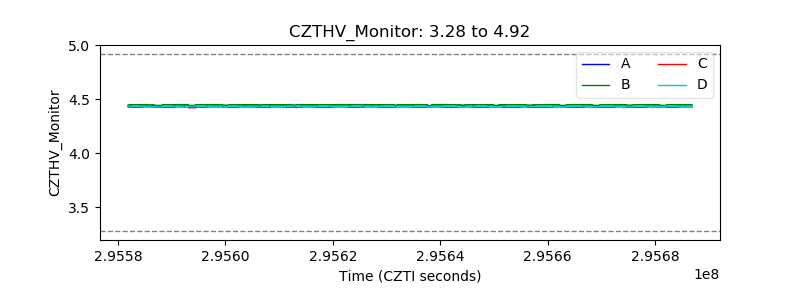 |
| D_VDD | 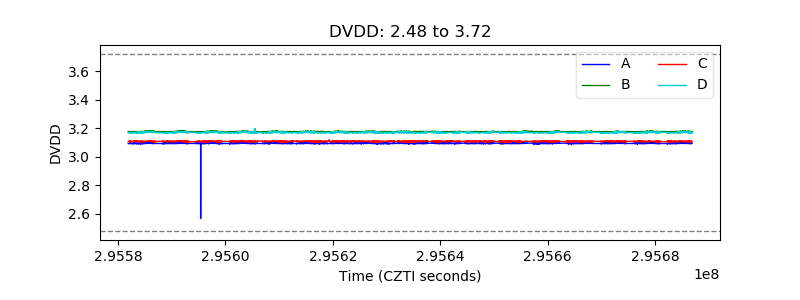 |
| Temperature 1 | 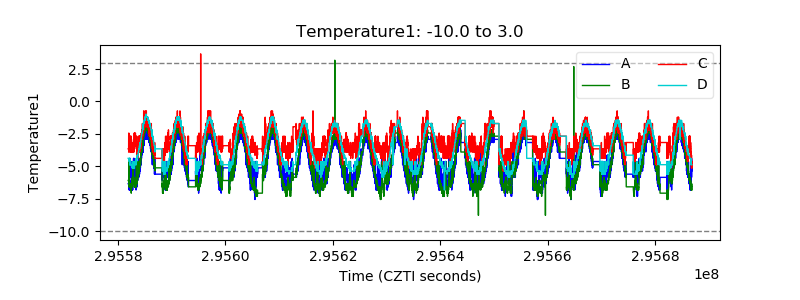 |
| Veto HV Monitor | 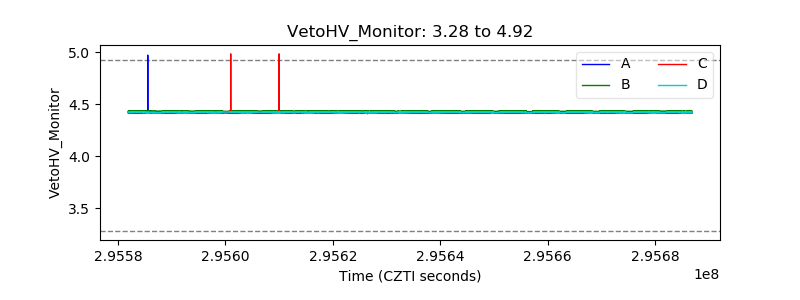 |
| Veto LLD | 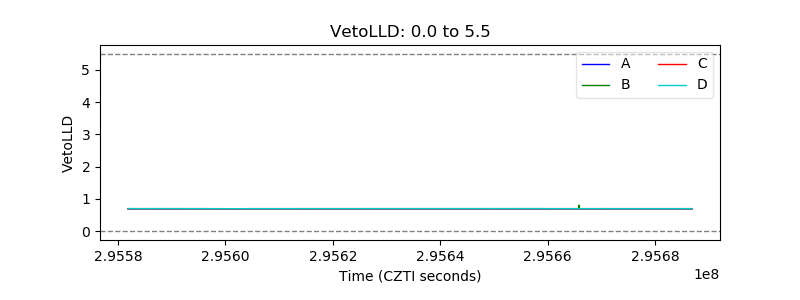 |
| Alpha Counter | 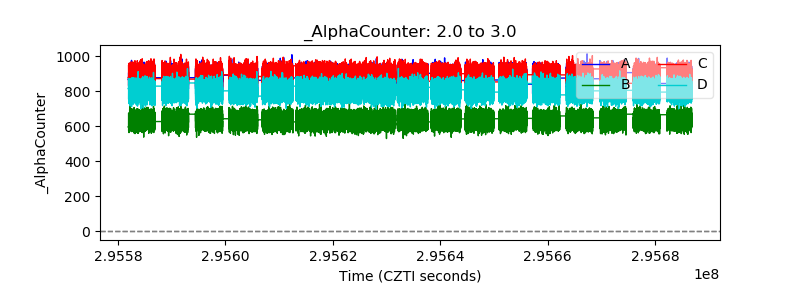 |
| _CPM_Rate | 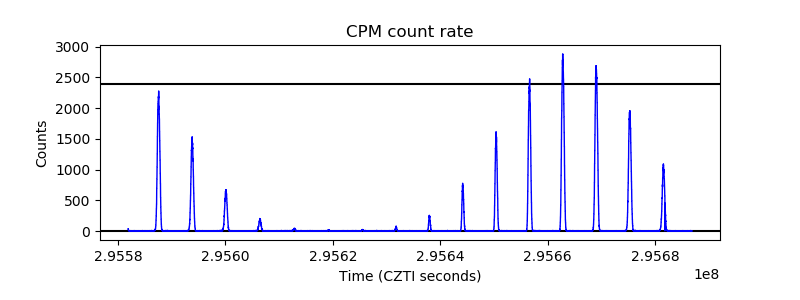 |
| CZT Counter | 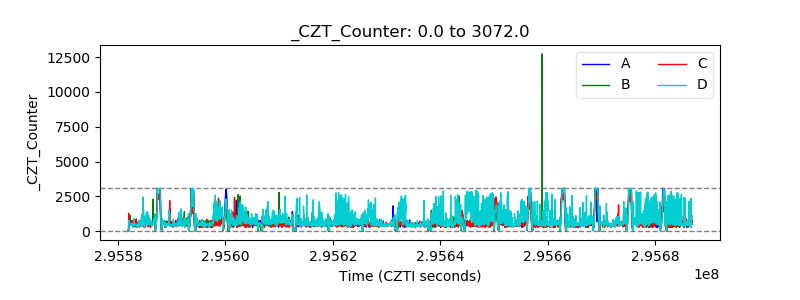 |
| +2.5 Volts monitor | 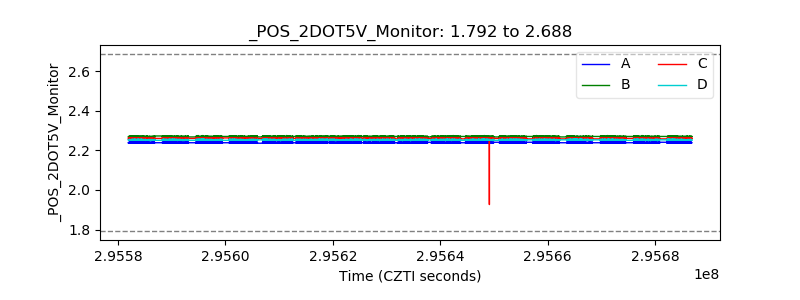 |
| +5 Volts monitor | 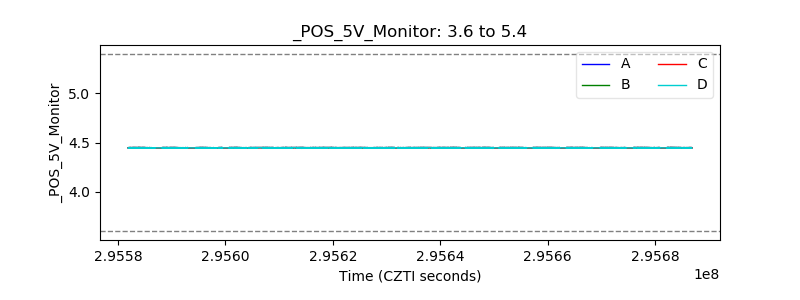 |
| _ROLL_ROT | 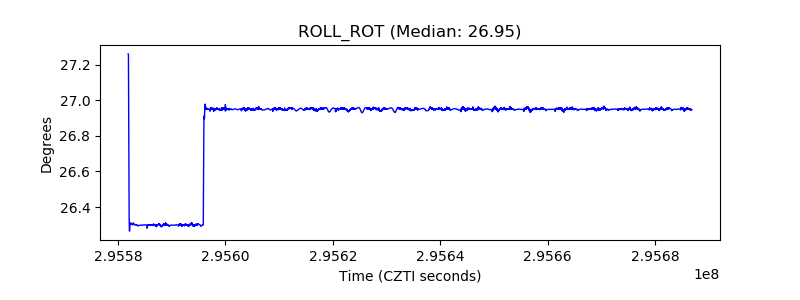 |
| _Roll_DEC | 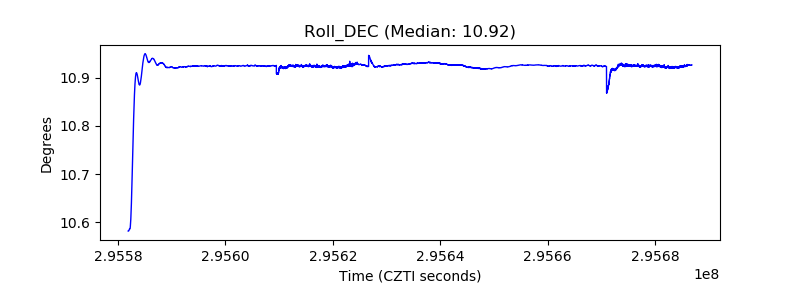 |
| _Roll_RA | 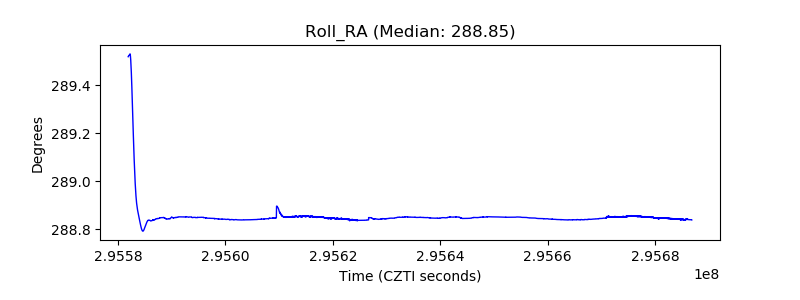 |
| Veto Counter | 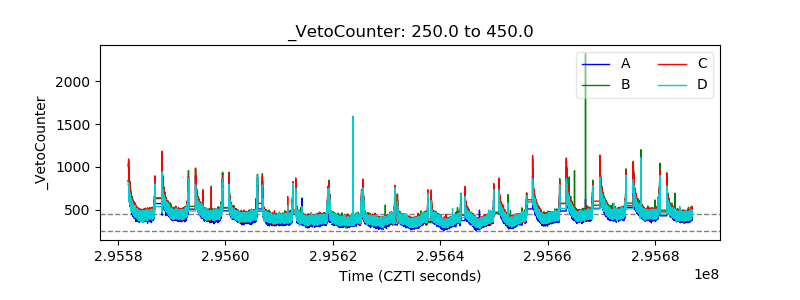 |