| Param | Original file | Final file |
|---|---|---|
| Filename | modeM0/AS1T03_116T01_9000002916_19611cztM0_level2.evt | modeM0/AS1T03_116T01_9000002916_19611cztM0_level2_quad_clean.evt |
| Size (bytes) | 91,641,600 | 29,655,360 |
| Size | 87.4 MB | 28.3 MB |
| Events in quadrant A | 658,510 | 204,740 |
| Events in quadrant B | 686,249 | 212,058 |
| Events in quadrant C | 706,533 | 197,303 |
| Events in quadrant D | 637,391 | 190,928 |
| Mode SS | |||
|---|---|---|---|
| Quadrant | BADHDUFLAG | Total packets | Discarded packets |
| A | 0 | 26 | 0 |
| B | 0 | 26 | 0 |
| C | 0 | 26 | 0 |
| D | 0 | 26 | 0 |
| Mode M0 | |||
|---|---|---|---|
| Quadrant | BADHDUFLAG | Total packets | Discarded packets |
| A | 0 | 2686 | 1 |
| B | 0 | 2769 | 1 |
| C | 0 | 2870 | 1 |
| D | 0 | 2654 | 1 |
| Mode M9 | |||
|---|---|---|---|
| Quadrant | BADHDUFLAG | Total packets | Discarded packets |
| A | 0 | 1 | 0 |
| B | 0 | 1 | 0 |
| C | 0 | 1 | 0 |
| D | 0 | 1 | 0 |
| Quadrant | Total seconds | Saturated seconds | Saturation percentage |
|---|---|---|---|
| A | 1226 | 3 | 0.244698% |
| B | 1226 | 4 | 0.326264% |
| C | 1226 | 15 | 1.223491% |
| D | 1226 | 8 | 0.652529% |
Noise dominated data is calculated using 1-second bins in cleaned event files. If a bin has >2000 counts, and if more than 50% of those come from <1% of pixels, then it is considered to be noise-dominated and hence unusable.
| Quadrant | # 1 sec bins | Bins with >0 counts | Bins with >2000 counts | High rate bins dominated by noise | Noise dominated (total time) | Noise dominated (detector-on time) | Marked lightcurve |
|---|---|---|---|---|---|---|---|
| A | 1226 | 1226 | 1 | 1 | 0.08% | 0.08% | 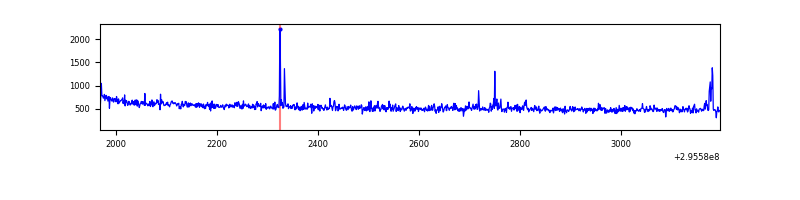 |
| B | 1226 | 1226 | 0 | 0 | 0.00% | 0.00% | 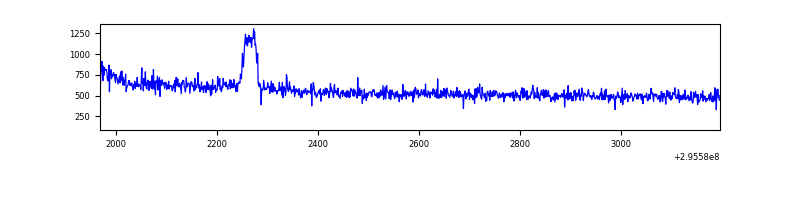 |
| C | 1225 | 1225 | 0 | 0 | 0.00% | 0.00% | 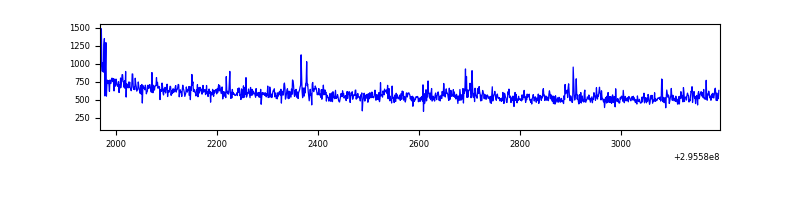 |
| D | 1226 | 1226 | 6 | 6 | 0.49% | 0.49% | 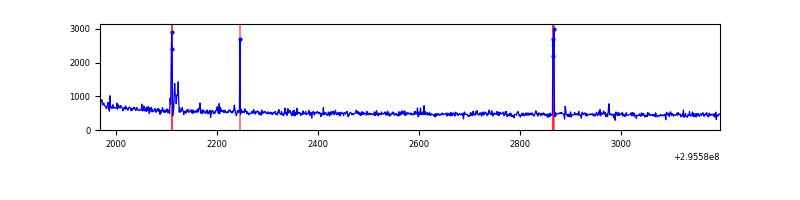 |
Top three noisy pixels from each quadrant. If the there are fewer than three noisy pixels in the level2.evt file, extra rows are filled as -1
| Pixel properties | Quadrant properties | ||||||
|---|---|---|---|---|---|---|---|
| Quadrant | DetID | PixID | Counts | Sigma | Mean | Median | Sigma |
| A | 9 | 143 | 20376 | 583.05 | 165 | 162 | 34.7 |
| A | 13 | 254 | 1393 | 35.51 | 165 | 162 | 34.7 |
| A | 0 | 226 | 1372 | 34.9 | 165 | 162 | 34.7 |
| B | 12 | 0 | 19394 | 576.39 | 170 | 167 | 33.4 |
| B | 12 | 111 | 3630 | 103.81 | 170 | 167 | 33.4 |
| B | 11 | 111 | 2973 | 84.12 | 170 | 167 | 33.4 |
| C | 3 | 233 | 40447 | 1023.04 | 163 | 164 | 39.4 |
| C | 14 | 238 | 26648 | 672.6 | 163 | 164 | 39.4 |
| C | 9 | 221 | 2224 | 52.32 | 163 | 164 | 39.4 |
| D | 7 | 96 | 12268 | 298.73 | 160 | 156 | 40.5 |
| D | 1 | 52 | 8355 | 202.22 | 160 | 156 | 40.5 |
| D | 7 | 238 | 6841 | 164.88 | 160 | 156 | 40.5 |
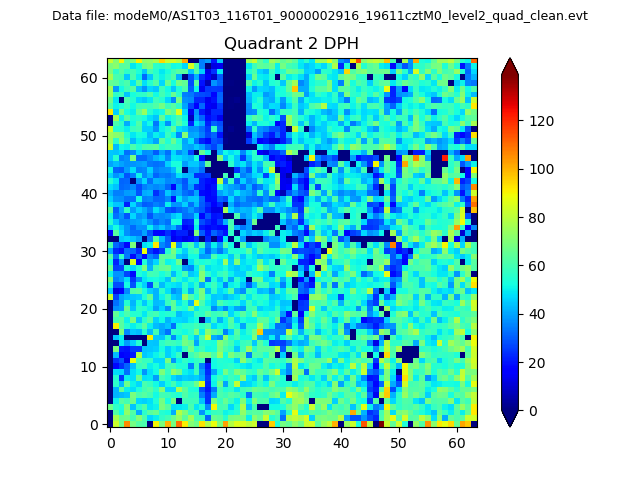
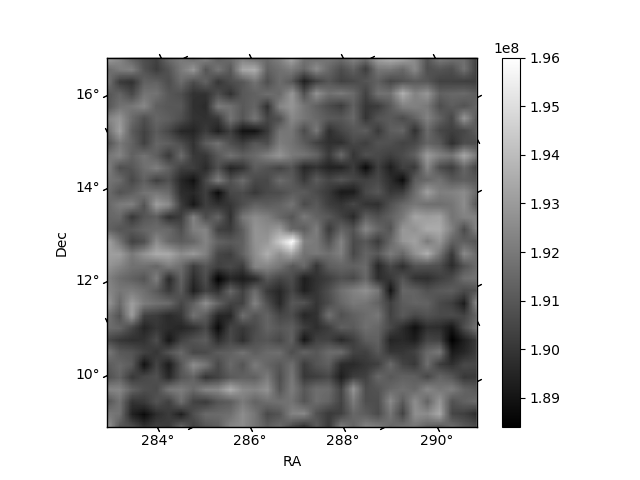
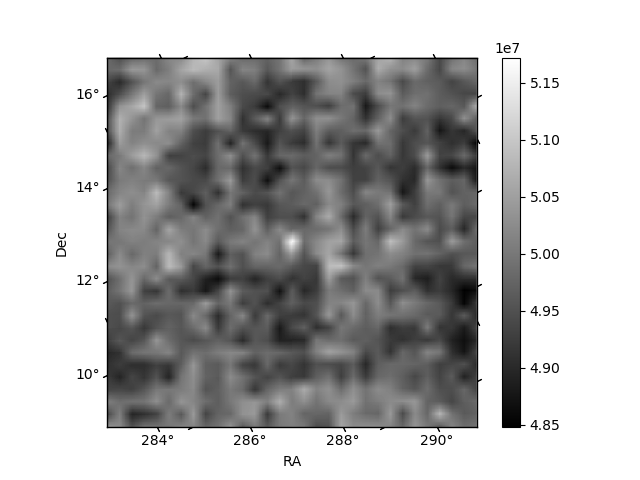
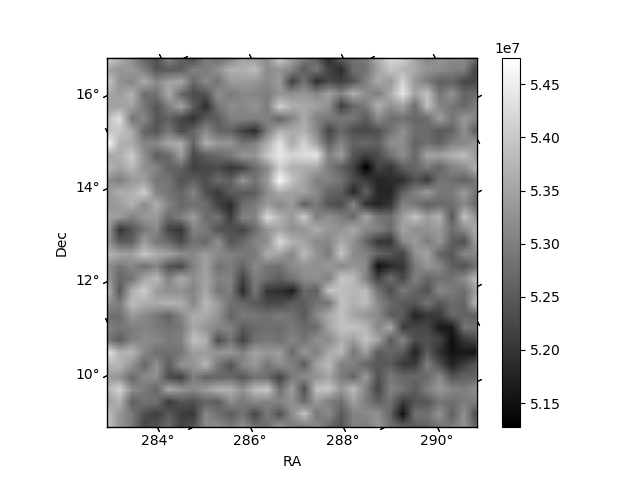
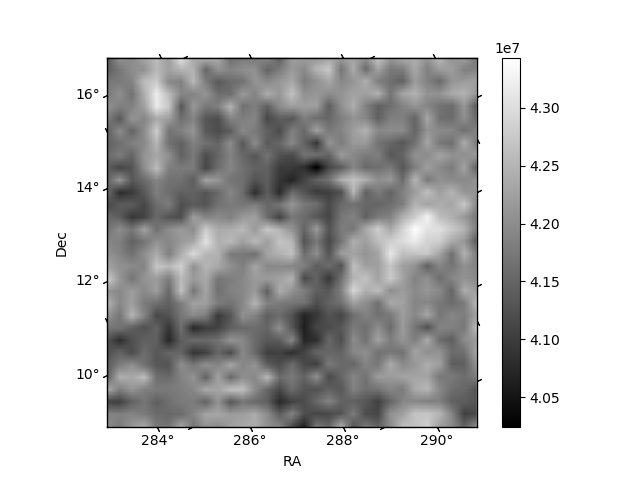
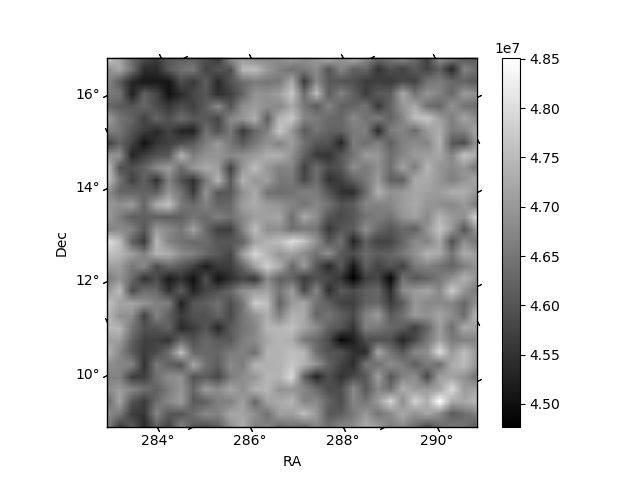
Histogram calculated using DETX and DETY for each event in the final _common_clean file
| Quadrant A | 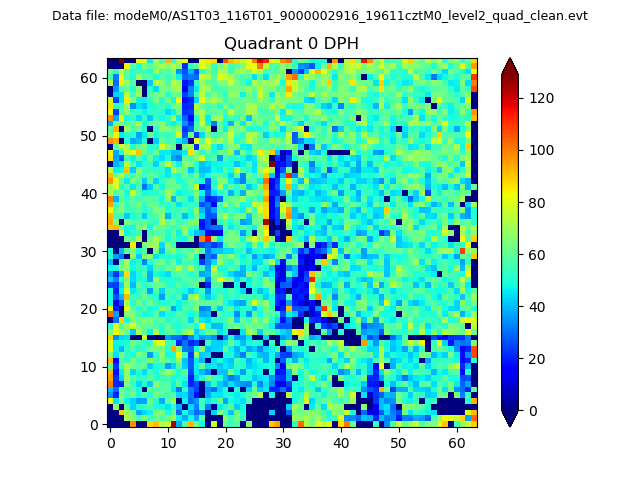 |
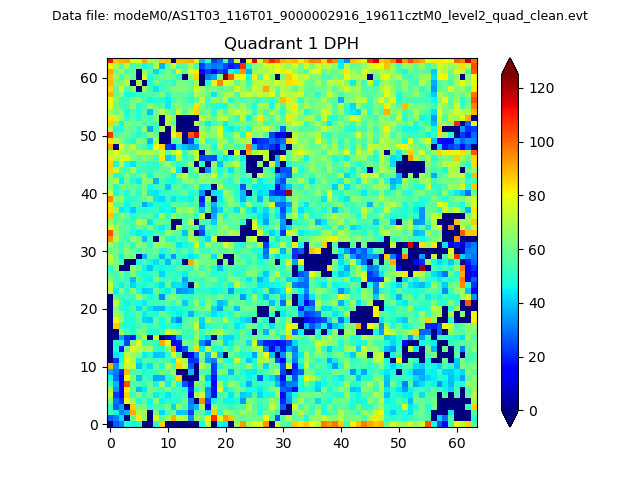 |
Quadrant B |
|---|---|---|---|
| Quadrant D | 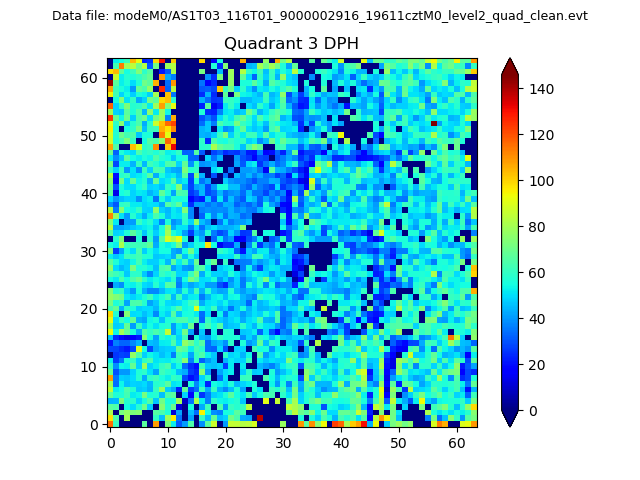 |
 |
Quadrant C |
| Plot type | Count rate plots | Images |
|---|---|---|
| Comparison with Poisson distribution Blue bars denote a histogram of data divided into 1 sec bins. Red curve is a Poisson curve with rate = median count rate of data. |
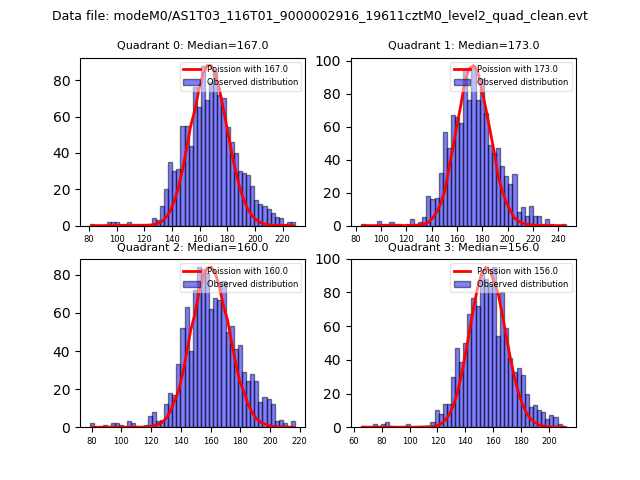 |
 |
| Quadrant-wise count rates Data is divided into 100 sec bins |
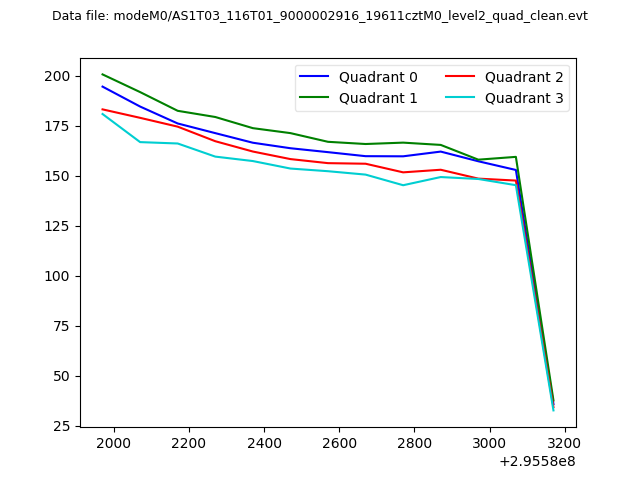 |
|
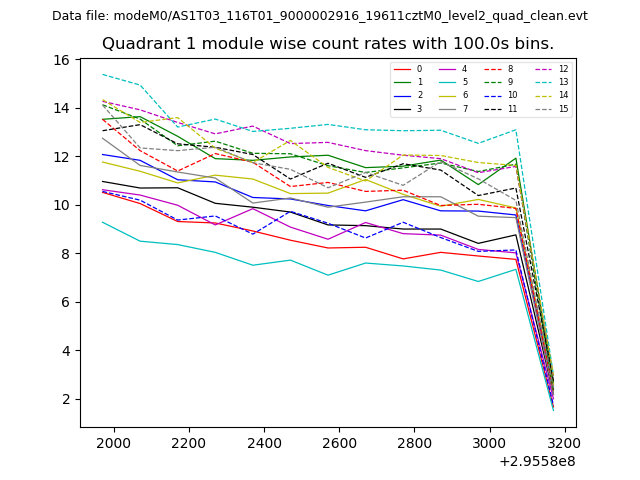
| Module-wise count rates for Quadrant A Data is divided into 100 sec bins |
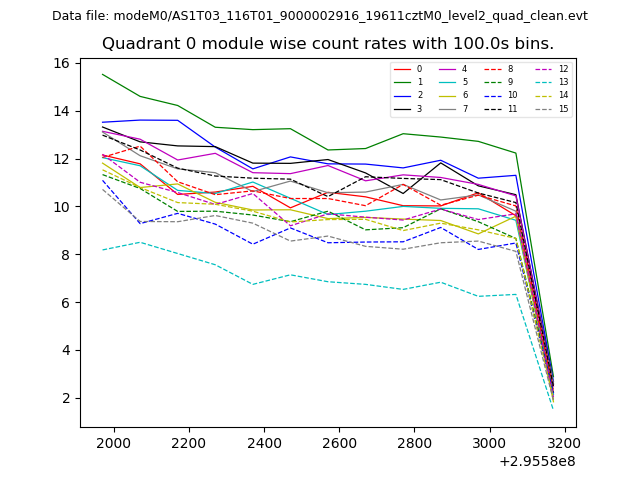 |
 |
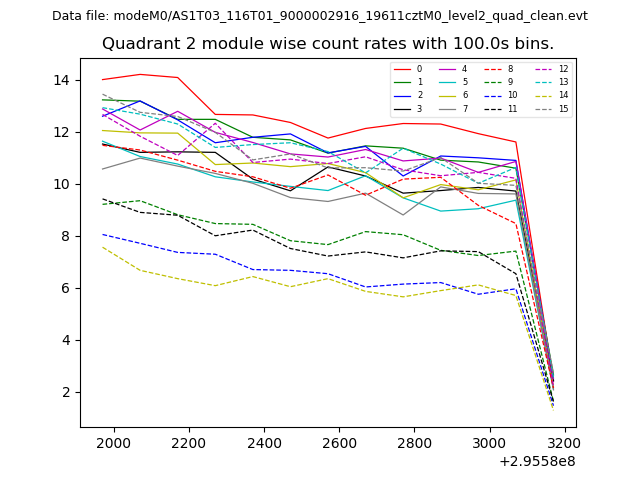
| Module-wise count rates for Quadrant B Data is divided into 100 sec bins |
 |
 |
| Module-wise count rates for Quadrant C Data is divided into 100 sec bins |
 |
 |
| Module-wise count rates for Quadrant D Data is divided into 100 sec bins |
 |
 |
| Parameter | Plot |
|---|---|
| CZT HV Monitor | 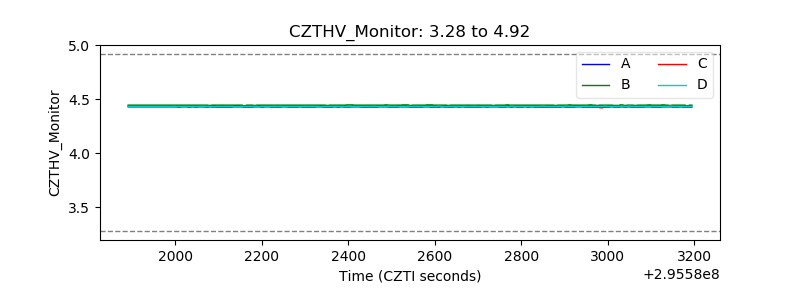 |
| D_VDD |  |
| Temperature 1 | 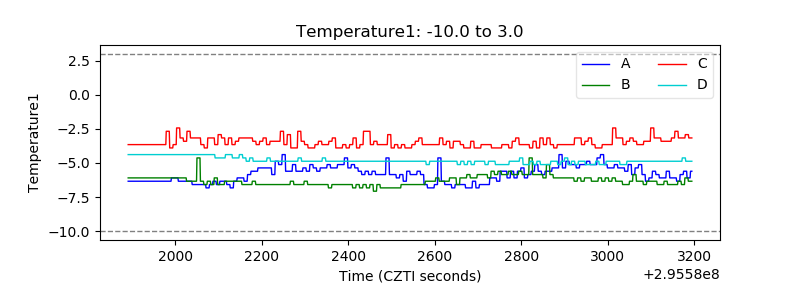 |
| Veto HV Monitor | 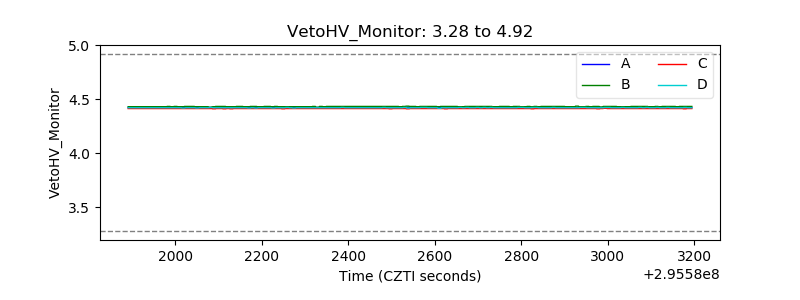 |
| Veto LLD | 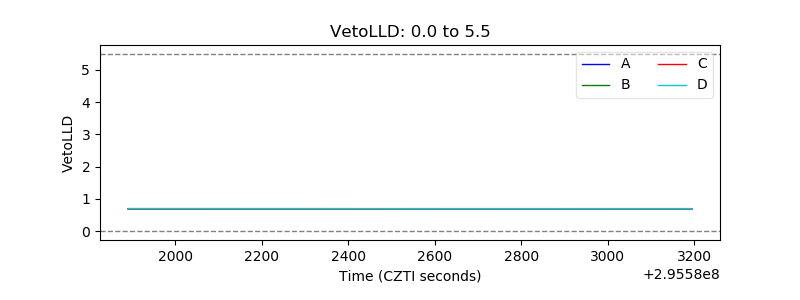 |
| Alpha Counter | 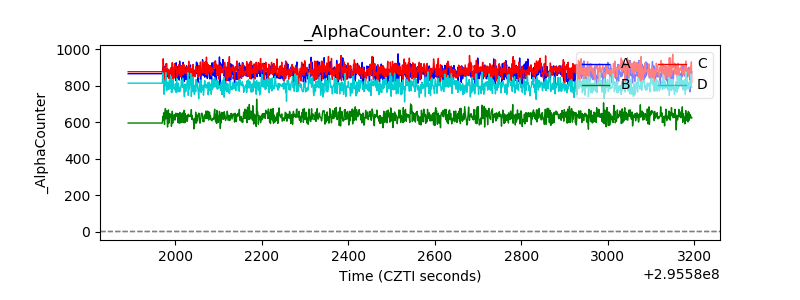 |
| _CPM_Rate | 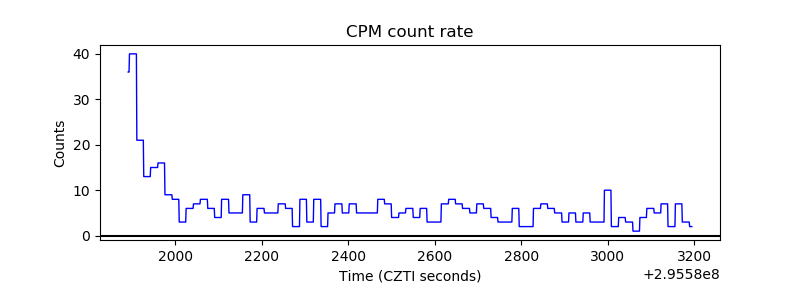 |
| CZT Counter | 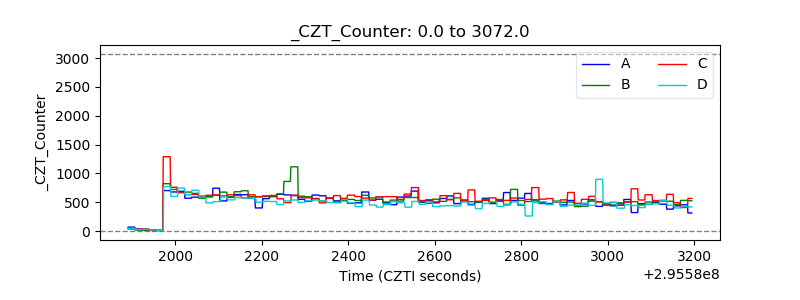 |
| +2.5 Volts monitor |  |
| +5 Volts monitor |  |
| _ROLL_ROT | 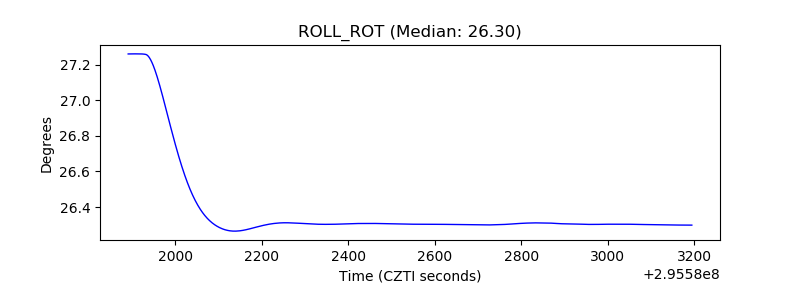 |
| _Roll_DEC | 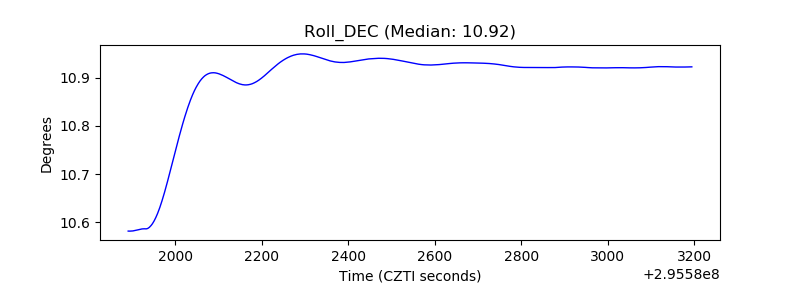 |
| _Roll_RA | 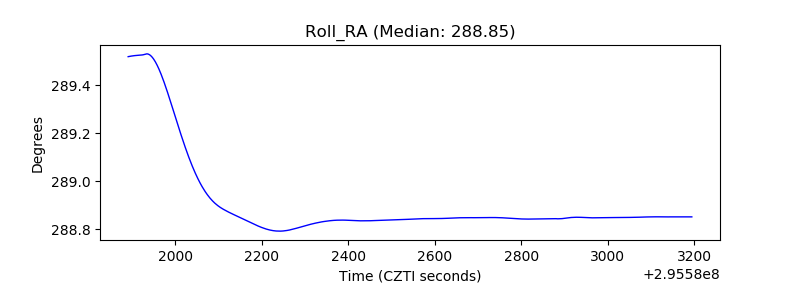 |
| Veto Counter | 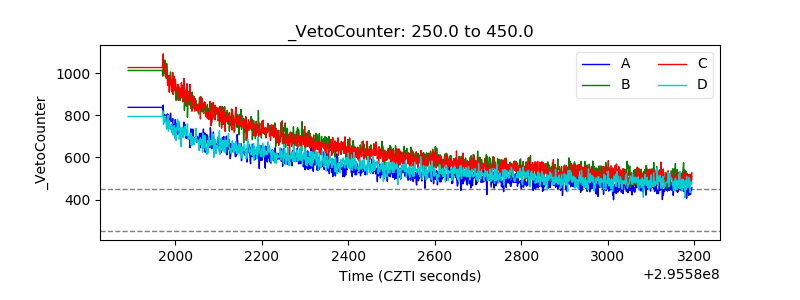 |