| Param | Original file | Final file |
|---|---|---|
| Filename | modeM0/AS1T03_116T01_9000002916_19612cztM0_level2.evt | modeM0/AS1T03_116T01_9000002916_19612cztM0_level2_quad_clean.evt |
| Size (bytes) | 479,424,960 | 103,357,440 |
| Size | 457.2 MB | 98.6 MB |
| Events in quadrant A | 3,372,573 | 683,963 |
| Events in quadrant B | 3,466,508 | 700,029 |
| Events in quadrant C | 3,630,039 | 654,626 |
| Events in quadrant D | 3,607,352 | 636,577 |
| Mode SS | |||
|---|---|---|---|
| Quadrant | BADHDUFLAG | Total packets | Discarded packets |
| A | 0 | 132 | 0 |
| B | 0 | 132 | 0 |
| C | 0 | 132 | 0 |
| D | 0 | 132 | 0 |
| Mode M0 | |||
|---|---|---|---|
| Quadrant | BADHDUFLAG | Total packets | Discarded packets |
| A | 0 | 13900 | 2 |
| B | 0 | 14191 | 2 |
| C | 0 | 14731 | 2 |
| D | 0 | 14864 | 2 |
| Mode M9 | |||
|---|---|---|---|
| Quadrant | BADHDUFLAG | Total packets | Discarded packets |
| A | 0 | 15 | 0 |
| B | 0 | 15 | 0 |
| C | 0 | 15 | 0 |
| D | 0 | 15 | 0 |
| Quadrant | Total seconds | Saturated seconds | Saturation percentage |
|---|---|---|---|
| A | 6526 | 38 | 0.582286% |
| B | 6526 | 63 | 0.965369% |
| C | 6526 | 108 | 1.654919% |
| D | 6526 | 47 | 0.720196% |
Noise dominated data is calculated using 1-second bins in cleaned event files. If a bin has >2000 counts, and if more than 50% of those come from <1% of pixels, then it is considered to be noise-dominated and hence unusable.
| Quadrant | # 1 sec bins | Bins with >0 counts | Bins with >2000 counts | High rate bins dominated by noise | Noise dominated (total time) | Noise dominated (detector-on time) | Marked lightcurve |
|---|---|---|---|---|---|---|---|
| A | 7846 | 6527 | 1 | 1 | 0.01% | 0.02% | 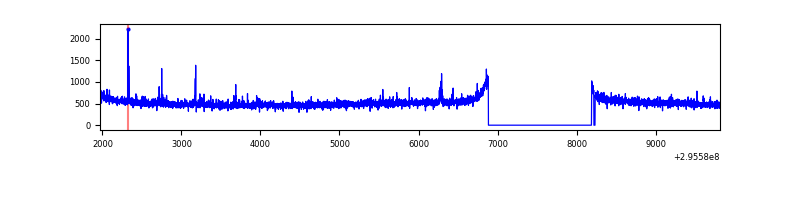 |
| B | 7846 | 6527 | 3 | 3 | 0.04% | 0.05% | 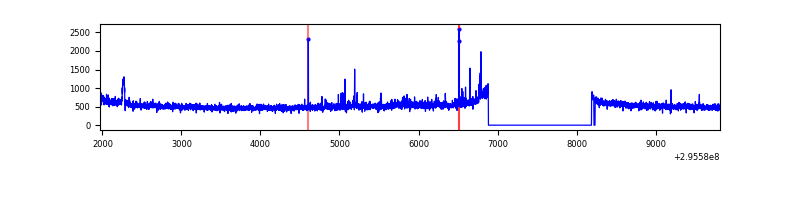 |
| C | 7846 | 6527 | 32 | 32 | 0.41% | 0.49% | 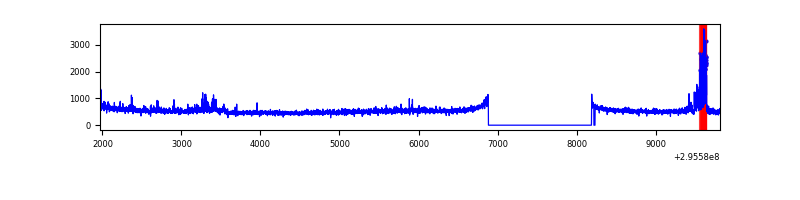 |
| D | 7846 | 6527 | 31 | 31 | 0.40% | 0.47% | 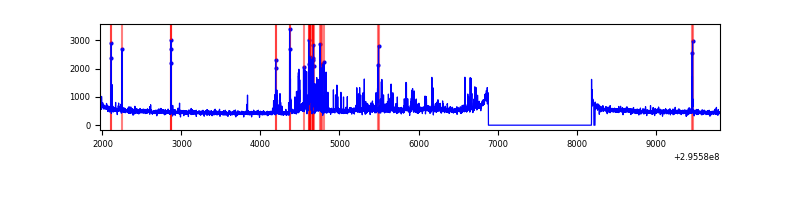 |
Top three noisy pixels from each quadrant. If the there are fewer than three noisy pixels in the level2.evt file, extra rows are filled as -1
| Pixel properties | Quadrant properties | ||||||
|---|---|---|---|---|---|---|---|
| Quadrant | DetID | PixID | Counts | Sigma | Mean | Median | Sigma |
| A | 9 | 143 | 48670 | 279.63 | 861 | 849 | 171.0 |
| A | 11 | 29 | 11576 | 62.73 | 861 | 849 | 171.0 |
| A | 0 | 226 | 7426 | 38.46 | 861 | 849 | 171.0 |
| B | 7 | 220 | 32366 | 194.99 | 861 | 843 | 161.7 |
| B | 4 | 216 | 22540 | 134.21 | 861 | 843 | 161.7 |
| B | 12 | 0 | 20087 | 119.04 | 861 | 843 | 161.7 |
| C | 3 | 233 | 301406 | 1576.09 | 818 | 828 | 190.7 |
| C | 14 | 238 | 130460 | 679.73 | 818 | 828 | 190.7 |
| C | 9 | 221 | 8280 | 39.07 | 818 | 828 | 190.7 |
| D | 7 | 238 | 365559 | 1810.72 | 827 | 805 | 201.4 |
| D | 1 | 52 | 81877 | 402.46 | 827 | 805 | 201.4 |
| D | 2 | 234 | 23699 | 113.65 | 827 | 805 | 201.4 |
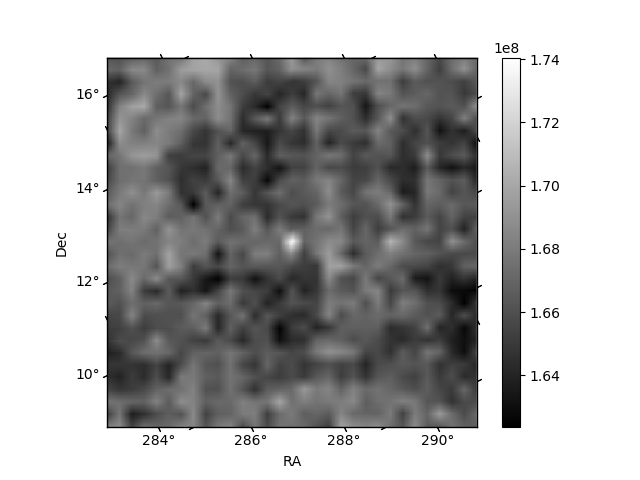
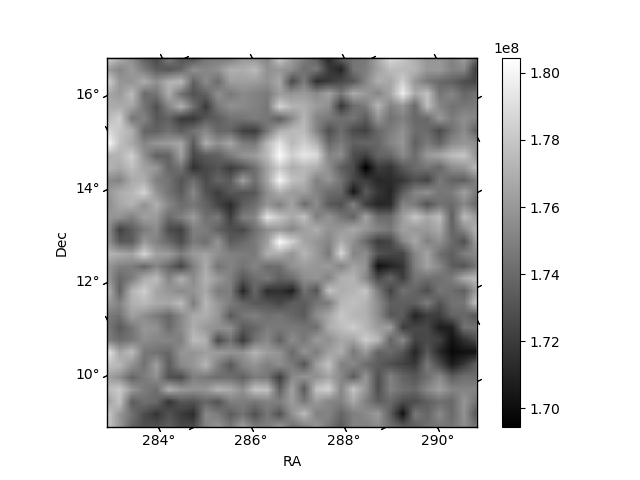
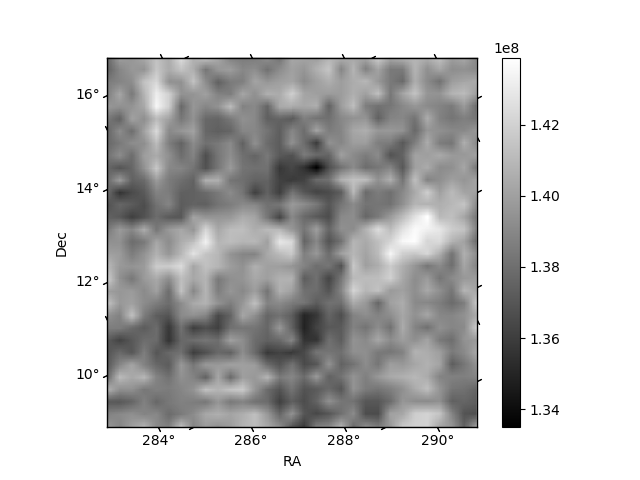
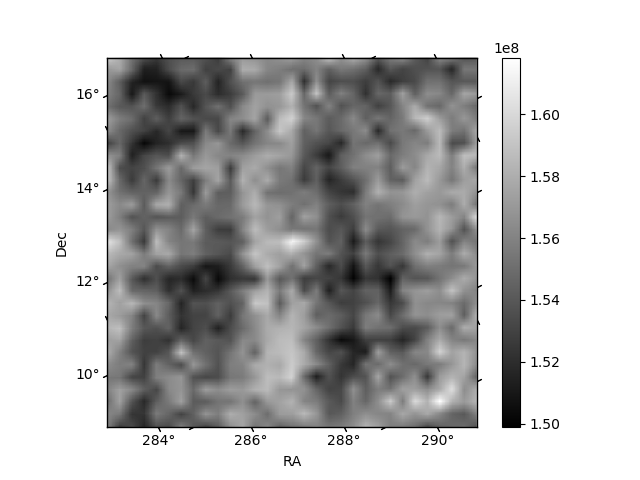
Histogram calculated using DETX and DETY for each event in the final _common_clean file
| Quadrant A | 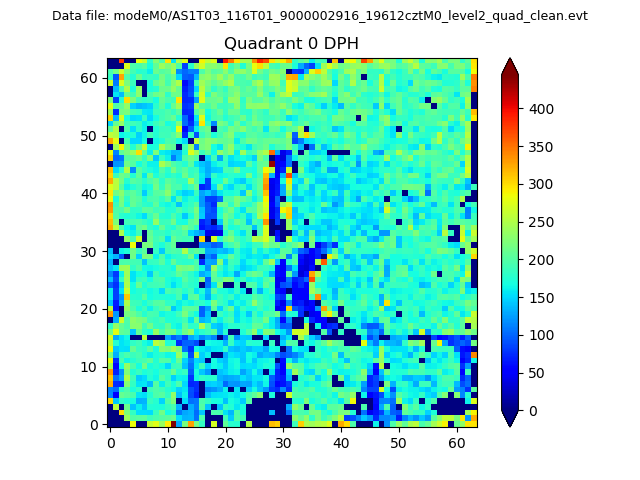 |
 |
Quadrant B |
|---|---|---|---|
| Quadrant D |  |
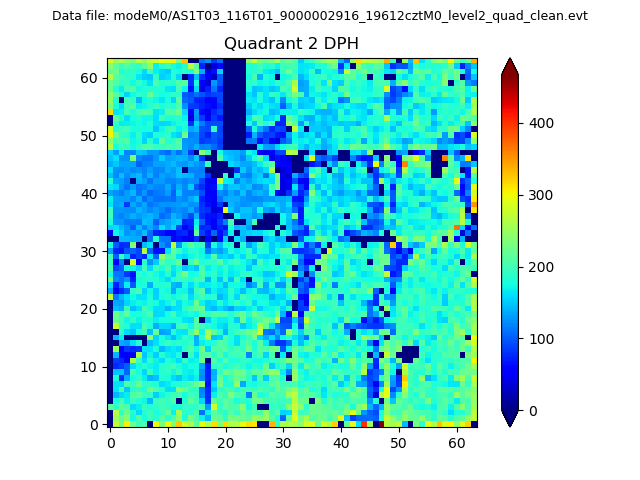 |
Quadrant C |
| Plot type | Count rate plots | Images |
|---|---|---|
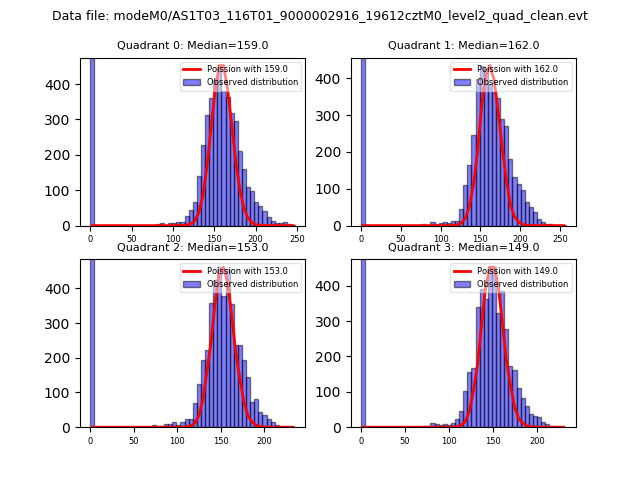
| Comparison with Poisson distribution Blue bars denote a histogram of data divided into 1 sec bins. Red curve is a Poisson curve with rate = median count rate of data. |
 |
 |
| Quadrant-wise count rates Data is divided into 100 sec bins |
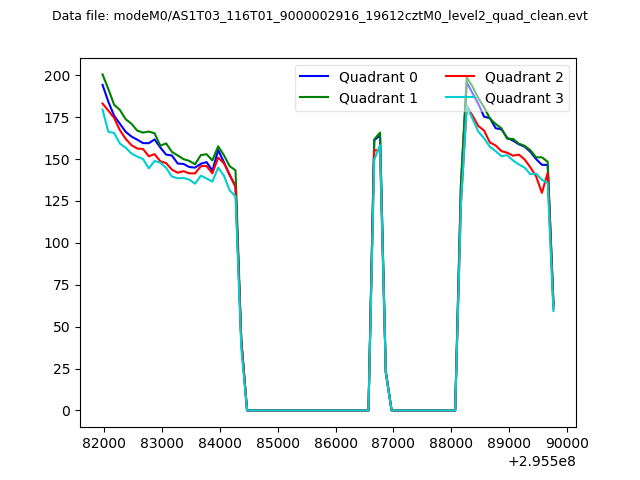 |
|
| Module-wise count rates for Quadrant A Data is divided into 100 sec bins |
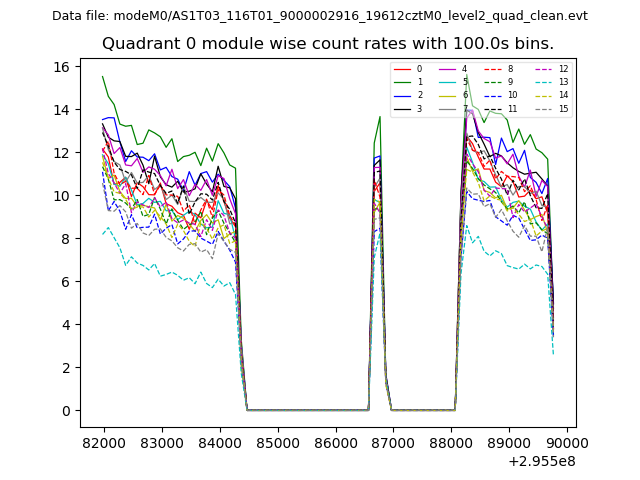 |
 |
| Module-wise count rates for Quadrant B Data is divided into 100 sec bins |
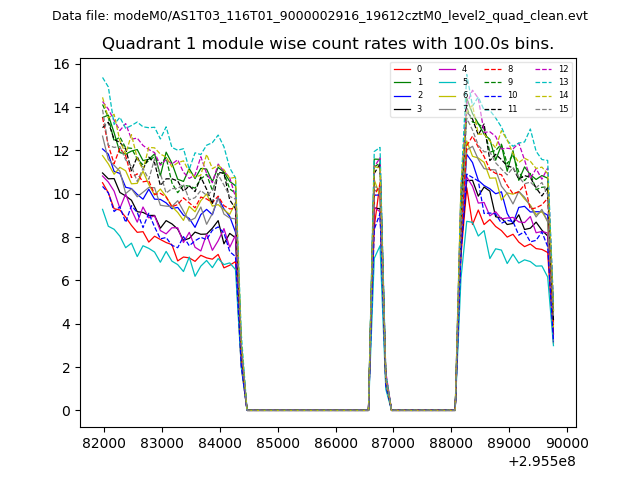 |
 |
| Module-wise count rates for Quadrant C Data is divided into 100 sec bins |
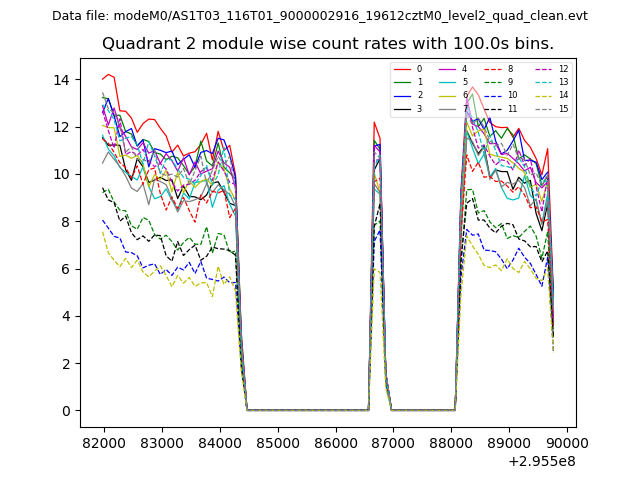 |
 |
| Module-wise count rates for Quadrant D Data is divided into 100 sec bins |
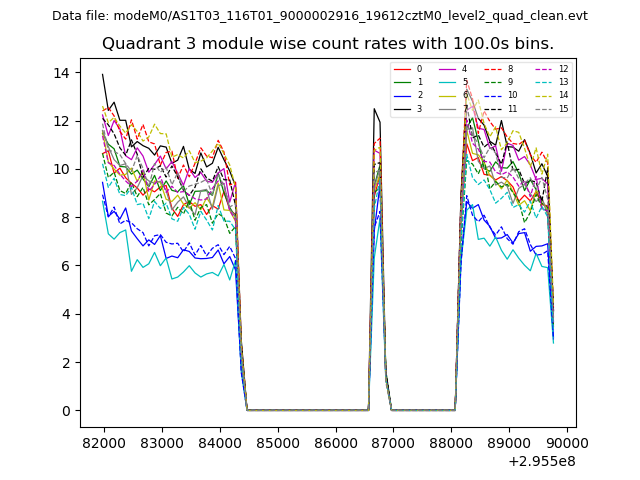 |
 |
| Parameter | Plot |
|---|---|
| CZT HV Monitor | 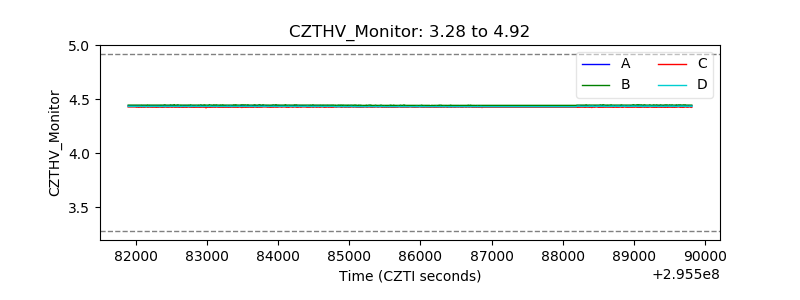 |
| D_VDD |  |
| Temperature 1 |  |
| Veto HV Monitor | 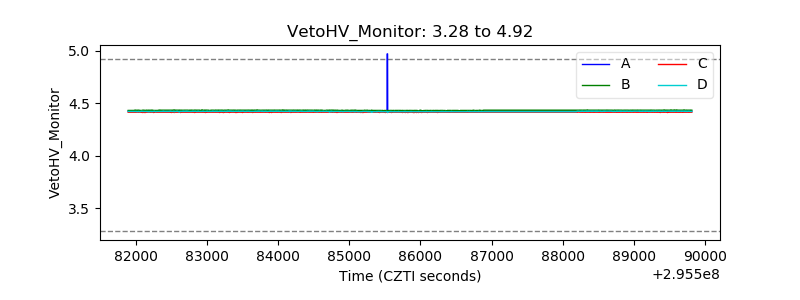 |
| Veto LLD | 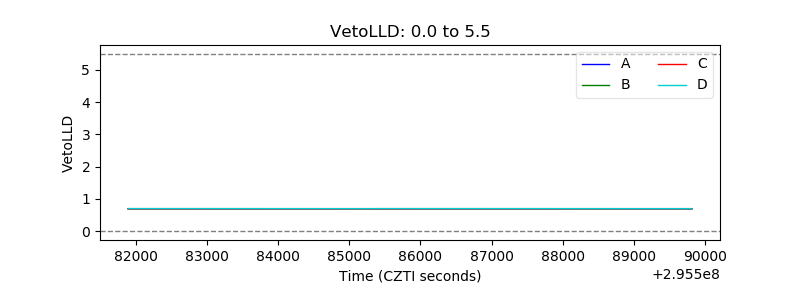 |
| Alpha Counter | 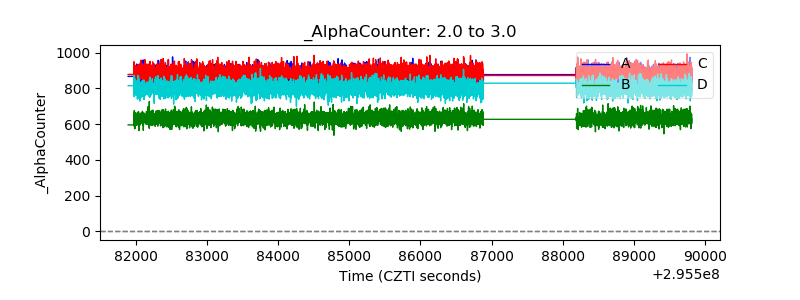 |
| _CPM_Rate | 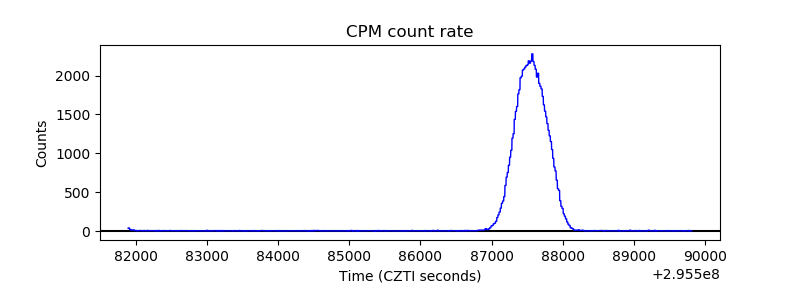 |
| CZT Counter | 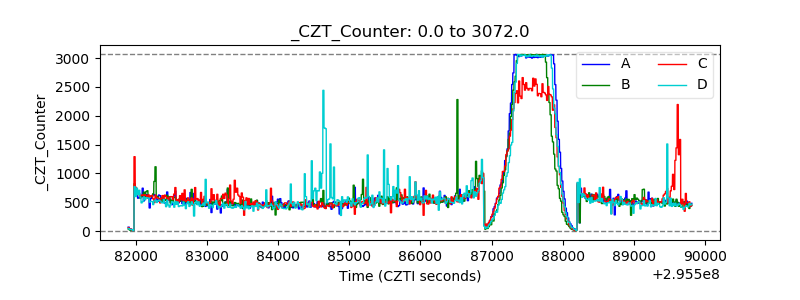 |
| +2.5 Volts monitor |  |
| +5 Volts monitor |  |
| _ROLL_ROT | 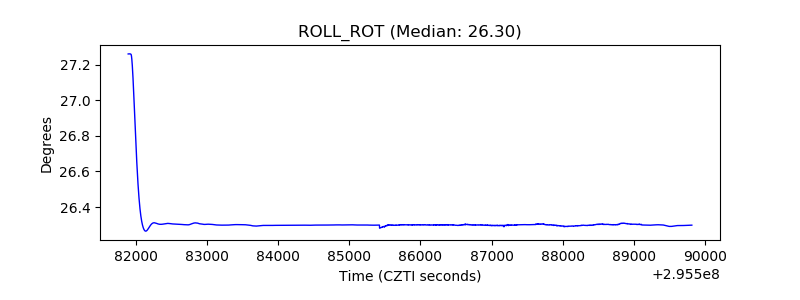 |
| _Roll_DEC | 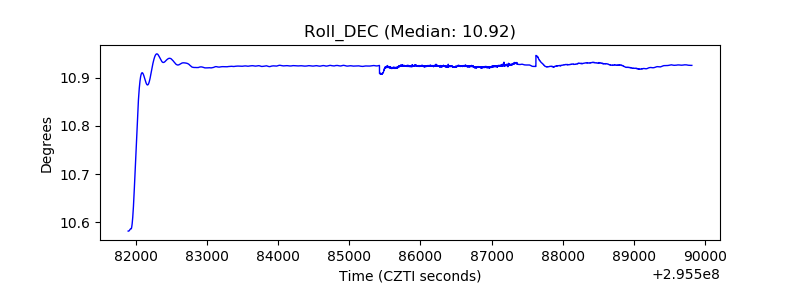 |
| _Roll_RA | 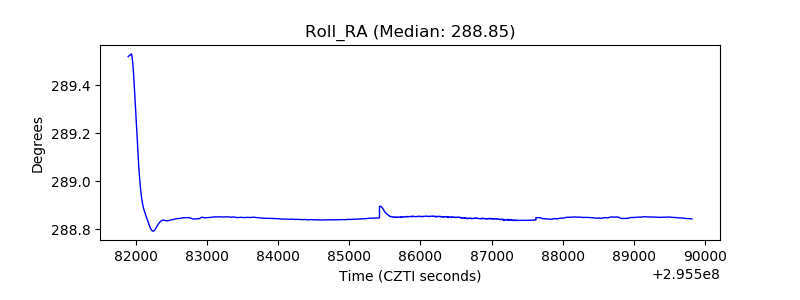 |
| Veto Counter | 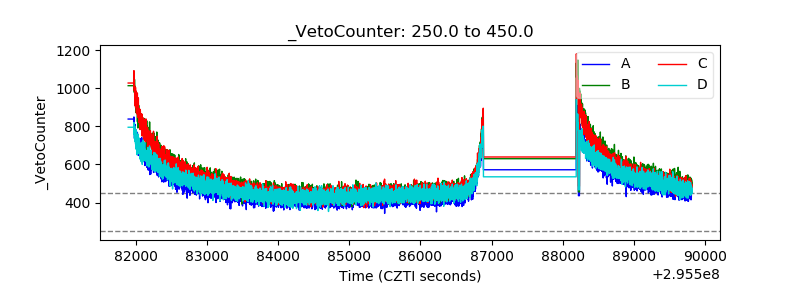 |