| Param | Original file | Final file |
|---|---|---|
| Filename | modeM0/AS1T03_116T01_9000002916_19614cztM0_level2.evt | modeM0/AS1T03_116T01_9000002916_19614cztM0_level2_quad_clean.evt |
| Size (bytes) | 486,662,400 | 80,470,080 |
| Size | 464.1 MB | 76.7 MB |
| Events in quadrant A | 3,070,009 | 519,353 |
| Events in quadrant B | 3,190,406 | 526,922 |
| Events in quadrant C | 3,222,741 | 494,958 |
| Events in quadrant D | 4,849,041 | 476,978 |
| Mode SS | |||
|---|---|---|---|
| Quadrant | BADHDUFLAG | Total packets | Discarded packets |
| A | 0 | 122 | 0 |
| B | 0 | 122 | 0 |
| C | 0 | 122 | 0 |
| D | 0 | 122 | 0 |
| Mode M0 | |||
|---|---|---|---|
| Quadrant | BADHDUFLAG | Total packets | Discarded packets |
| A | 0 | 12549 | 1 |
| B | 0 | 12936 | 2 |
| C | 0 | 13139 | 1 |
| D | 0 | 18373 | 1 |
| Mode M9 | |||
|---|---|---|---|
| Quadrant | BADHDUFLAG | Total packets | Discarded packets |
| A | 0 | 12 | 0 |
| B | 0 | 12 | 0 |
| C | 0 | 12 | 0 |
| D | 0 | 12 | 0 |
| Quadrant | Total seconds | Saturated seconds | Saturation percentage |
|---|---|---|---|
| A | 5990 | 93 | 1.552588% |
| B | 5989 | 130 | 2.170646% |
| C | 5989 | 159 | 2.654867% |
| D | 5989 | 275 | 4.591752% |
Noise dominated data is calculated using 1-second bins in cleaned event files. If a bin has >2000 counts, and if more than 50% of those come from <1% of pixels, then it is considered to be noise-dominated and hence unusable.
| Quadrant | # 1 sec bins | Bins with >0 counts | Bins with >2000 counts | High rate bins dominated by noise | Noise dominated (total time) | Noise dominated (detector-on time) | Marked lightcurve |
|---|---|---|---|---|---|---|---|
| A | 7180 | 5991 | 3 | 3 | 0.04% | 0.05% | 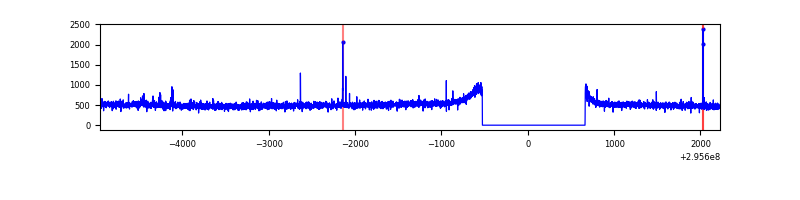 |
| B | 7179 | 5990 | 19 | 19 | 0.26% | 0.32% | 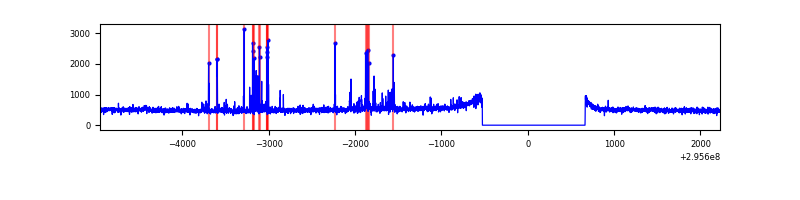 |
| C | 7179 | 5990 | 26 | 26 | 0.36% | 0.43% | 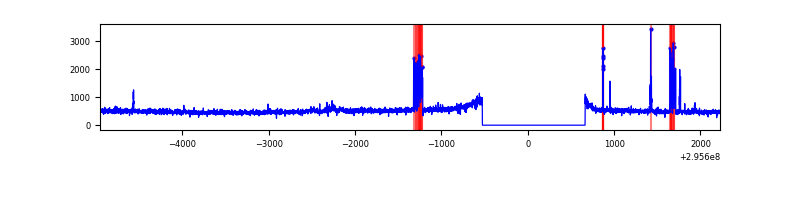 |
| D | 7179 | 5989 | 111 | 111 | 1.55% | 1.85% | 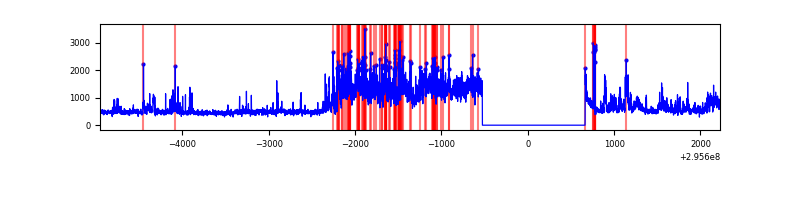 |
Top three noisy pixels from each quadrant. If the there are fewer than three noisy pixels in the level2.evt file, extra rows are filled as -1
| Pixel properties | Quadrant properties | ||||||
|---|---|---|---|---|---|---|---|
| Quadrant | DetID | PixID | Counts | Sigma | Mean | Median | Sigma |
| A | 9 | 143 | 25188 | 154.25 | 786 | 773 | 158.3 |
| A | 5 | 16 | 8596 | 49.42 | 786 | 773 | 158.3 |
| A | 11 | 29 | 7357 | 41.6 | 786 | 773 | 158.3 |
| B | 7 | 220 | 72141 | 484.24 | 773 | 754 | 147.4 |
| B | 0 | 197 | 33178 | 219.94 | 773 | 754 | 147.4 |
| B | 10 | 247 | 23439 | 153.88 | 773 | 754 | 147.4 |
| C | 9 | 15 | 168633 | 976.43 | 736 | 742 | 171.9 |
| C | 14 | 238 | 117813 | 680.87 | 736 | 742 | 171.9 |
| C | 3 | 233 | 55348 | 317.58 | 736 | 742 | 171.9 |
| D | 7 | 238 | 1968208 | 10753.63 | 747 | 728 | 183.0 |
| D | 7 | 96 | 54692 | 294.95 | 747 | 728 | 183.0 |
| D | 2 | 234 | 21913 | 115.79 | 747 | 728 | 183.0 |
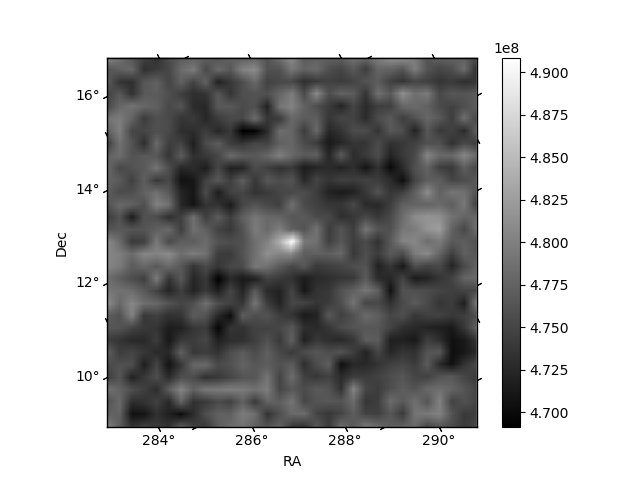
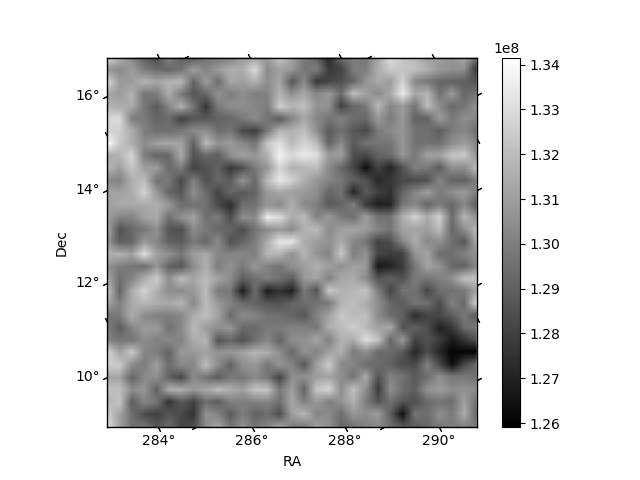
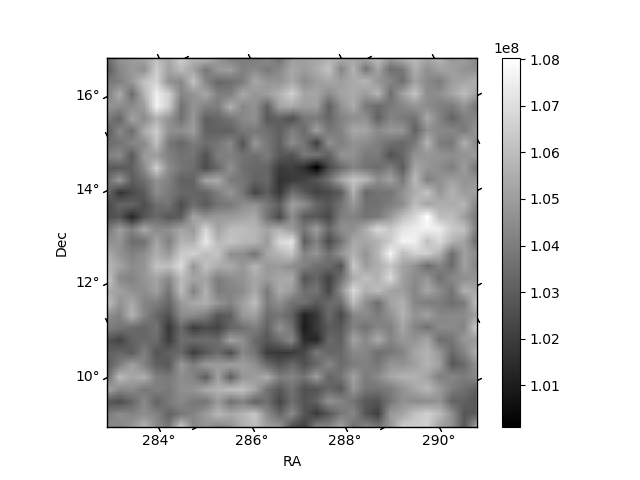
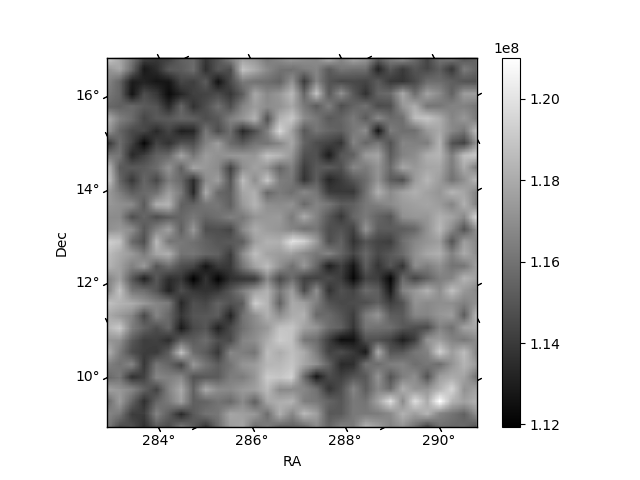
Histogram calculated using DETX and DETY for each event in the final _common_clean file
| Quadrant A | 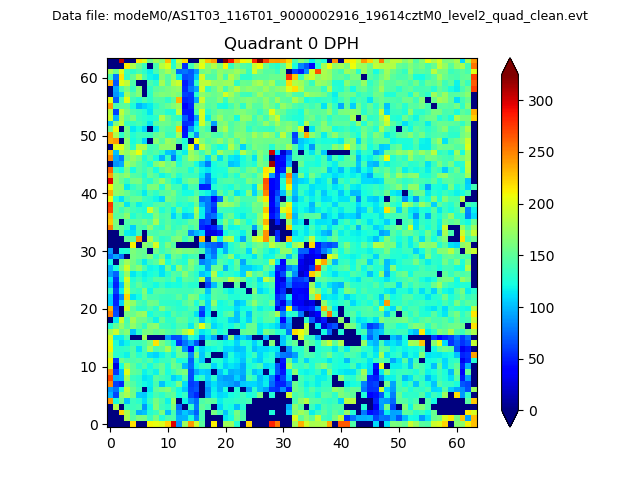 |
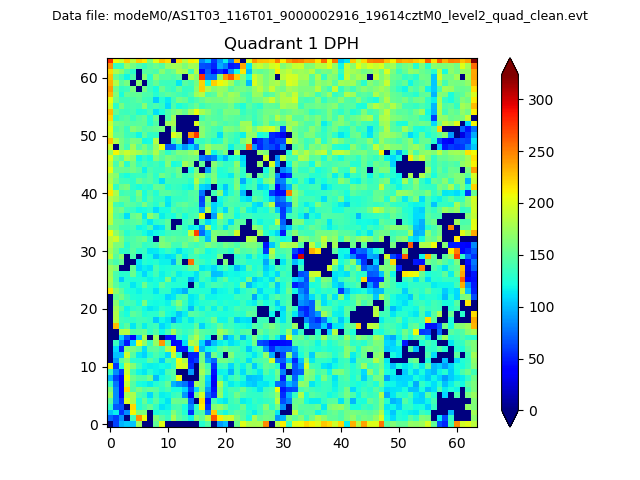 |
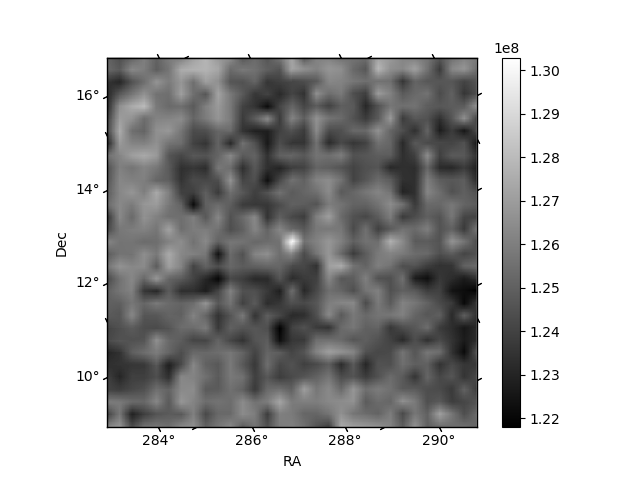
Quadrant B |
|---|---|---|---|
| Quadrant D | 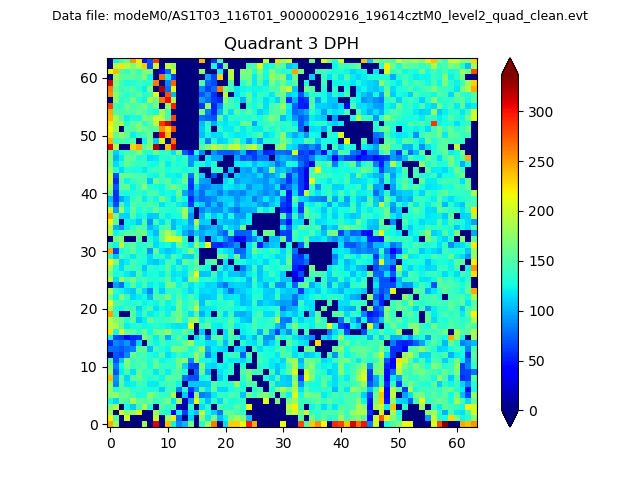 |
 |
Quadrant C |
| Plot type | Count rate plots | Images |
|---|---|---|
| Comparison with Poisson distribution Blue bars denote a histogram of data divided into 1 sec bins. Red curve is a Poisson curve with rate = median count rate of data. |
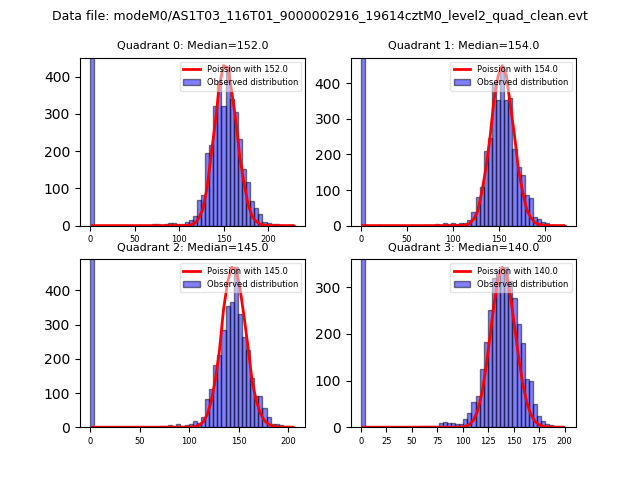 |
 |
| Quadrant-wise count rates Data is divided into 100 sec bins |
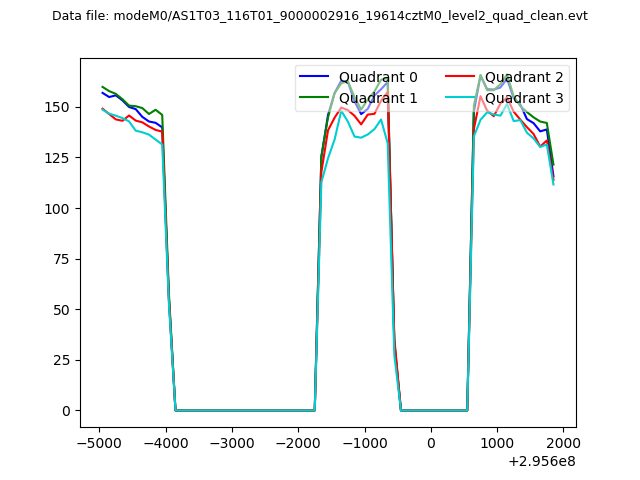 |
|
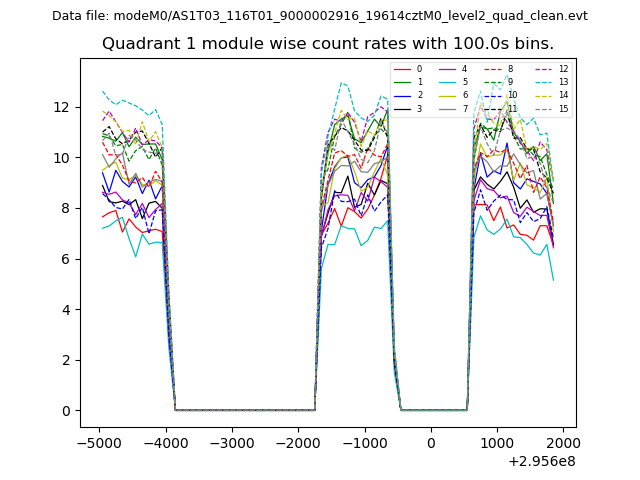
| Module-wise count rates for Quadrant A Data is divided into 100 sec bins |
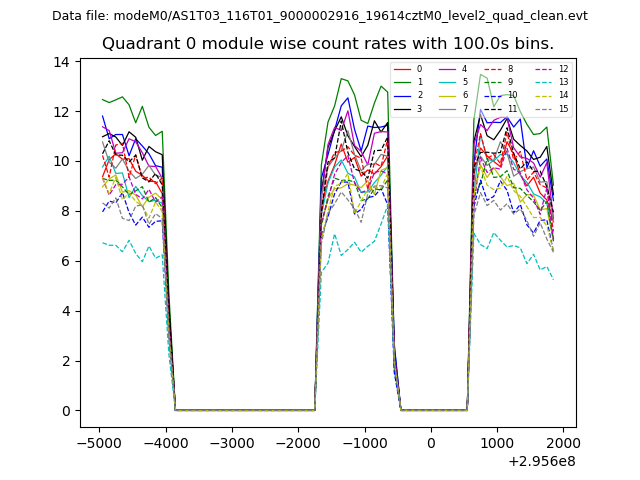 |
 |
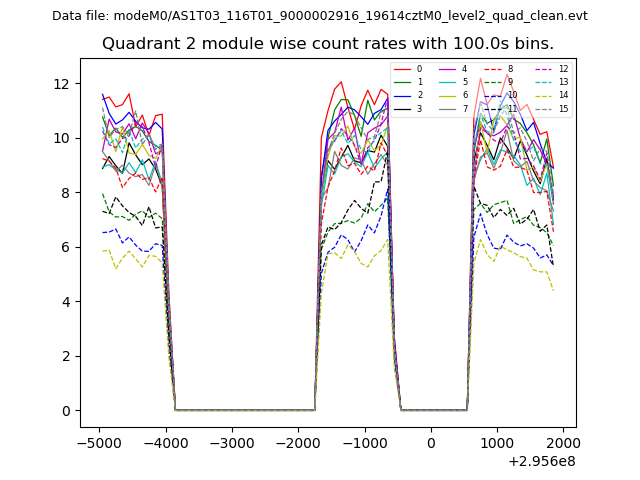
| Module-wise count rates for Quadrant B Data is divided into 100 sec bins |
 |
 |
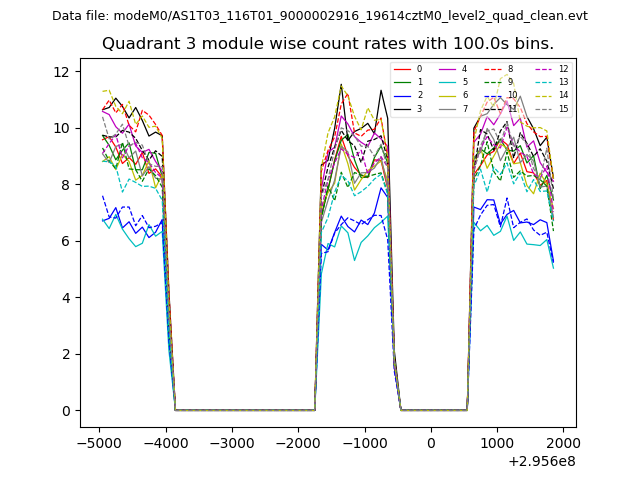
| Module-wise count rates for Quadrant C Data is divided into 100 sec bins |
 |
 |
| Module-wise count rates for Quadrant D Data is divided into 100 sec bins |
 |
 |
| Parameter | Plot |
|---|---|
| CZT HV Monitor | 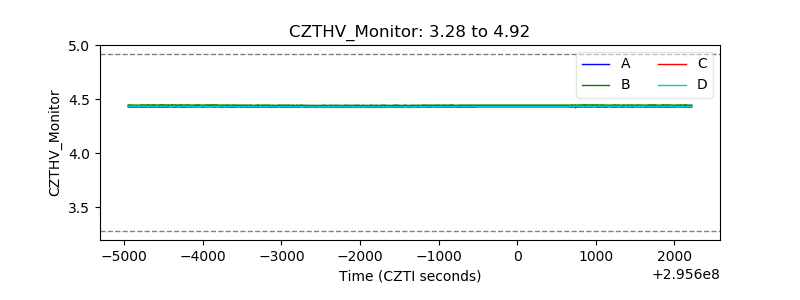 |
| D_VDD | 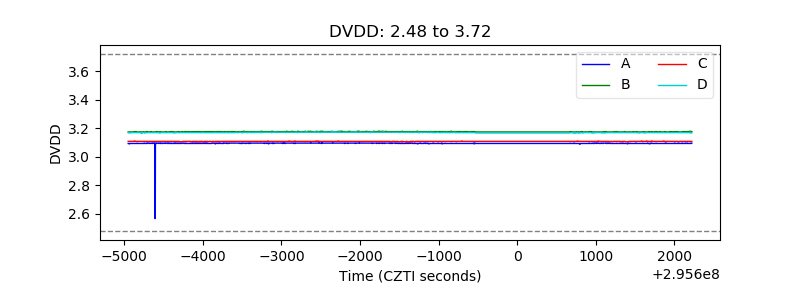 |
| Temperature 1 |  |
| Veto HV Monitor | 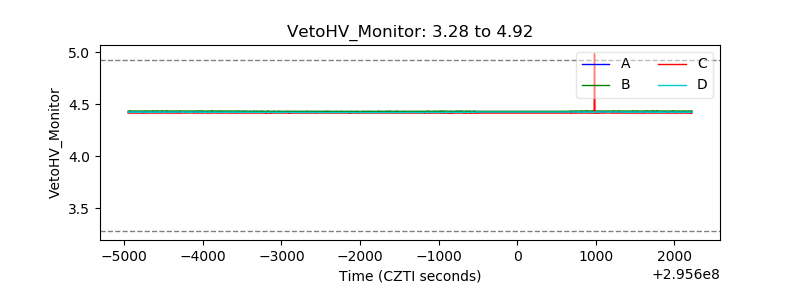 |
| Veto LLD | 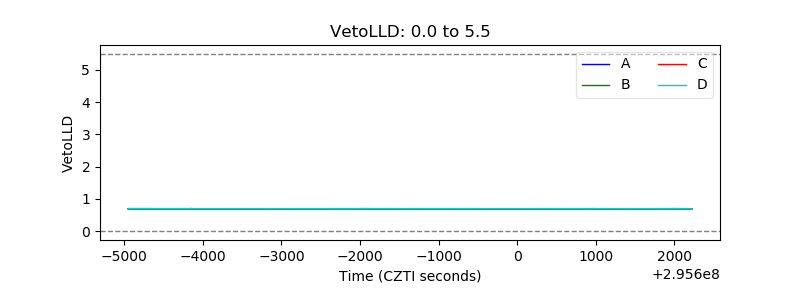 |
| Alpha Counter | 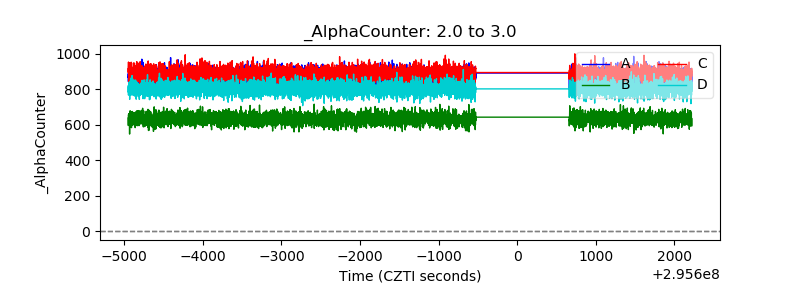 |
| _CPM_Rate | 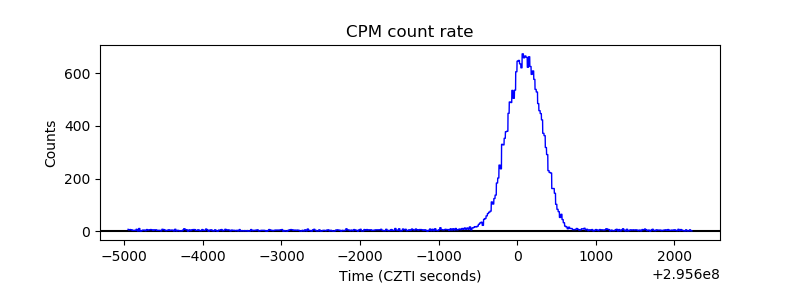 |
| CZT Counter | 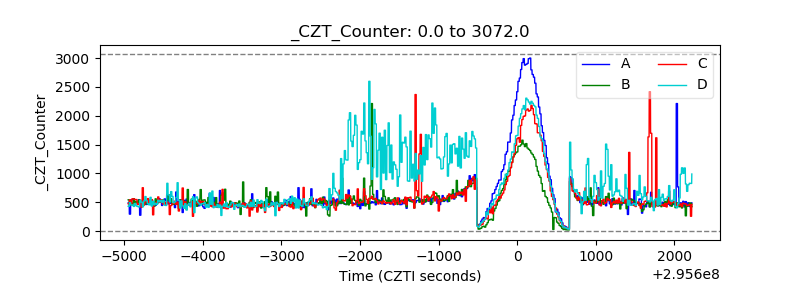 |
| +2.5 Volts monitor |  |
| +5 Volts monitor | 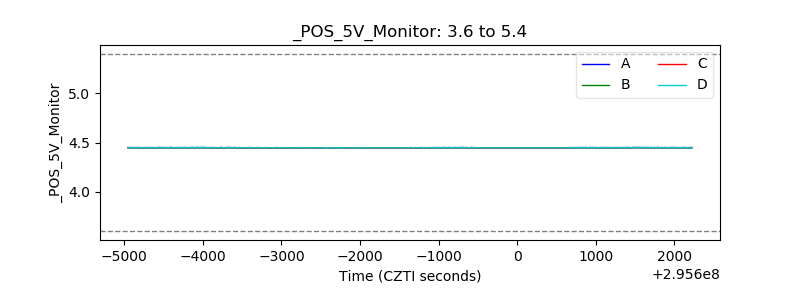 |
| _ROLL_ROT | 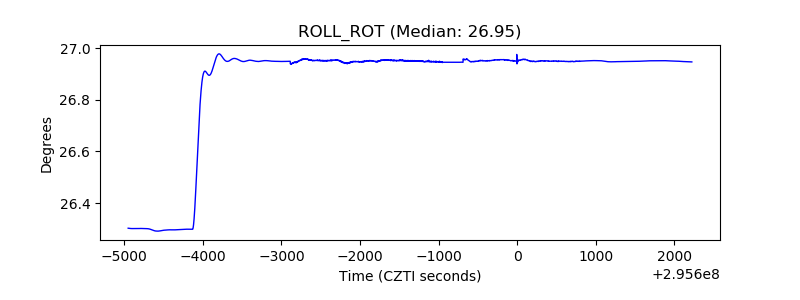 |
| _Roll_DEC | 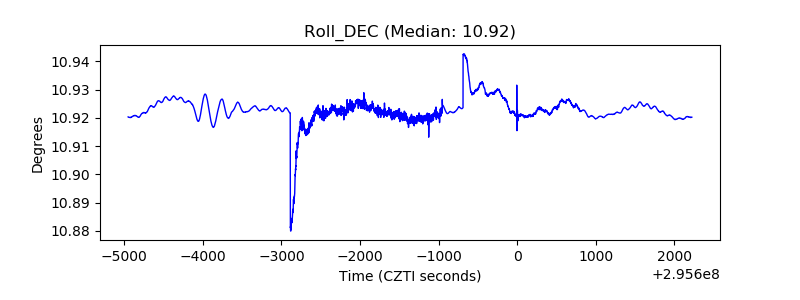 |
| _Roll_RA | 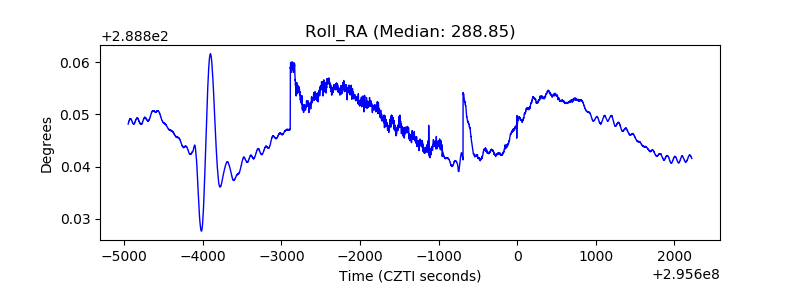 |
| Veto Counter | 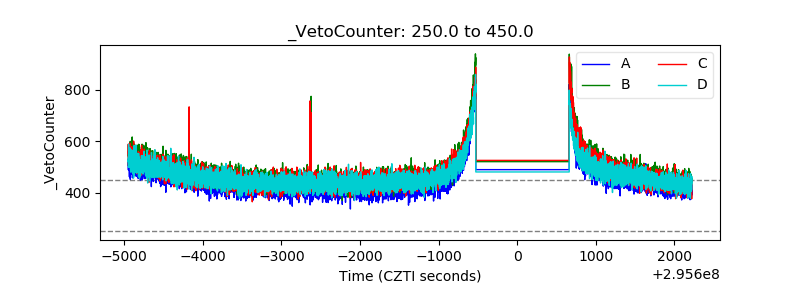 |