| Param | Original file | Final file |
|---|---|---|
| Filename | modeM0/AS1T03_116T01_9000002916_19616cztM0_level2.evt | modeM0/AS1T03_116T01_9000002916_19616cztM0_level2_quad_clean.evt |
| Size (bytes) | 526,374,720 | 75,447,360 |
| Size | 502.0 MB | 72.0 MB |
| Events in quadrant A | 3,364,748 | 461,725 |
| Events in quadrant B | 3,521,897 | 466,495 |
| Events in quadrant C | 3,301,674 | 447,795 |
| Events in quadrant D | 5,288,512 | 431,333 |
| Mode SS | |||
|---|---|---|---|
| Quadrant | BADHDUFLAG | Total packets | Discarded packets |
| A | 0 | 138 | 0 |
| B | 0 | 138 | 0 |
| C | 0 | 138 | 0 |
| D | 0 | 138 | 0 |
| Mode M0 | |||
|---|---|---|---|
| Quadrant | BADHDUFLAG | Total packets | Discarded packets |
| A | 0 | 14331 | 1 |
| B | 0 | 14588 | 1 |
| C | 0 | 14069 | 1 |
| D | 0 | 20518 | 1 |
| Mode M9 | |||
|---|---|---|---|
| Quadrant | BADHDUFLAG | Total packets | Discarded packets |
| A | 0 | 5 | 0 |
| B | 0 | 5 | 0 |
| C | 0 | 5 | 0 |
| D | 0 | 5 | 0 |
| Quadrant | Total seconds | Saturated seconds | Saturation percentage |
|---|---|---|---|
| A | 6840 | 159 | 2.324561% |
| B | 6841 | 172 | 2.514252% |
| C | 6841 | 143 | 2.090338% |
| D | 6841 | 222 | 3.245140% |
Noise dominated data is calculated using 1-second bins in cleaned event files. If a bin has >2000 counts, and if more than 50% of those come from <1% of pixels, then it is considered to be noise-dominated and hence unusable.
| Quadrant | # 1 sec bins | Bins with >0 counts | Bins with >2000 counts | High rate bins dominated by noise | Noise dominated (total time) | Noise dominated (detector-on time) | Marked lightcurve |
|---|---|---|---|---|---|---|---|
| A | 7350 | 6840 | 1 | 1 | 0.01% | 0.01% | 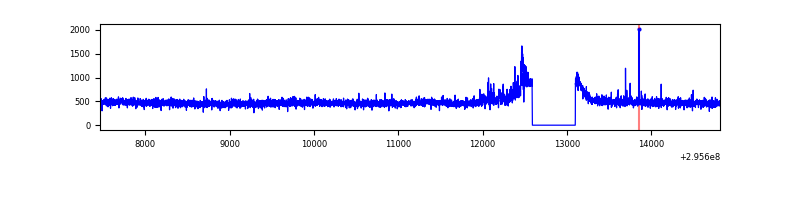 |
| B | 7351 | 6841 | 20 | 20 | 0.27% | 0.29% | 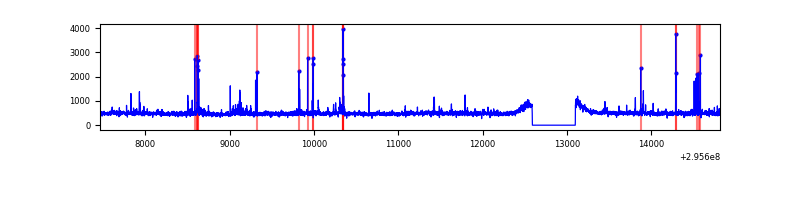 |
| C | 7351 | 6841 | 0 | 0 | 0.00% | 0.00% | 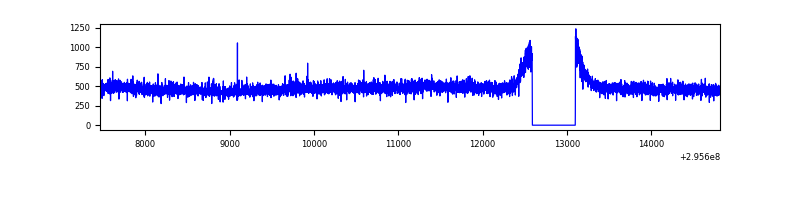 |
| D | 7351 | 6841 | 75 | 75 | 1.02% | 1.10% | 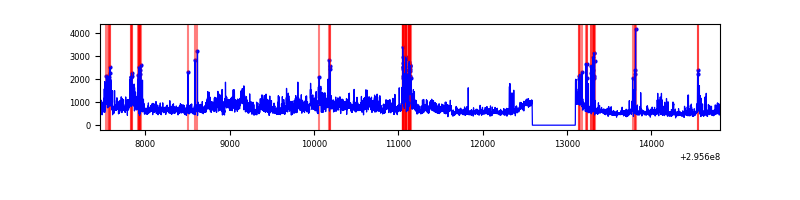 |
Top three noisy pixels from each quadrant. If the there are fewer than three noisy pixels in the level2.evt file, extra rows are filled as -1
| Pixel properties | Quadrant properties | ||||||
|---|---|---|---|---|---|---|---|
| Quadrant | DetID | PixID | Counts | Sigma | Mean | Median | Sigma |
| A | 11 | 47 | 82559 | 472.89 | 850 | 831 | 172.8 |
| A | 5 | 16 | 11158 | 59.75 | 850 | 831 | 172.8 |
| A | 0 | 226 | 7121 | 36.4 | 850 | 831 | 172.8 |
| B | 7 | 220 | 118833 | 716.44 | 842 | 820 | 164.7 |
| B | 0 | 198 | 34561 | 204.84 | 842 | 820 | 164.7 |
| B | 10 | 247 | 32075 | 189.75 | 842 | 820 | 164.7 |
| C | 14 | 238 | 123678 | 639.12 | 808 | 812 | 192.2 |
| C | 3 | 233 | 24696 | 124.24 | 808 | 812 | 192.2 |
| C | 13 | 61 | 5733 | 25.6 | 808 | 812 | 192.2 |
| D | 7 | 238 | 1853394 | 9234.56 | 818 | 795 | 200.6 |
| D | 7 | 96 | 149583 | 741.66 | 818 | 795 | 200.6 |
| D | 12 | 218 | 128466 | 636.4 | 818 | 795 | 200.6 |
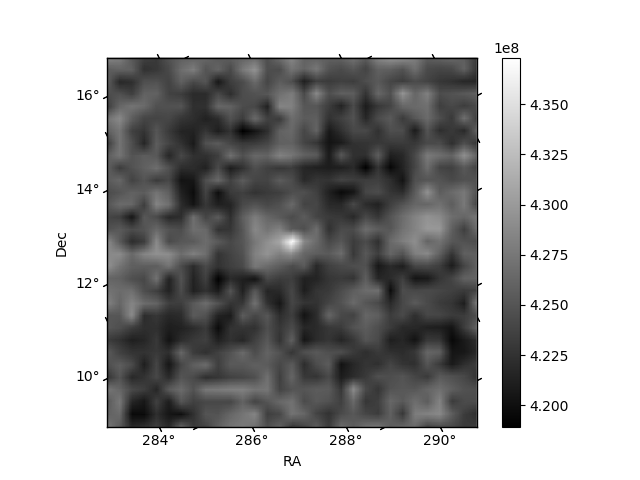
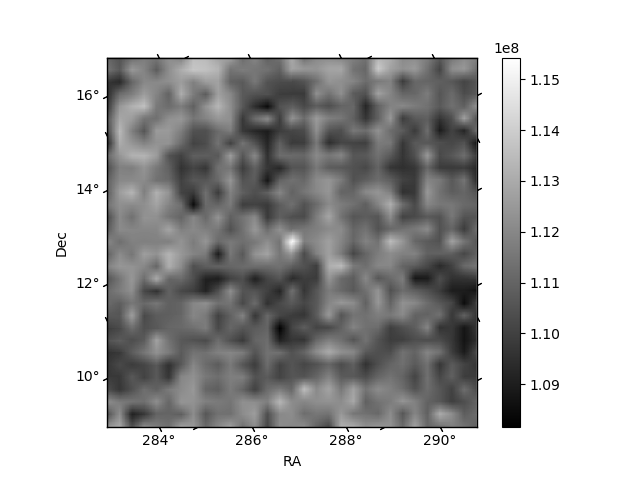
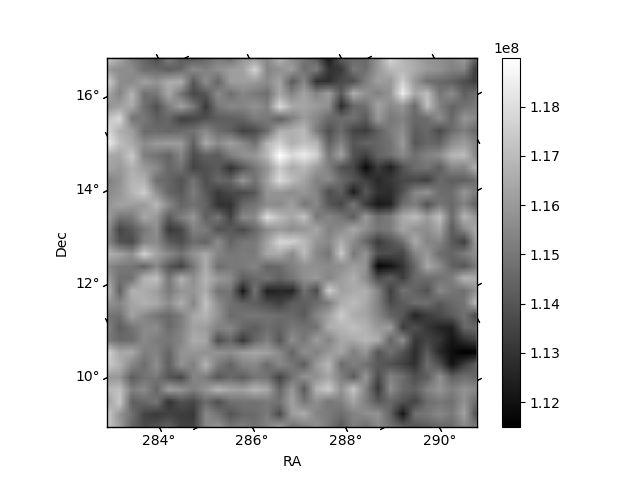
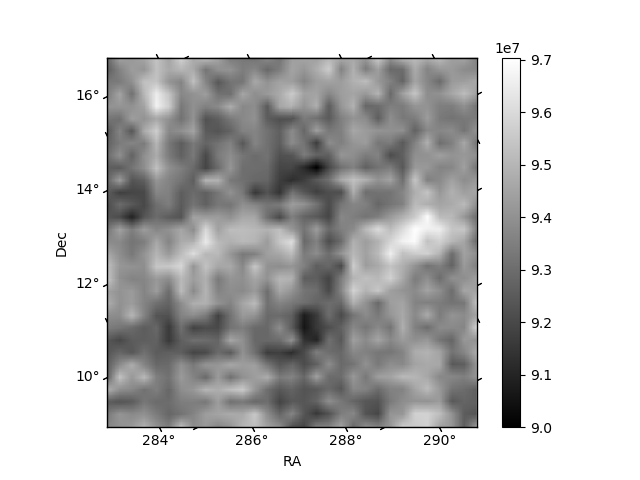
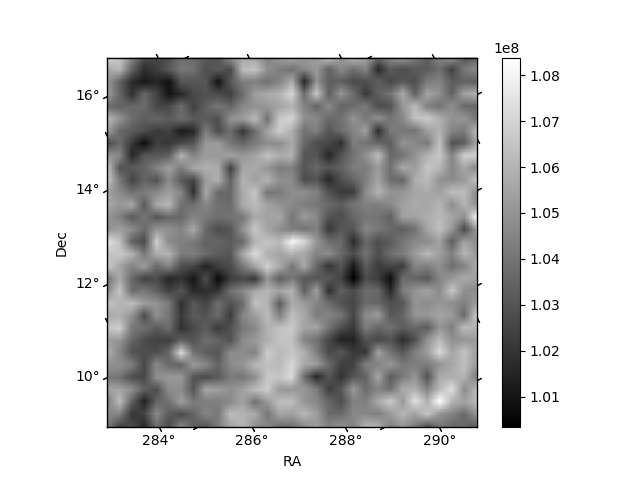
Histogram calculated using DETX and DETY for each event in the final _common_clean file
| Quadrant A | 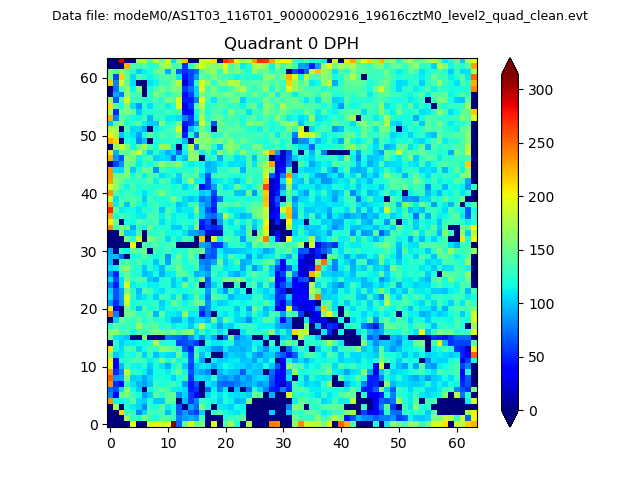 |
 |
Quadrant B |
|---|---|---|---|
| Quadrant D | 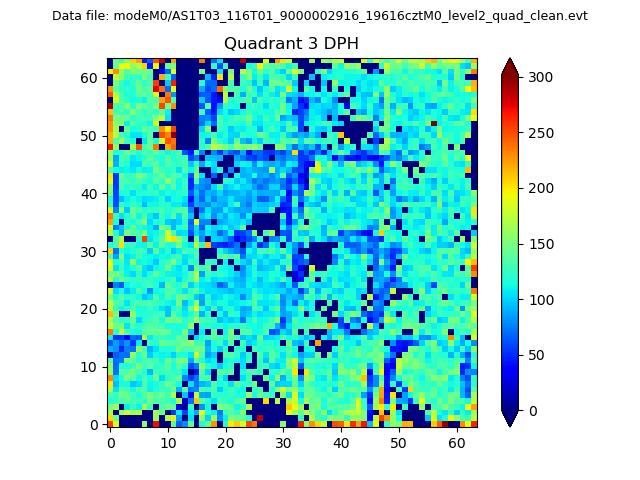 |
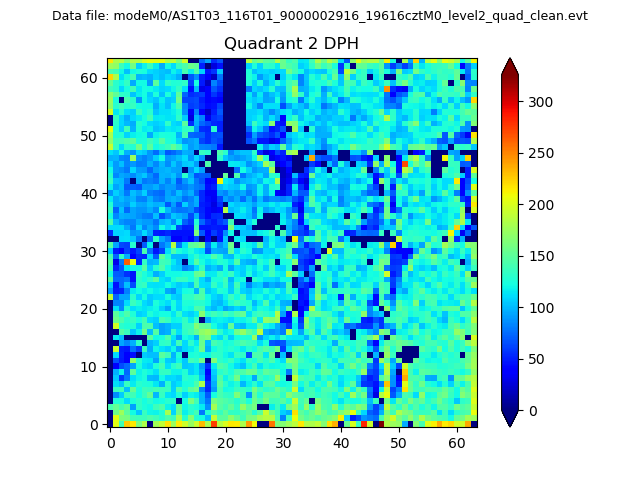 |
Quadrant C |
| Plot type | Count rate plots | Images |
|---|---|---|
| Comparison with Poisson distribution Blue bars denote a histogram of data divided into 1 sec bins. Red curve is a Poisson curve with rate = median count rate of data. |
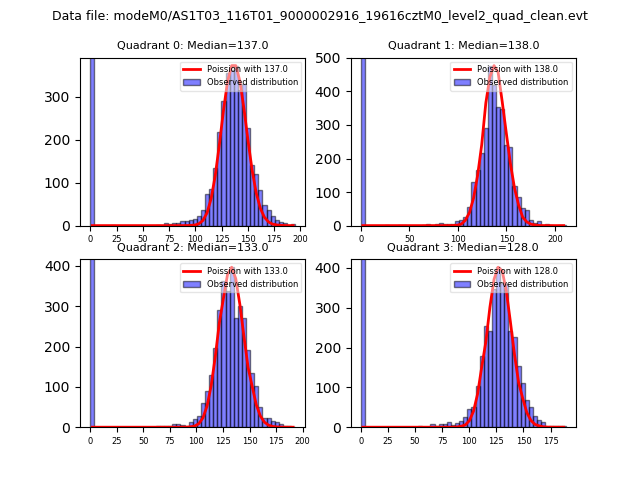 |
 |
| Quadrant-wise count rates Data is divided into 100 sec bins |
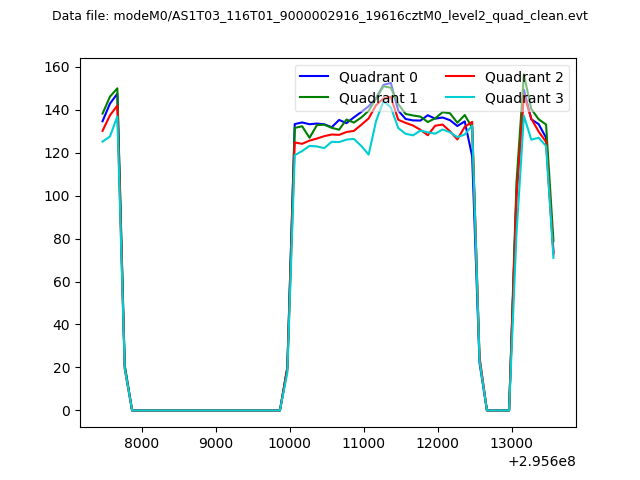 |
|
| Module-wise count rates for Quadrant A Data is divided into 100 sec bins |
 |
 |
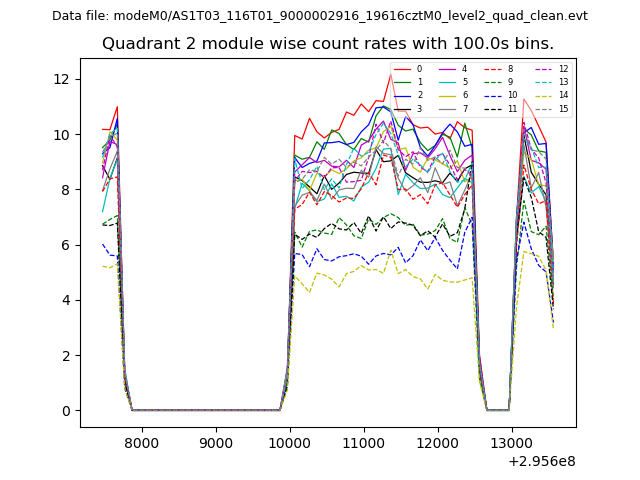
| Module-wise count rates for Quadrant B Data is divided into 100 sec bins |
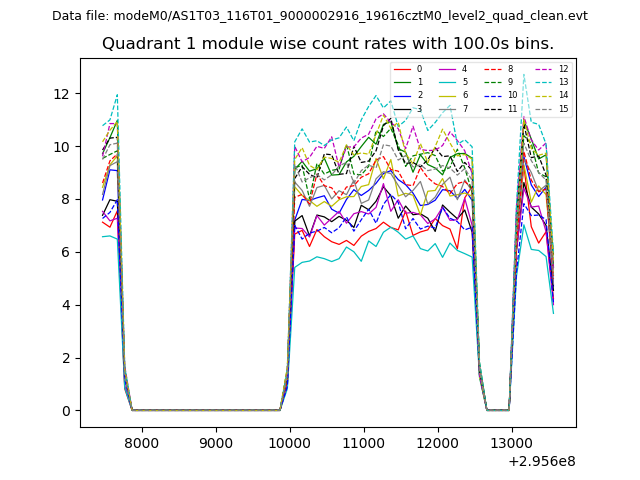 |
 |
| Module-wise count rates for Quadrant C Data is divided into 100 sec bins |
 |
 |
| Module-wise count rates for Quadrant D Data is divided into 100 sec bins |
 |
 |
| Parameter | Plot |
|---|---|
| CZT HV Monitor |  |
| D_VDD | 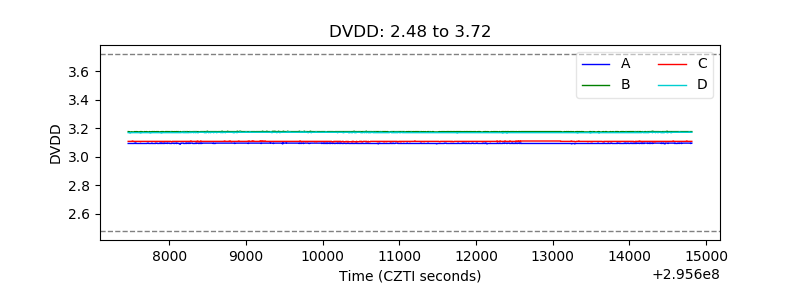 |
| Temperature 1 |  |
| Veto HV Monitor | 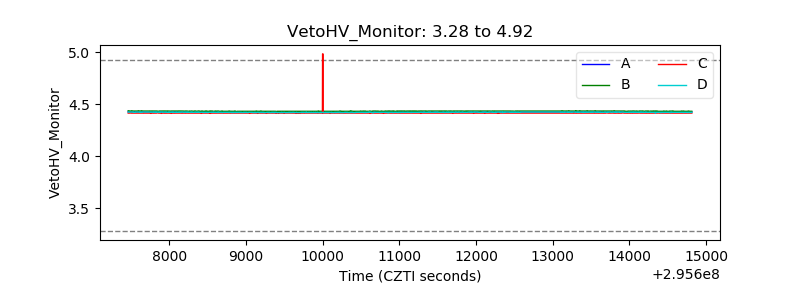 |
| Veto LLD | 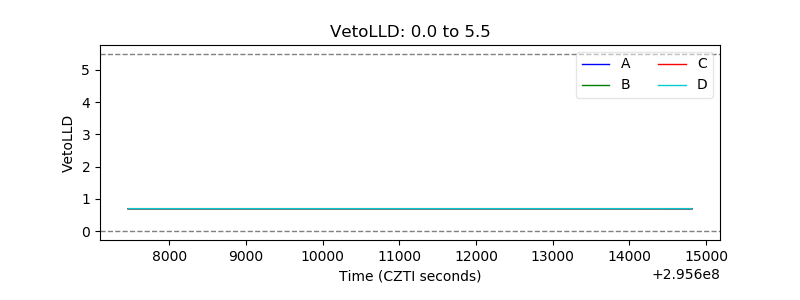 |
| Alpha Counter | 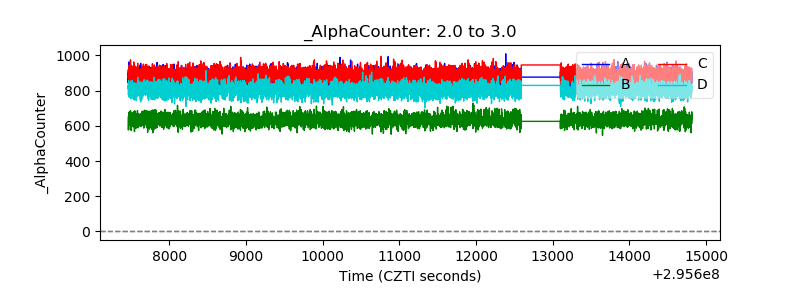 |
| _CPM_Rate | 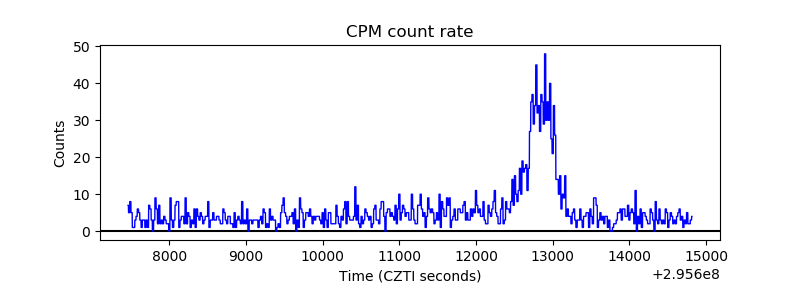 |
| CZT Counter | 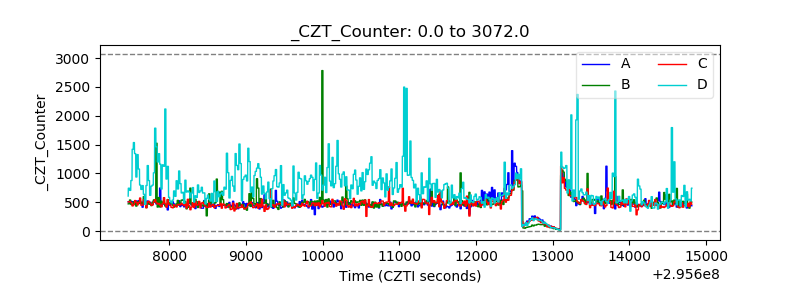 |
| +2.5 Volts monitor |  |
| +5 Volts monitor |  |
| _ROLL_ROT | 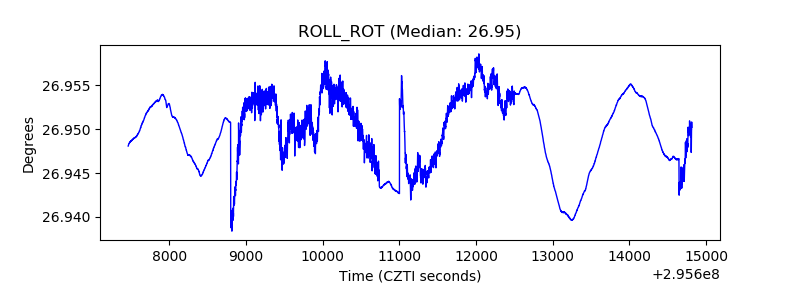 |
| _Roll_DEC | 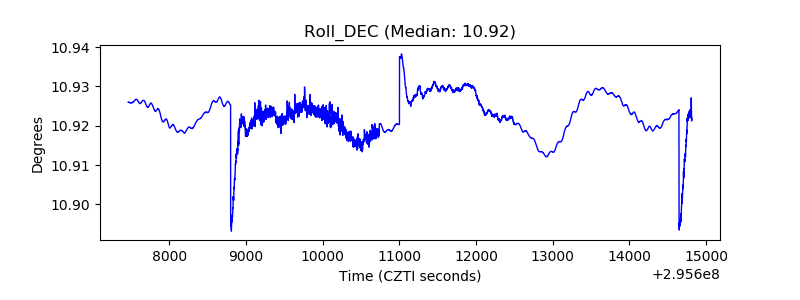 |
| _Roll_RA | 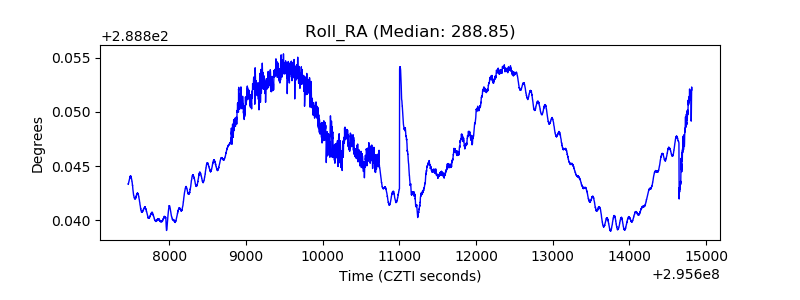 |
| Veto Counter | 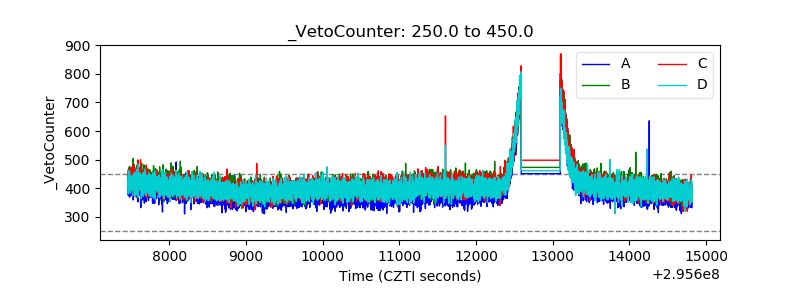 |