| Param | Original file | Final file |
|---|---|---|
| Filename | modeM0/AS1T03_116T01_9000002916_19617cztM0_level2.evt | modeM0/AS1T03_116T01_9000002916_19617cztM0_level2_quad_clean.evt |
| Size (bytes) | 523,693,440 | 78,958,080 |
| Size | 499.4 MB | 75.3 MB |
| Events in quadrant A | 3,494,093 | 482,093 |
| Events in quadrant B | 3,644,882 | 484,170 |
| Events in quadrant C | 3,506,993 | 463,583 |
| Events in quadrant D | 4,718,565 | 453,061 |
| Mode SS | |||
|---|---|---|---|
| Quadrant | BADHDUFLAG | Total packets | Discarded packets |
| A | 0 | 148 | 0 |
| B | 0 | 148 | 0 |
| C | 0 | 148 | 0 |
| D | 0 | 148 | 0 |
| Mode M0 | |||
|---|---|---|---|
| Quadrant | BADHDUFLAG | Total packets | Discarded packets |
| A | 0 | 15083 | 1 |
| B | 0 | 15375 | 1 |
| C | 0 | 15047 | 1 |
| D | 0 | 18855 | 1 |
| Mode M9 | |||
|---|---|---|---|
| Quadrant | BADHDUFLAG | Total packets | Discarded packets |
| A | 0 | 2 | 0 |
| B | 0 | 2 | 0 |
| C | 0 | 2 | 0 |
| D | 0 | 2 | 0 |
| Quadrant | Total seconds | Saturated seconds | Saturation percentage |
|---|---|---|---|
| A | 7296 | 120 | 1.644737% |
| B | 7297 | 146 | 2.000822% |
| C | 7297 | 140 | 1.918597% |
| D | 7297 | 217 | 2.973825% |
Noise dominated data is calculated using 1-second bins in cleaned event files. If a bin has >2000 counts, and if more than 50% of those come from <1% of pixels, then it is considered to be noise-dominated and hence unusable.
| Quadrant | # 1 sec bins | Bins with >0 counts | Bins with >2000 counts | High rate bins dominated by noise | Noise dominated (total time) | Noise dominated (detector-on time) | Marked lightcurve |
|---|---|---|---|---|---|---|---|
| A | 7511 | 7297 | 1 | 1 | 0.01% | 0.01% | 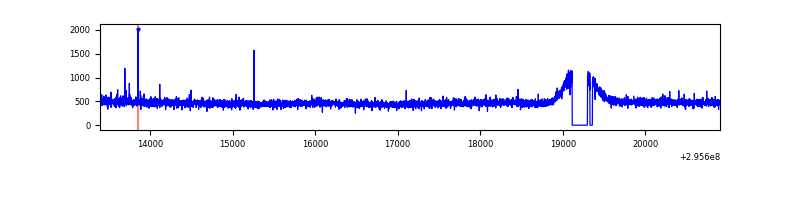 |
| B | 7512 | 7298 | 12 | 12 | 0.16% | 0.16% | 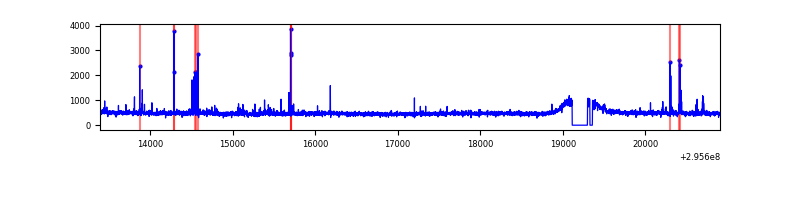 |
| C | 7512 | 7298 | 0 | 0 | 0.00% | 0.00% | 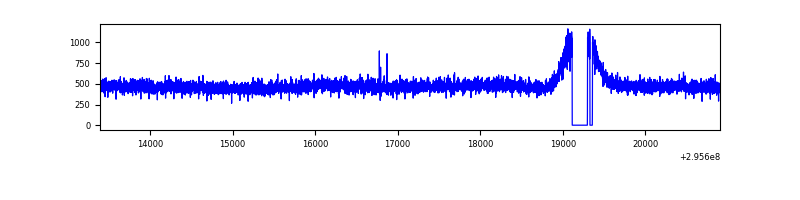 |
| D | 7512 | 7298 | 125 | 125 | 1.66% | 1.71% | 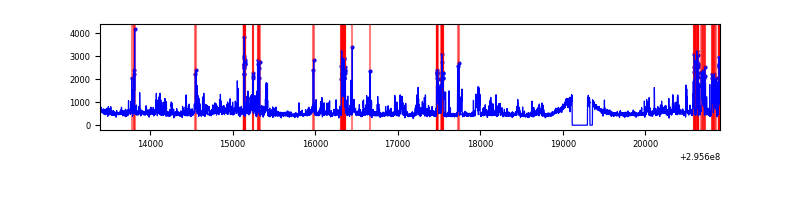 |
Top three noisy pixels from each quadrant. If the there are fewer than three noisy pixels in the level2.evt file, extra rows are filled as -1
| Pixel properties | Quadrant properties | ||||||
|---|---|---|---|---|---|---|---|
| Quadrant | DetID | PixID | Counts | Sigma | Mean | Median | Sigma |
| A | 5 | 16 | 11153 | 55.96 | 904 | 885 | 183.5 |
| A | 0 | 226 | 7891 | 38.18 | 904 | 885 | 183.5 |
| A | 3 | 137 | 7511 | 36.11 | 904 | 885 | 183.5 |
| B | 7 | 220 | 63354 | 358.16 | 895 | 873 | 174.5 |
| B | 0 | 198 | 30263 | 168.47 | 895 | 873 | 174.5 |
| B | 4 | 216 | 24607 | 136.05 | 895 | 873 | 174.5 |
| C | 14 | 238 | 132976 | 646.16 | 859 | 865 | 204.5 |
| C | 3 | 233 | 17188 | 79.84 | 859 | 865 | 204.5 |
| C | 13 | 61 | 6018 | 25.2 | 859 | 865 | 204.5 |
| D | 7 | 238 | 1196372 | 5584.24 | 872 | 849 | 214.1 |
| D | 12 | 218 | 103742 | 480.61 | 872 | 849 | 214.1 |
| D | 1 | 52 | 90259 | 417.63 | 872 | 849 | 214.1 |
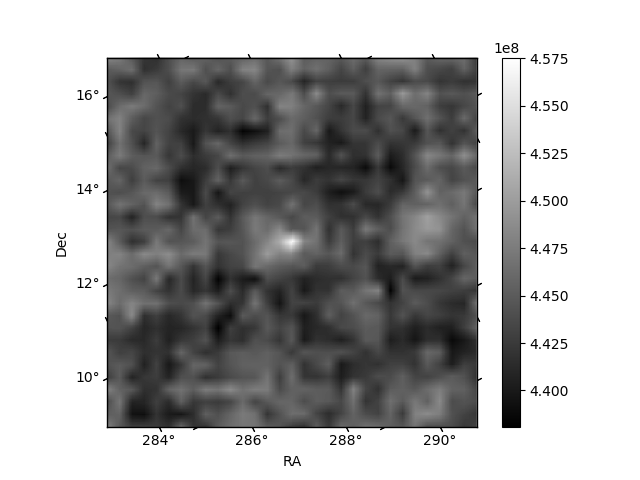
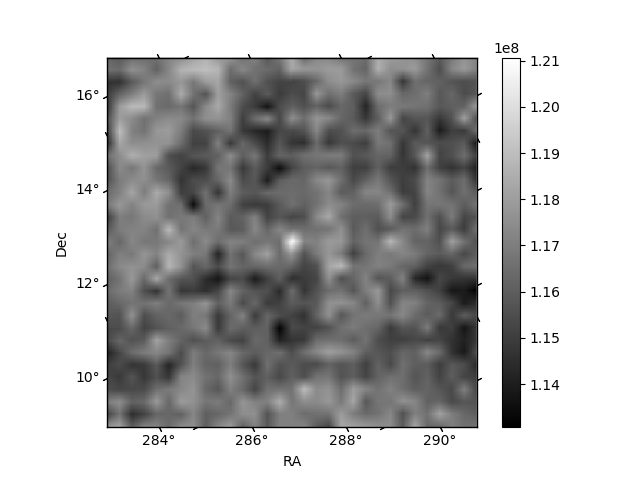
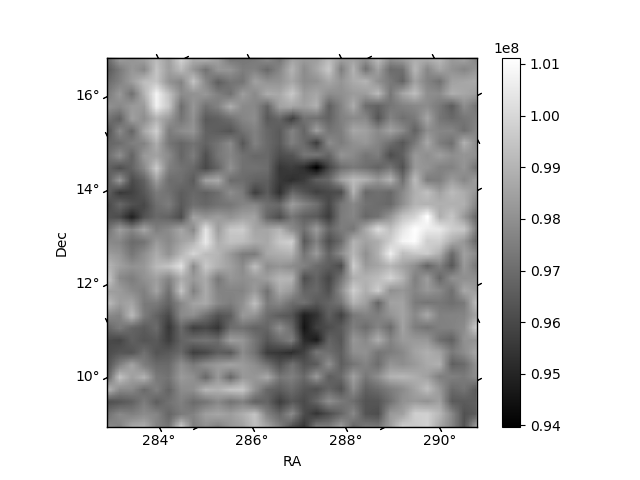
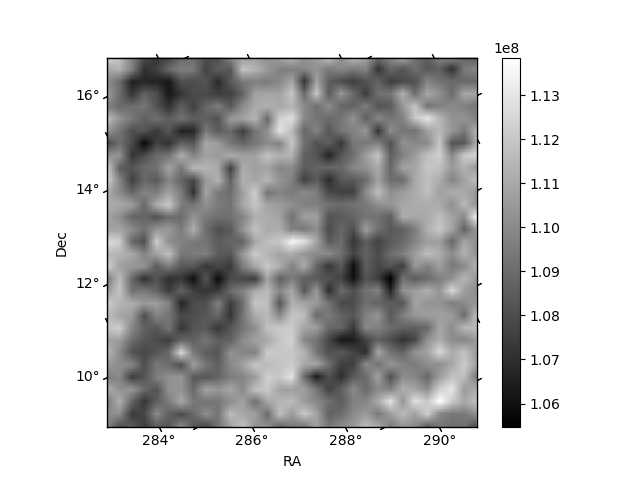
Histogram calculated using DETX and DETY for each event in the final _common_clean file
| Quadrant A | 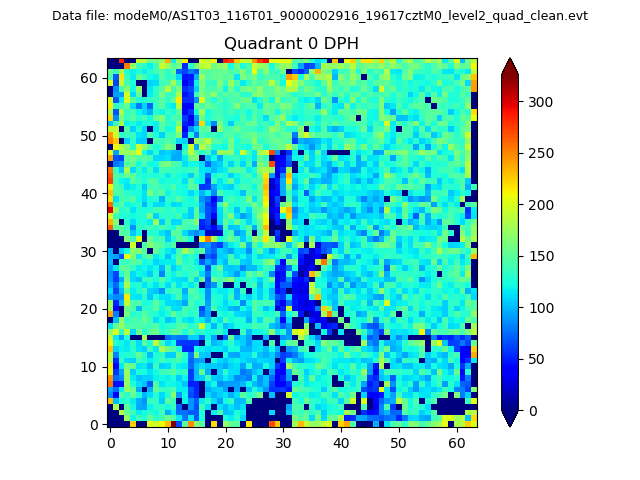 |
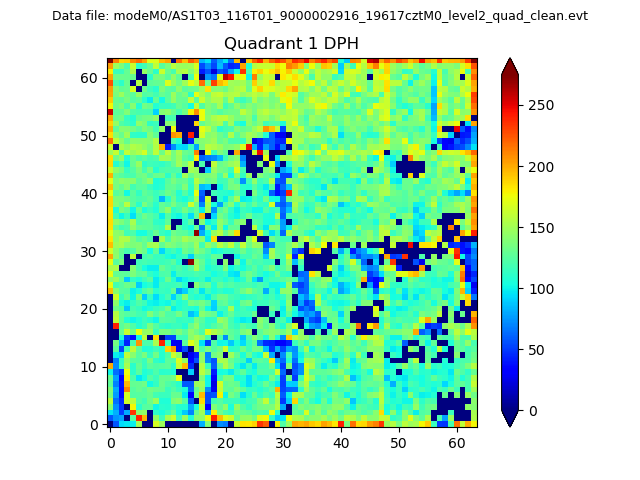 |
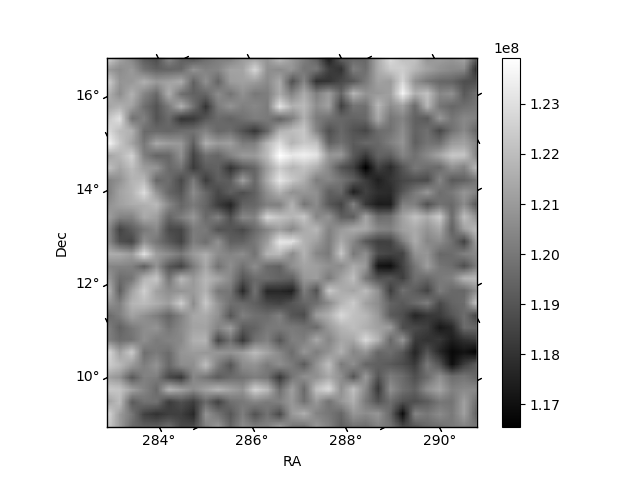
Quadrant B |
|---|---|---|---|
| Quadrant D | 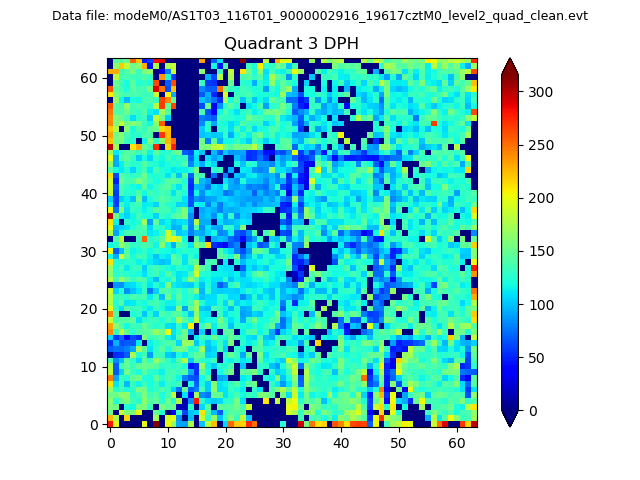 |
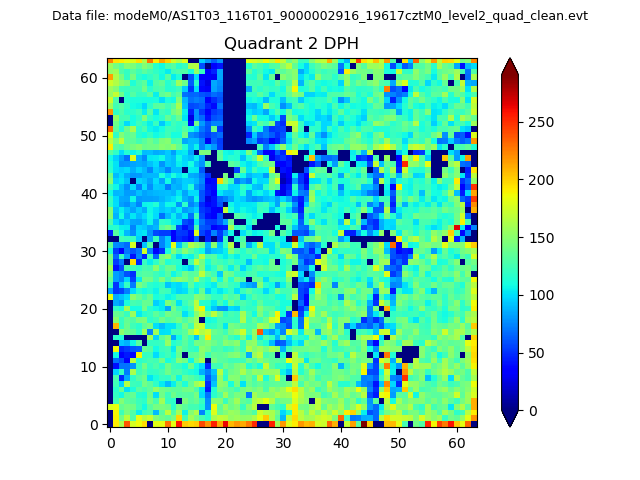 |
Quadrant C |
| Plot type | Count rate plots | Images |
|---|---|---|
| Comparison with Poisson distribution Blue bars denote a histogram of data divided into 1 sec bins. Red curve is a Poisson curve with rate = median count rate of data. |
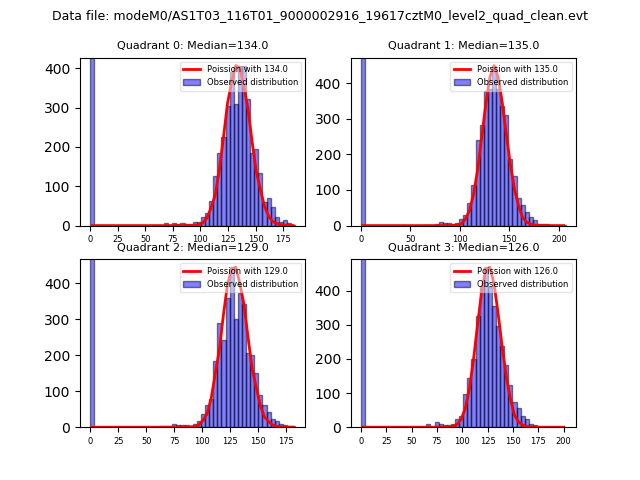 |
 |
| Quadrant-wise count rates Data is divided into 100 sec bins |
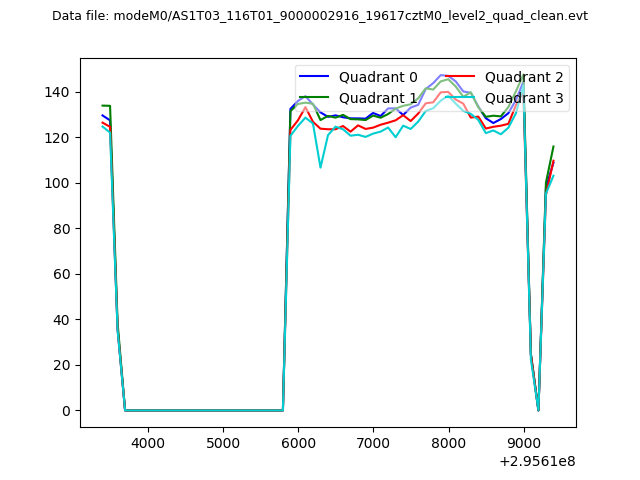 |
|
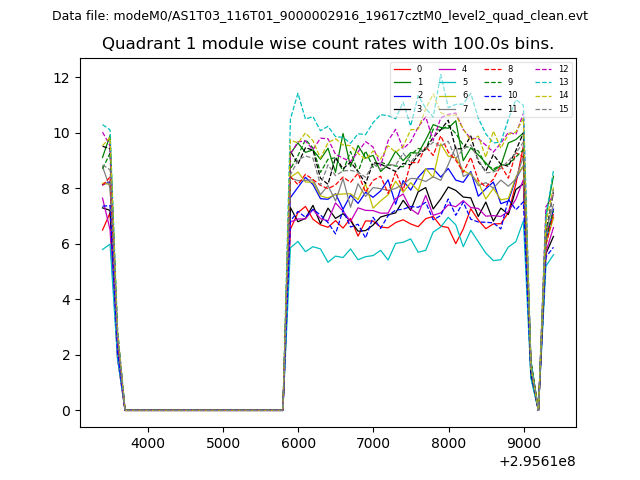
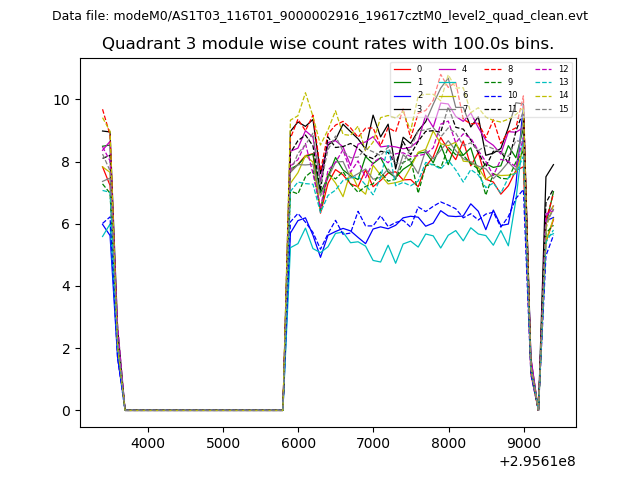
| Module-wise count rates for Quadrant A Data is divided into 100 sec bins |
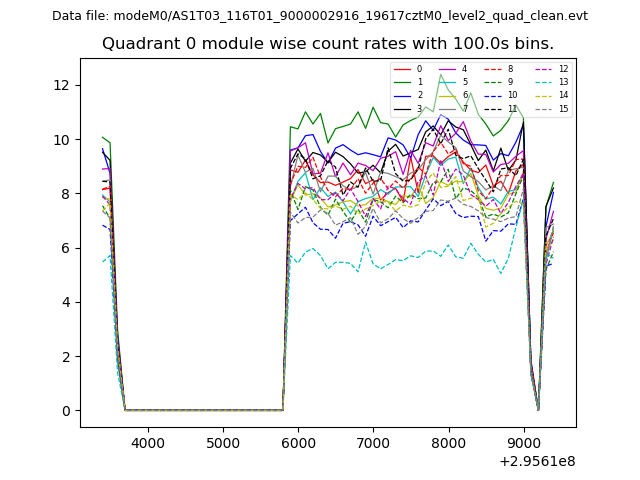 |
 |
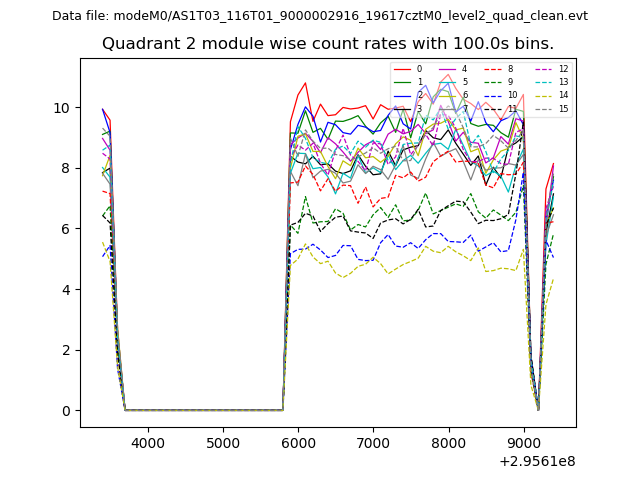
| Module-wise count rates for Quadrant B Data is divided into 100 sec bins |
 |
 |
| Module-wise count rates for Quadrant C Data is divided into 100 sec bins |
 |
 |
| Module-wise count rates for Quadrant D Data is divided into 100 sec bins |
 |
 |
| Parameter | Plot |
|---|---|
| CZT HV Monitor | 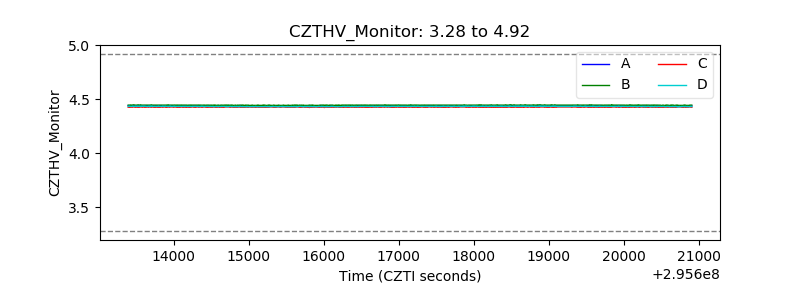 |
| D_VDD | 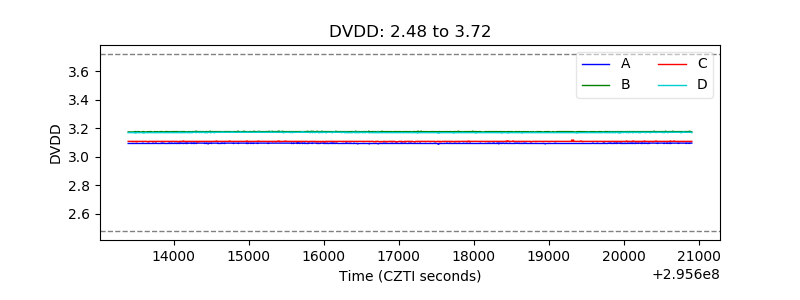 |
| Temperature 1 | 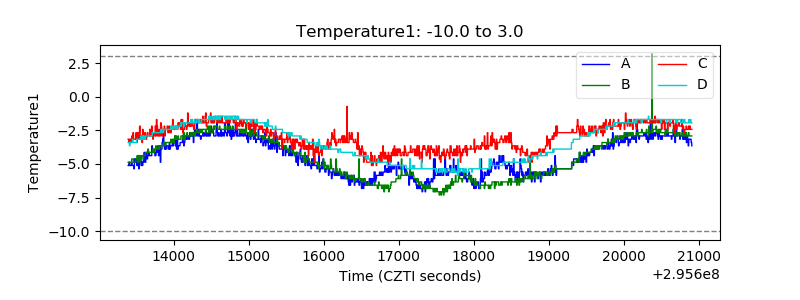 |
| Veto HV Monitor | 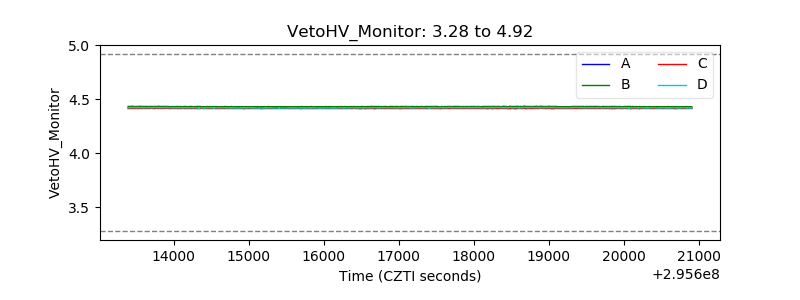 |
| Veto LLD | 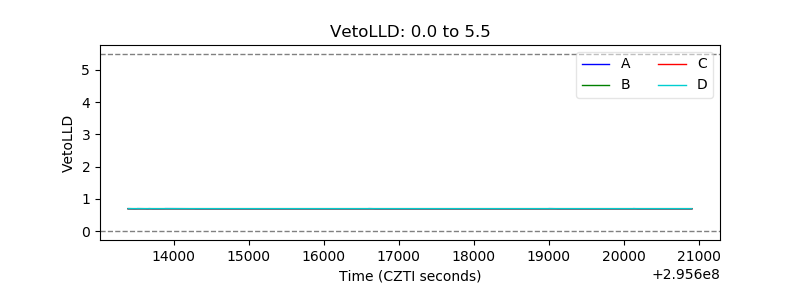 |
| Alpha Counter | 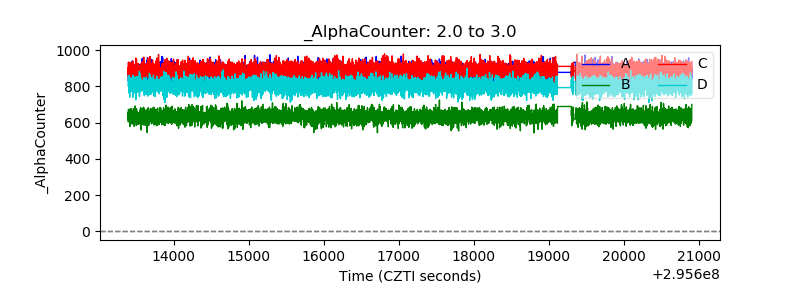 |
| _CPM_Rate | 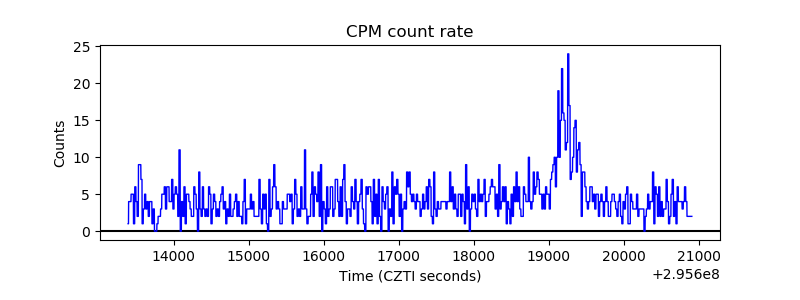 |
| CZT Counter | 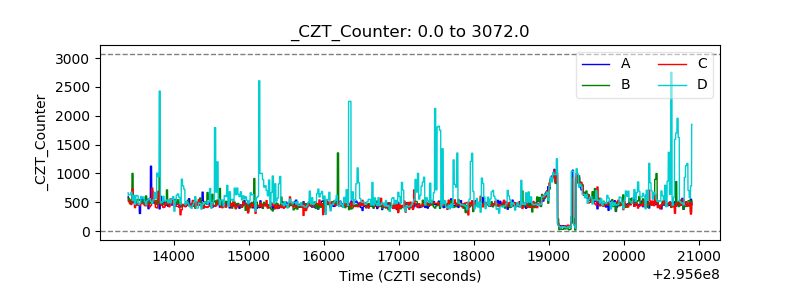 |
| +2.5 Volts monitor |  |
| +5 Volts monitor |  |
| _ROLL_ROT | 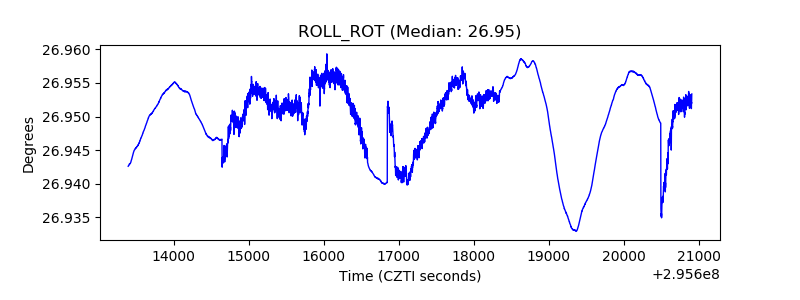 |
| _Roll_DEC | 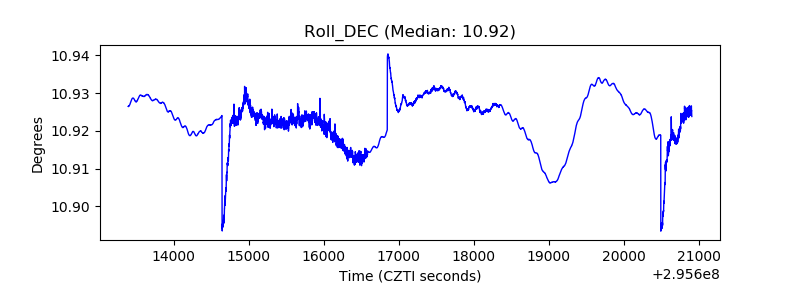 |
| _Roll_RA | 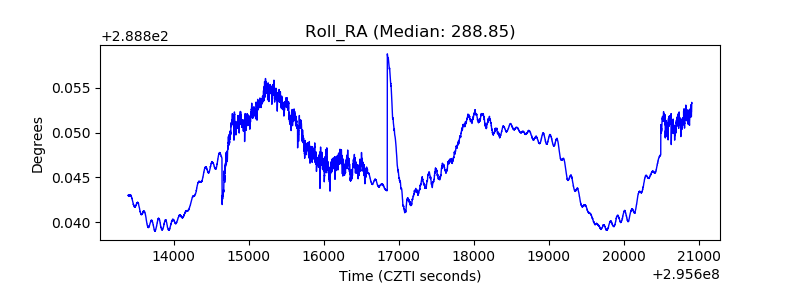 |
| Veto Counter | 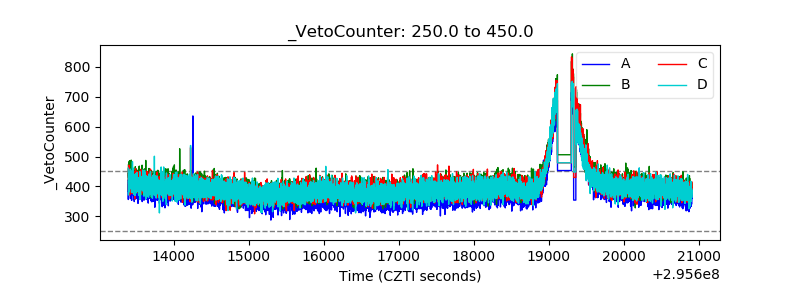 |