| Param | Original file | Final file |
|---|---|---|
| Filename | modeM0/AS1T03_116T01_9000002916_19622cztM0_level2.evt | modeM0/AS1T03_116T01_9000002916_19622cztM0_level2_quad_clean.evt |
| Size (bytes) | 641,617,920 | 93,971,520 |
| Size | 611.9 MB | 89.6 MB |
| Events in quadrant A | 3,035,847 | 629,221 |
| Events in quadrant B | 3,161,805 | 637,096 |
| Events in quadrant C | 3,187,820 | 615,971 |
| Events in quadrant D | 9,608,314 | 512,141 |
| Mode SS | |||
|---|---|---|---|
| Quadrant | BADHDUFLAG | Total packets | Discarded packets |
| A | 0 | 130 | 0 |
| B | 0 | 130 | 0 |
| C | 0 | 130 | 0 |
| D | 0 | 130 | 0 |
| Mode M0 | |||
|---|---|---|---|
| Quadrant | BADHDUFLAG | Total packets | Discarded packets |
| A | 0 | 13240 | 1 |
| B | 0 | 13534 | 1 |
| C | 0 | 13491 | 1 |
| D | 0 | 33076 | 1 |
| Mode M9 | |||
|---|---|---|---|
| Quadrant | BADHDUFLAG | Total packets | Discarded packets |
| A | 0 | 10 | 0 |
| B | 0 | 10 | 0 |
| C | 0 | 10 | 0 |
| D | 0 | 10 | 0 |
| Quadrant | Total seconds | Saturated seconds | Saturation percentage |
|---|---|---|---|
| A | 6464 | 30 | 0.464109% |
| B | 6464 | 57 | 0.881807% |
| C | 6464 | 86 | 1.330446% |
| D | 6465 | 2213 | 34.230472% |
Noise dominated data is calculated using 1-second bins in cleaned event files. If a bin has >2000 counts, and if more than 50% of those come from <1% of pixels, then it is considered to be noise-dominated and hence unusable.
| Quadrant | # 1 sec bins | Bins with >0 counts | Bins with >2000 counts | High rate bins dominated by noise | Noise dominated (total time) | Noise dominated (detector-on time) | Marked lightcurve |
|---|---|---|---|---|---|---|---|
| A | 7424 | 6464 | 0 | 0 | 0.00% | 0.00% | 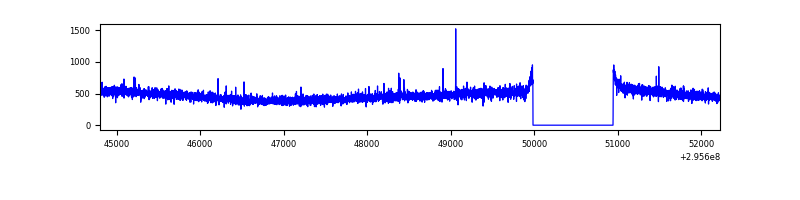 |
| B | 7424 | 6465 | 6 | 6 | 0.08% | 0.09% | 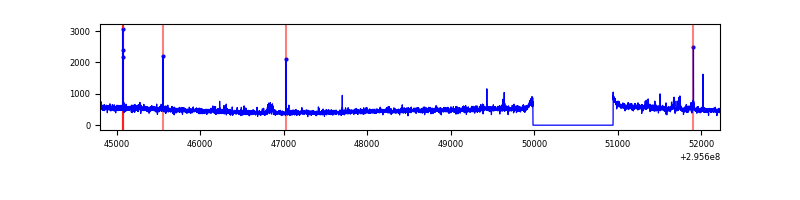 |
| C | 7424 | 6464 | 0 | 0 | 0.00% | 0.00% | 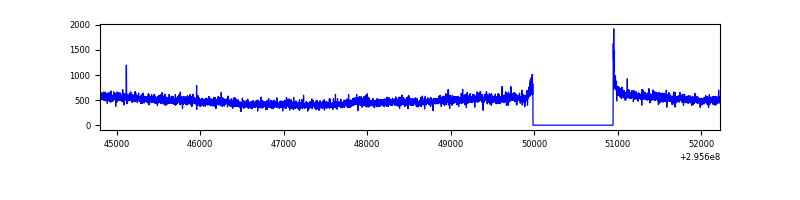 |
| D | 7425 | 6465 | 2020 | 2020 | 27.21% | 31.25% | 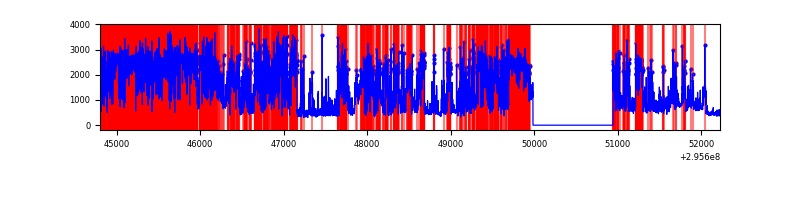 |
Top three noisy pixels from each quadrant. If the there are fewer than three noisy pixels in the level2.evt file, extra rows are filled as -1
| Pixel properties | Quadrant properties | ||||||
|---|---|---|---|---|---|---|---|
| Quadrant | DetID | PixID | Counts | Sigma | Mean | Median | Sigma |
| A | 0 | 226 | 6800 | 37.87 | 786 | 770 | 159.2 |
| A | 3 | 137 | 6366 | 35.14 | 786 | 770 | 159.2 |
| A | 13 | 254 | 6247 | 34.39 | 786 | 770 | 159.2 |
| B | 0 | 230 | 28943 | 186.24 | 785 | 764 | 151.3 |
| B | 12 | 111 | 18449 | 116.88 | 785 | 764 | 151.3 |
| B | 0 | 198 | 17947 | 113.57 | 785 | 764 | 151.3 |
| C | 14 | 238 | 118085 | 653.01 | 761 | 766 | 179.7 |
| C | 3 | 233 | 96649 | 533.69 | 761 | 766 | 179.7 |
| C | 13 | 61 | 5402 | 25.8 | 761 | 766 | 179.7 |
| D | 1 | 52 | 5454496 | 33503.39 | 663 | 644 | 162.8 |
| D | 7 | 238 | 1484146 | 9113.25 | 663 | 644 | 162.8 |
| D | 2 | 16 | 138184 | 844.91 | 663 | 644 | 162.8 |
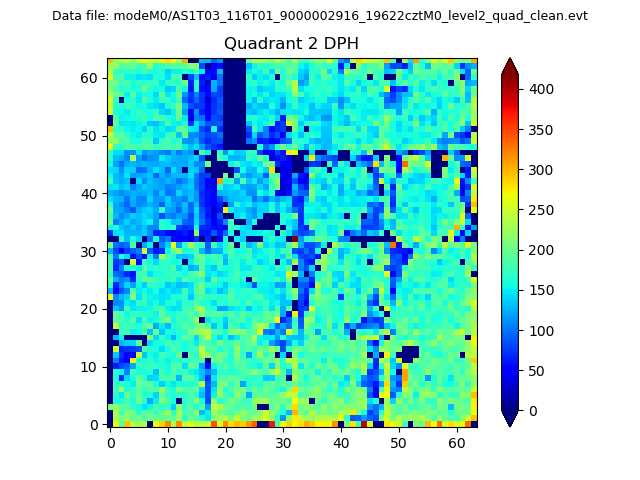
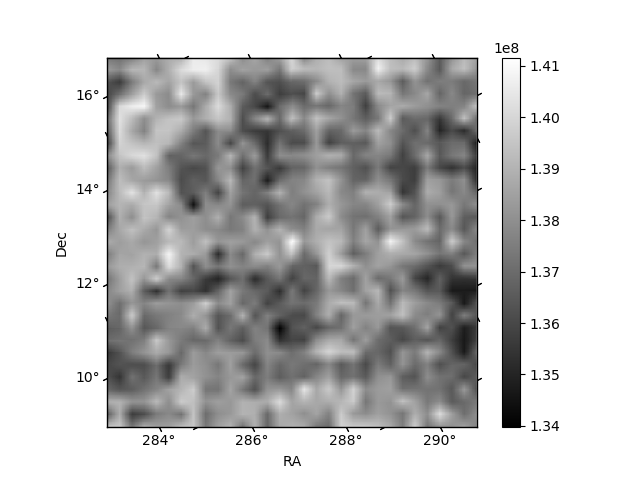
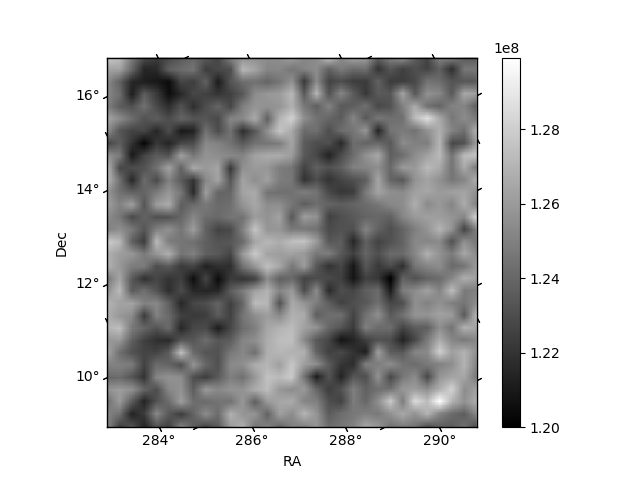
Histogram calculated using DETX and DETY for each event in the final _common_clean file
| Quadrant A | 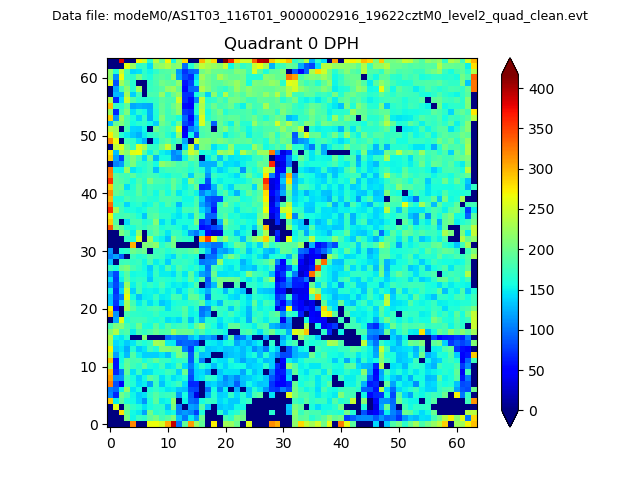 |
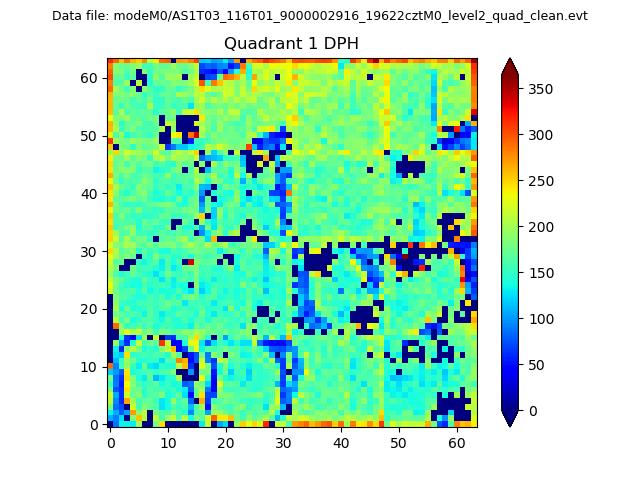 |
Quadrant B |
|---|---|---|---|
| Quadrant D | 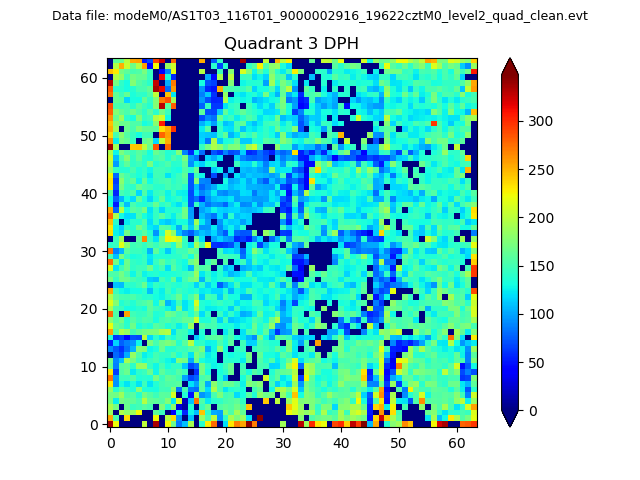 |
 |
Quadrant C |
| Plot type | Count rate plots | Images |
|---|---|---|
| Comparison with Poisson distribution Blue bars denote a histogram of data divided into 1 sec bins. Red curve is a Poisson curve with rate = median count rate of data. |
 |
 |
| Quadrant-wise count rates Data is divided into 100 sec bins |
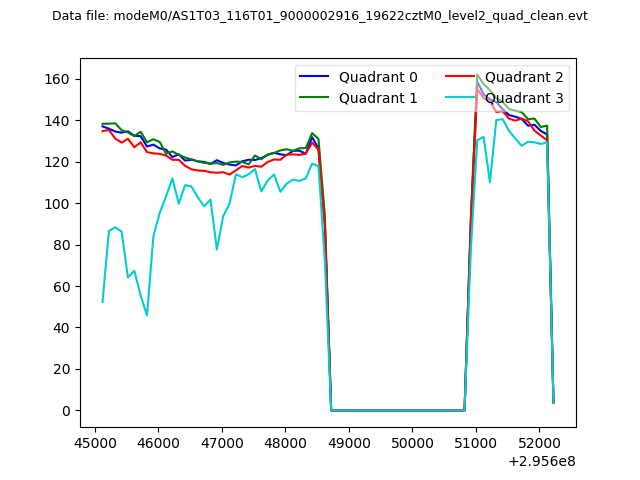 |
|
| Module-wise count rates for Quadrant A Data is divided into 100 sec bins |
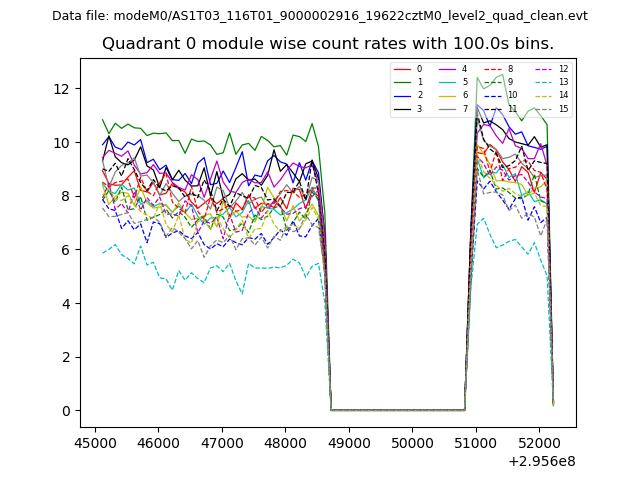 |
 |
| Module-wise count rates for Quadrant B Data is divided into 100 sec bins |
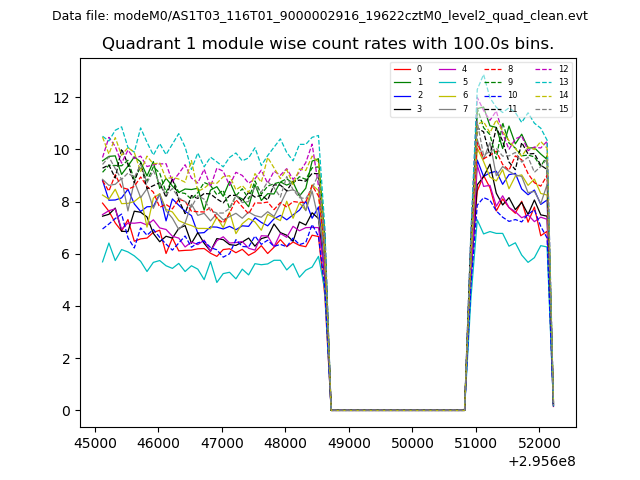 |
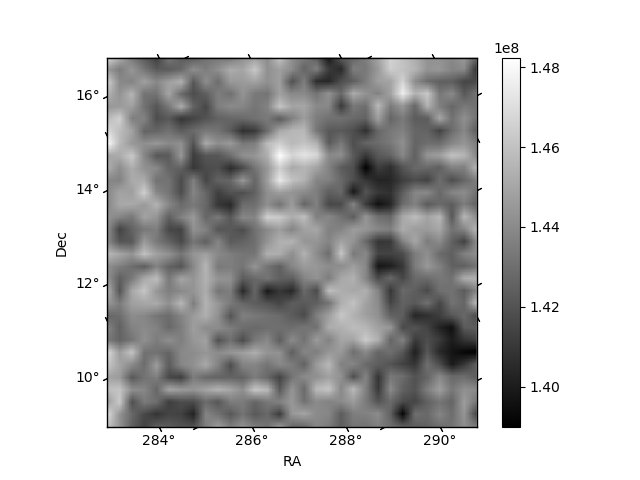 |
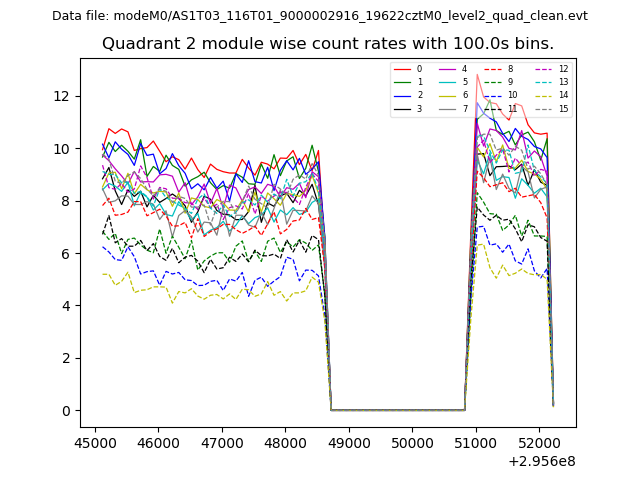
| Module-wise count rates for Quadrant C Data is divided into 100 sec bins |
 |
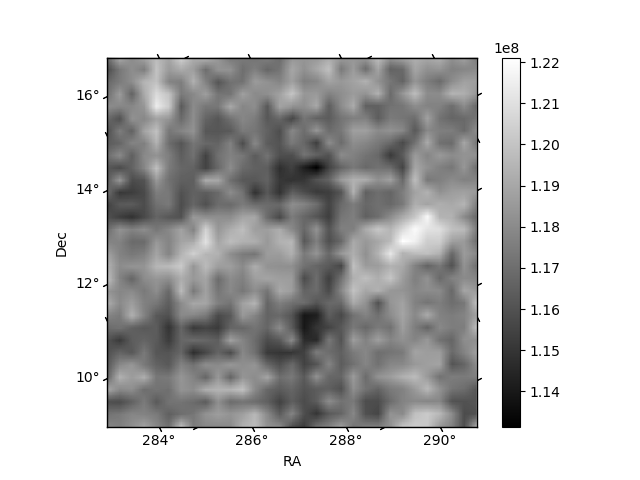 |
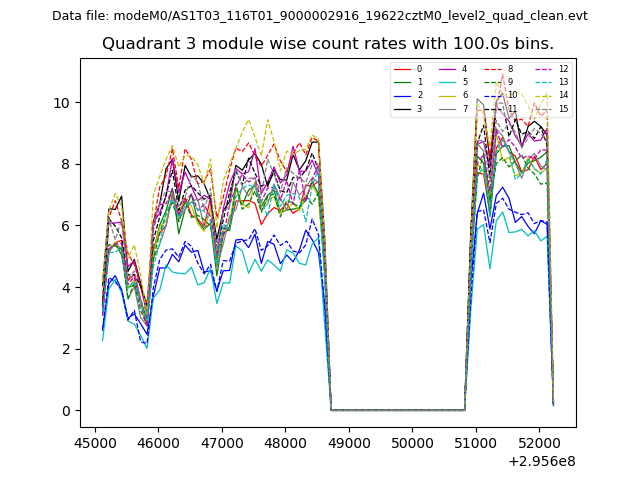
| Module-wise count rates for Quadrant D Data is divided into 100 sec bins |
 |
 |
| Parameter | Plot |
|---|---|
| CZT HV Monitor | 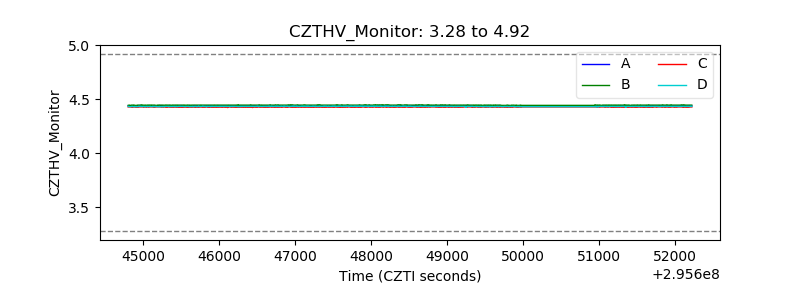 |
| D_VDD | 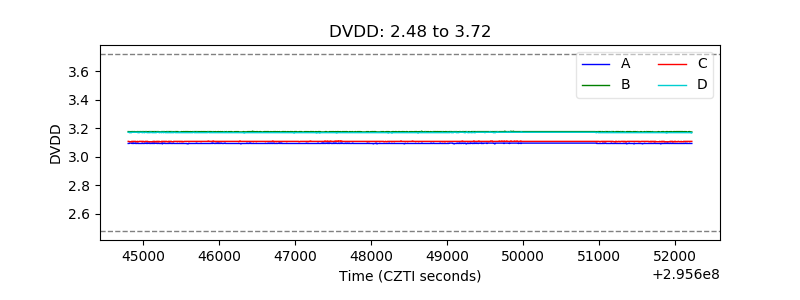 |
| Temperature 1 |  |
| Veto HV Monitor | 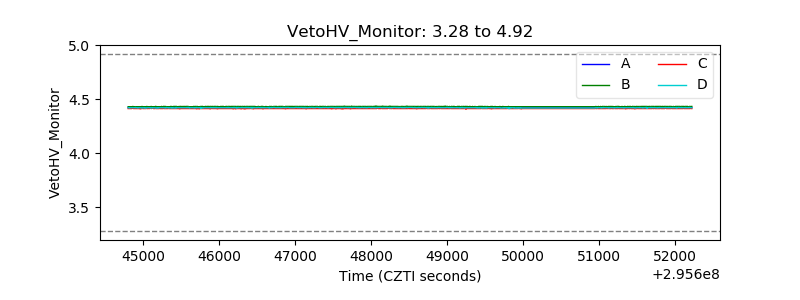 |
| Veto LLD | 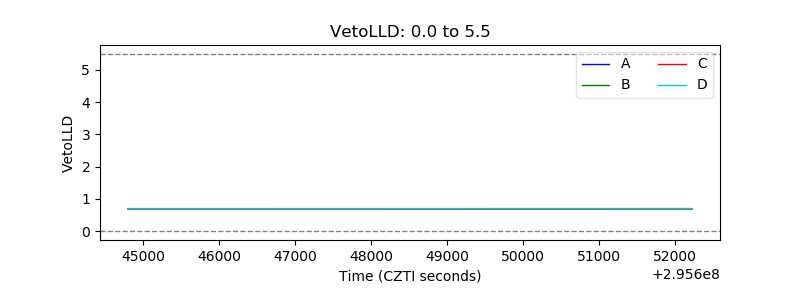 |
| Alpha Counter |  |
| _CPM_Rate | 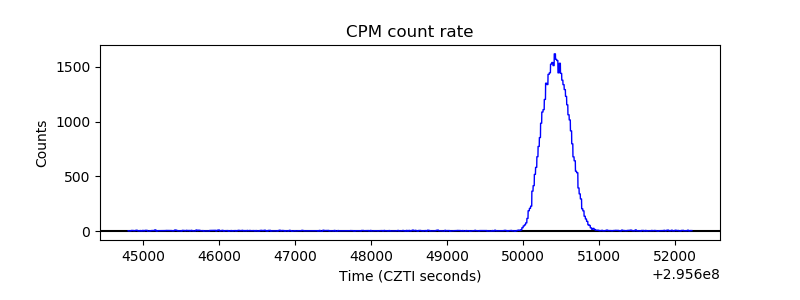 |
| CZT Counter |  |
| +2.5 Volts monitor |  |
| +5 Volts monitor |  |
| _ROLL_ROT | 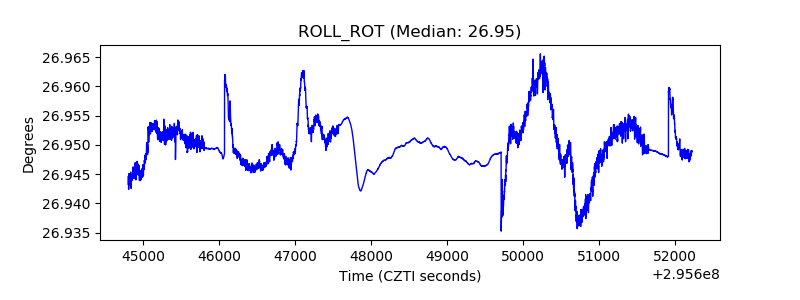 |
| _Roll_DEC | 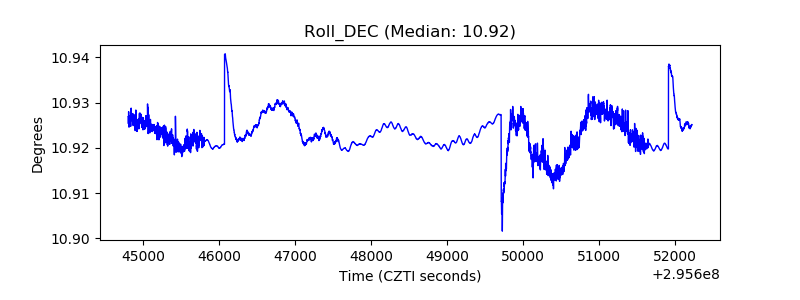 |
| _Roll_RA |  |
| Veto Counter | 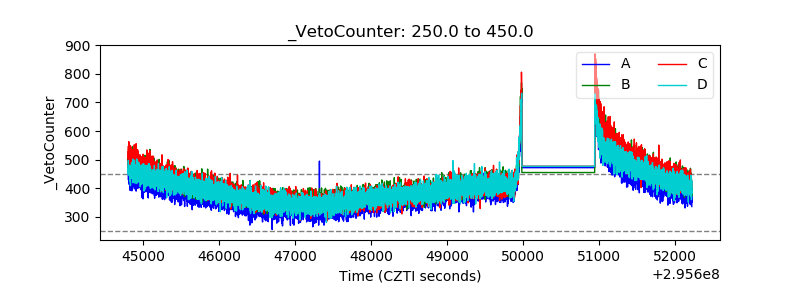 |