| Param | Original file | Final file |
|---|---|---|
| Filename | modeM0/AS1T03_116T01_9000002916_19624cztM0_level2.evt | modeM0/AS1T03_116T01_9000002916_19624cztM0_level2_quad_clean.evt |
| Size (bytes) | 524,831,040 | 102,945,600 |
| Size | 500.5 MB | 98.2 MB |
| Events in quadrant A | 3,104,262 | 676,872 |
| Events in quadrant B | 3,267,859 | 691,383 |
| Events in quadrant C | 3,352,870 | 663,930 |
| Events in quadrant D | 5,727,684 | 631,039 |
| Mode SS | |||
|---|---|---|---|
| Quadrant | BADHDUFLAG | Total packets | Discarded packets |
| A | 0 | 132 | 0 |
| B | 0 | 132 | 0 |
| C | 0 | 132 | 0 |
| D | 0 | 132 | 0 |
| Mode M0 | |||
|---|---|---|---|
| Quadrant | BADHDUFLAG | Total packets | Discarded packets |
| A | 0 | 13506 | 2 |
| B | 0 | 13961 | 2 |
| C | 0 | 14143 | 3 |
| D | 0 | 21577 | 2 |
| Mode M9 | |||
|---|---|---|---|
| Quadrant | BADHDUFLAG | Total packets | Discarded packets |
| A | 0 | 14 | 0 |
| B | 0 | 15 | 0 |
| C | 0 | 15 | 0 |
| D | 0 | 15 | 0 |
| Quadrant | Total seconds | Saturated seconds | Saturation percentage |
|---|---|---|---|
| A | 6518 | 19 | 0.291500% |
| B | 6518 | 53 | 0.813133% |
| C | 6517 | 82 | 1.258248% |
| D | 6517 | 420 | 6.444683% |
Noise dominated data is calculated using 1-second bins in cleaned event files. If a bin has >2000 counts, and if more than 50% of those come from <1% of pixels, then it is considered to be noise-dominated and hence unusable.
| Quadrant | # 1 sec bins | Bins with >0 counts | Bins with >2000 counts | High rate bins dominated by noise | Noise dominated (total time) | Noise dominated (detector-on time) | Marked lightcurve |
|---|---|---|---|---|---|---|---|
| A | 7628 | 6519 | 0 | 0 | 0.00% | 0.00% | 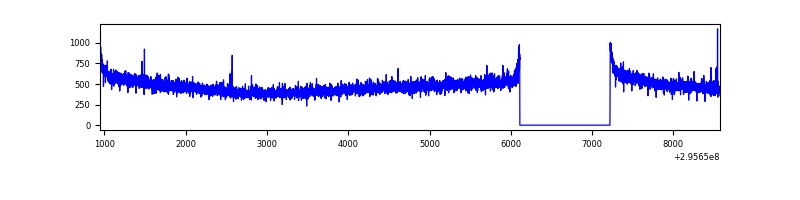 |
| B | 7628 | 6519 | 2 | 2 | 0.03% | 0.03% | 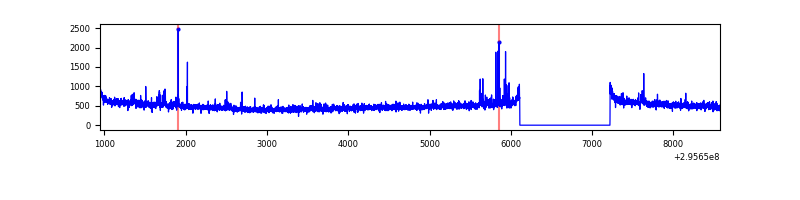 |
| C | 7627 | 6518 | 0 | 0 | 0.00% | 0.00% | 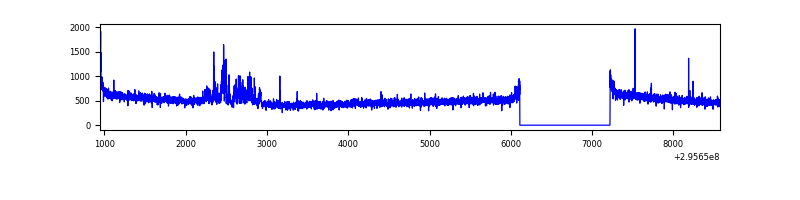 |
| D | 7627 | 6517 | 344 | 344 | 4.51% | 5.28% | 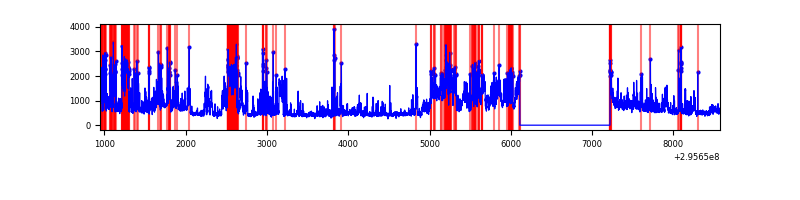 |
Top three noisy pixels from each quadrant. If the there are fewer than three noisy pixels in the level2.evt file, extra rows are filled as -1
| Pixel properties | Quadrant properties | ||||||
|---|---|---|---|---|---|---|---|
| Quadrant | DetID | PixID | Counts | Sigma | Mean | Median | Sigma |
| A | 0 | 226 | 6909 | 37.8 | 805 | 790 | 161.9 |
| A | 3 | 137 | 6234 | 33.63 | 805 | 790 | 161.9 |
| A | 13 | 254 | 6188 | 33.34 | 805 | 790 | 161.9 |
| B | 7 | 220 | 40104 | 254.39 | 809 | 791 | 154.5 |
| B | 0 | 230 | 27960 | 175.81 | 809 | 791 | 154.5 |
| B | 12 | 111 | 18748 | 116.2 | 809 | 791 | 154.5 |
| C | 3 | 233 | 169558 | 911.5 | 782 | 790 | 185.2 |
| C | 14 | 238 | 122016 | 654.73 | 782 | 790 | 185.2 |
| C | 8 | 208 | 7860 | 38.18 | 782 | 790 | 185.2 |
| D | 1 | 52 | 1733378 | 9140.45 | 771 | 750 | 189.6 |
| D | 7 | 238 | 1028745 | 5423.17 | 771 | 750 | 189.6 |
| D | 12 | 233 | 32227 | 166.06 | 771 | 750 | 189.6 |
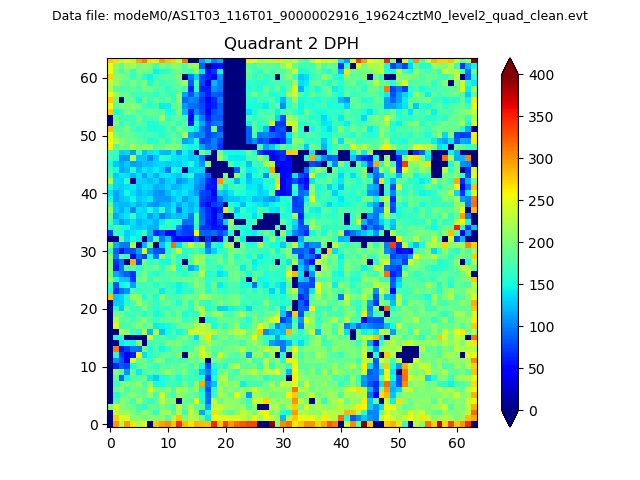
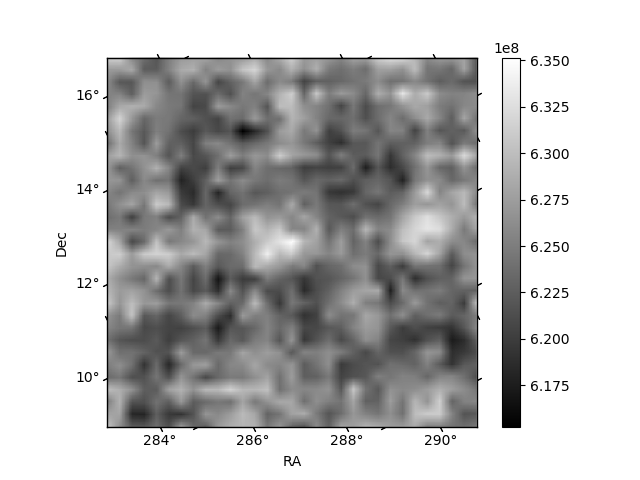
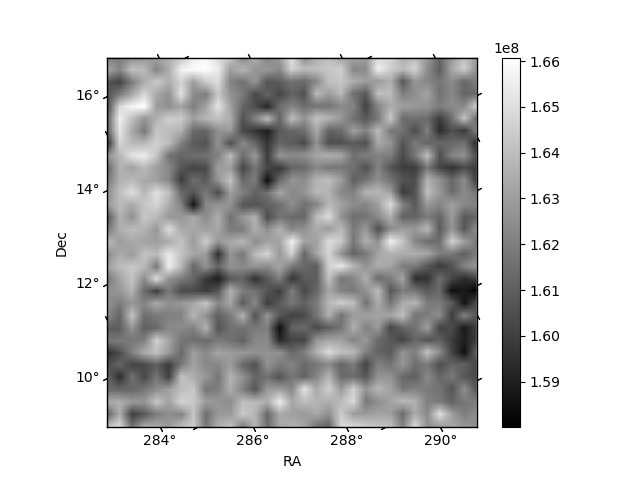
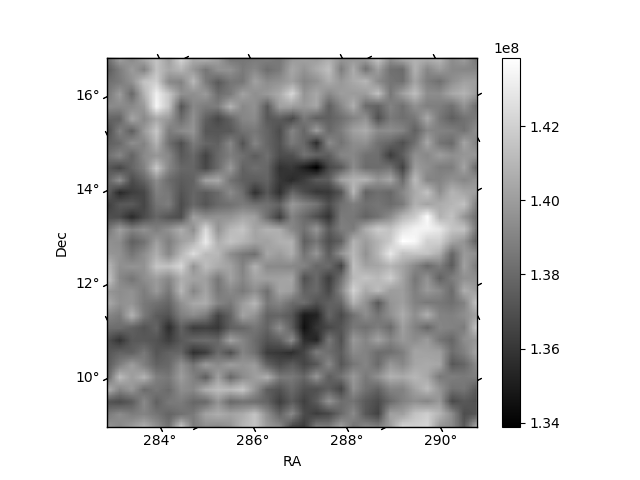
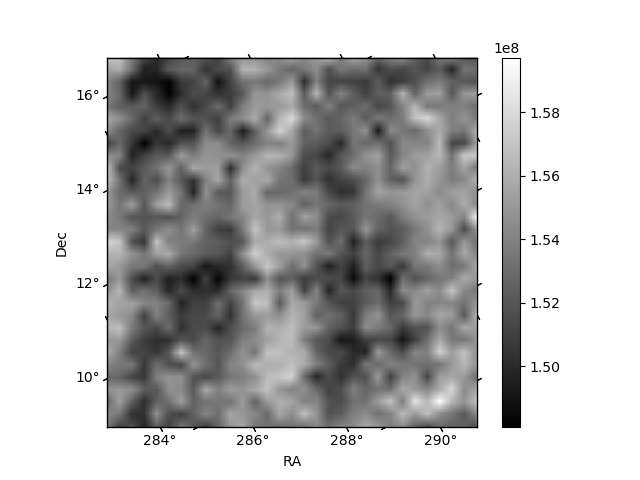
Histogram calculated using DETX and DETY for each event in the final _common_clean file
| Quadrant A | 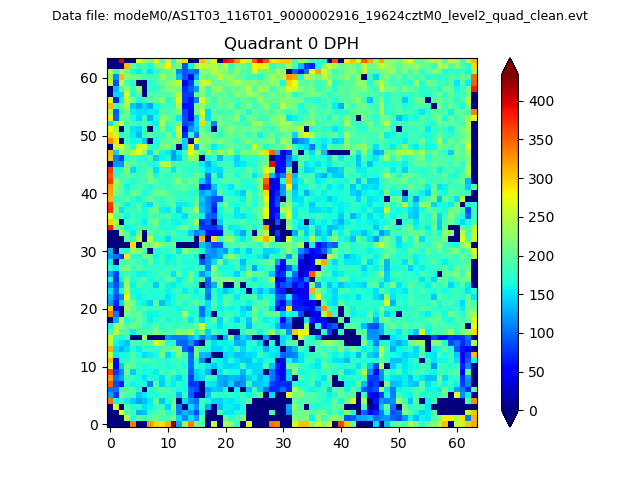 |
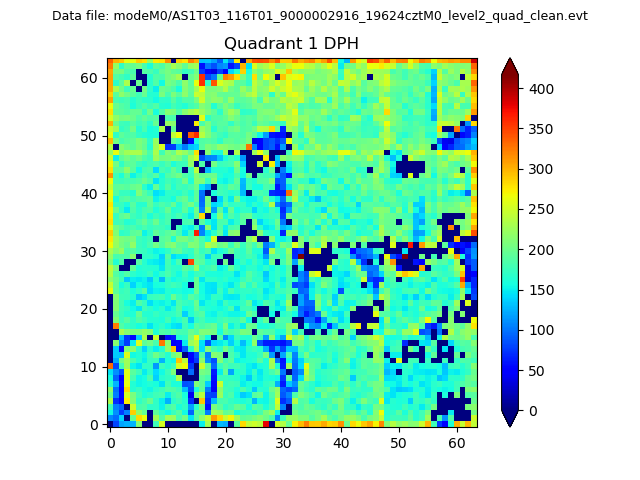 |
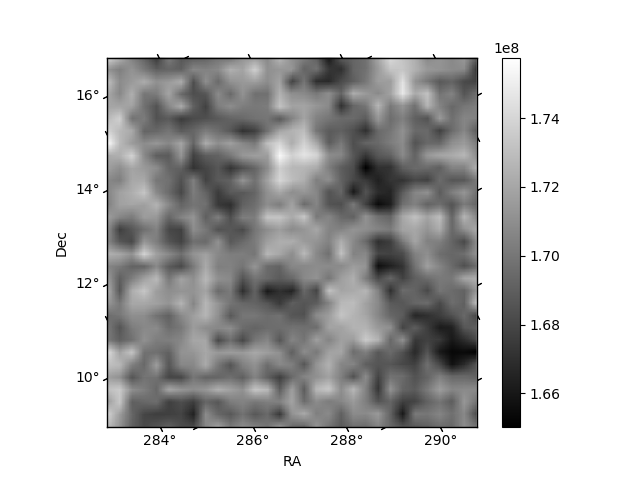
Quadrant B |
|---|---|---|---|
| Quadrant D | 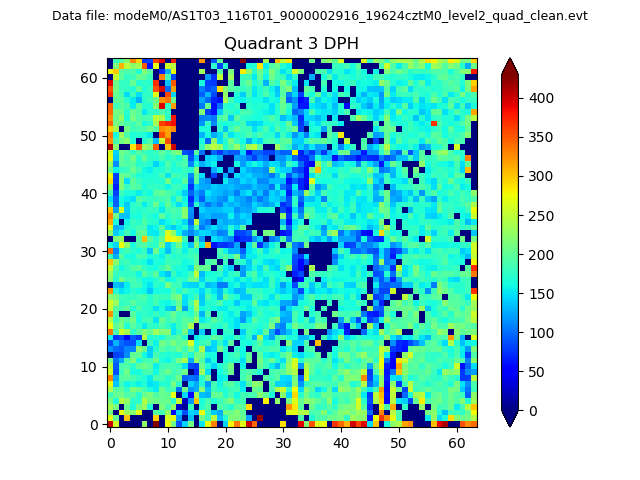 |
 |
Quadrant C |
| Plot type | Count rate plots | Images |
|---|---|---|
| Comparison with Poisson distribution Blue bars denote a histogram of data divided into 1 sec bins. Red curve is a Poisson curve with rate = median count rate of data. |
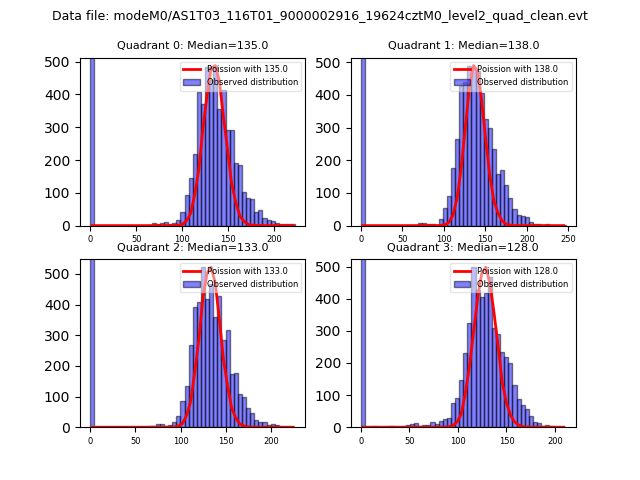 |
 |
| Quadrant-wise count rates Data is divided into 100 sec bins |
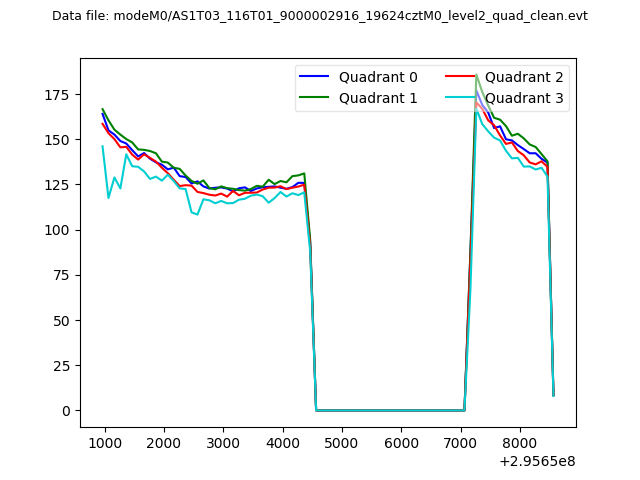 |
|
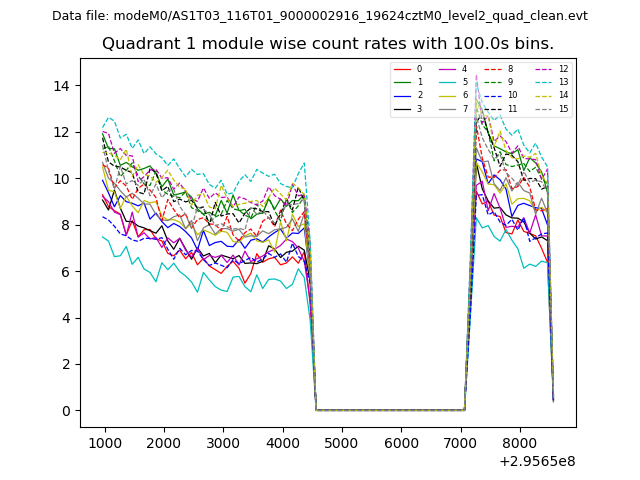
| Module-wise count rates for Quadrant A Data is divided into 100 sec bins |
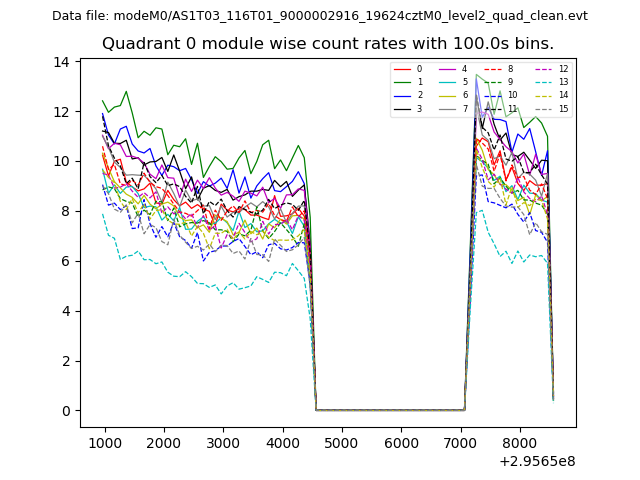 |
 |
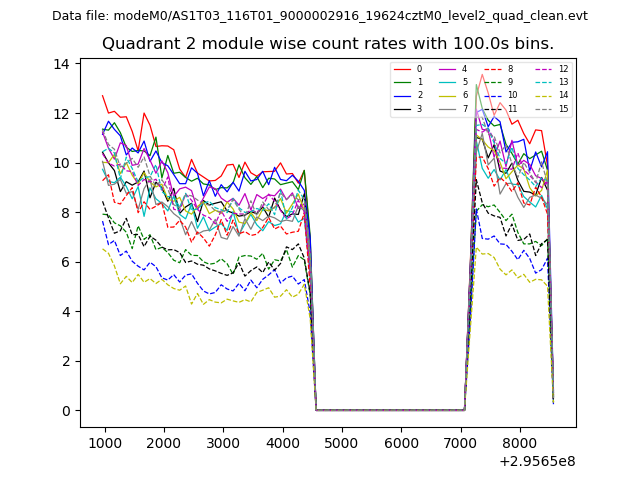
| Module-wise count rates for Quadrant B Data is divided into 100 sec bins |
 |
 |
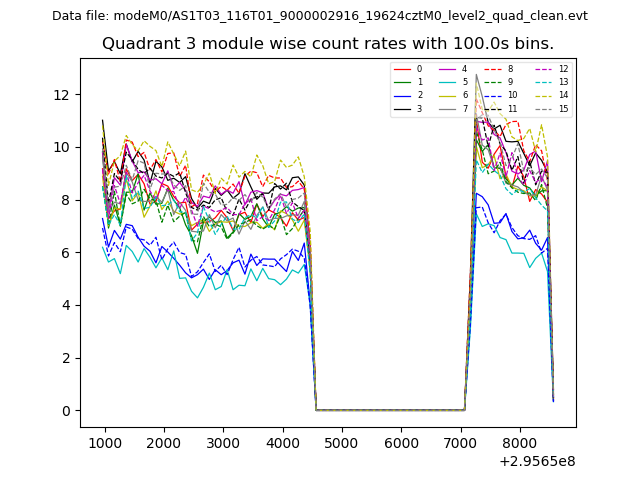
| Module-wise count rates for Quadrant C Data is divided into 100 sec bins |
 |
 |
| Module-wise count rates for Quadrant D Data is divided into 100 sec bins |
 |
 |
| Parameter | Plot |
|---|---|
| CZT HV Monitor | 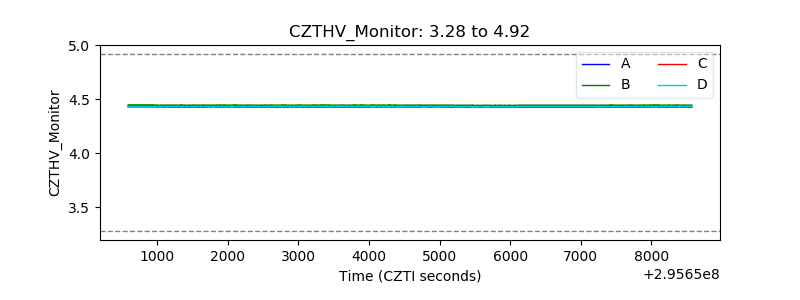 |
| D_VDD | 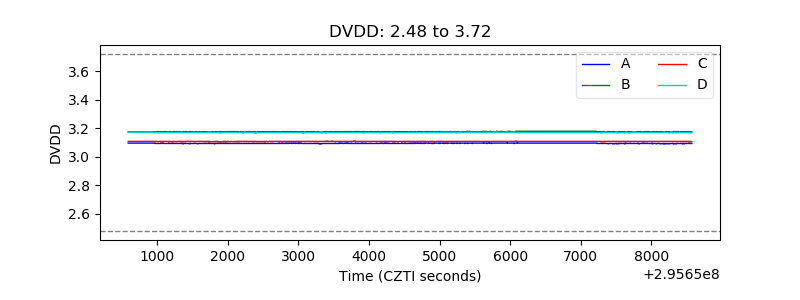 |
| Temperature 1 |  |
| Veto HV Monitor | 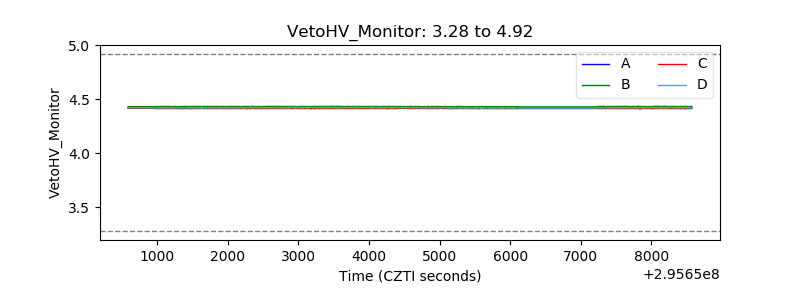 |
| Veto LLD | 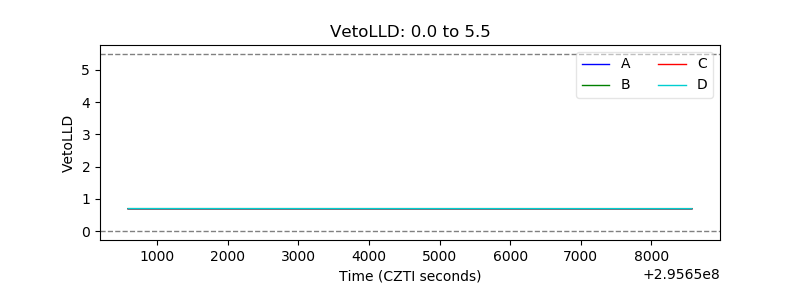 |
| Alpha Counter | 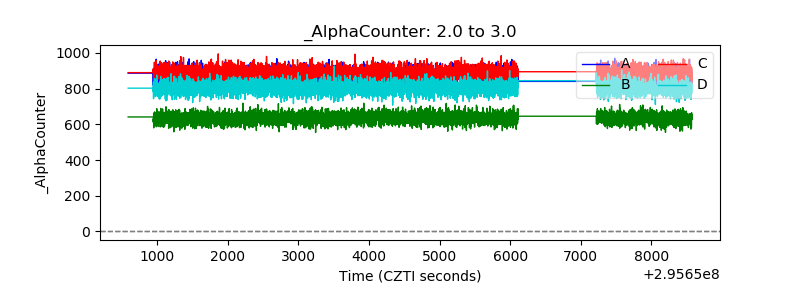 |
| _CPM_Rate | 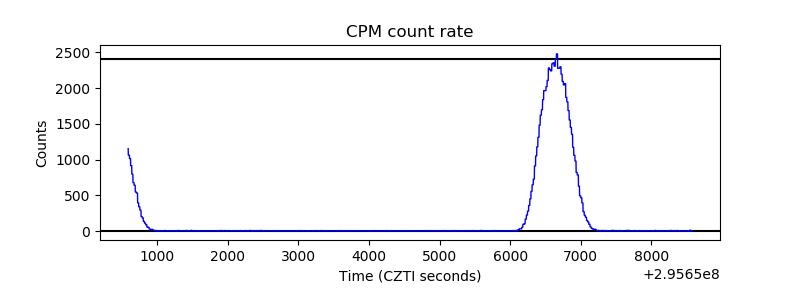 |
| CZT Counter | 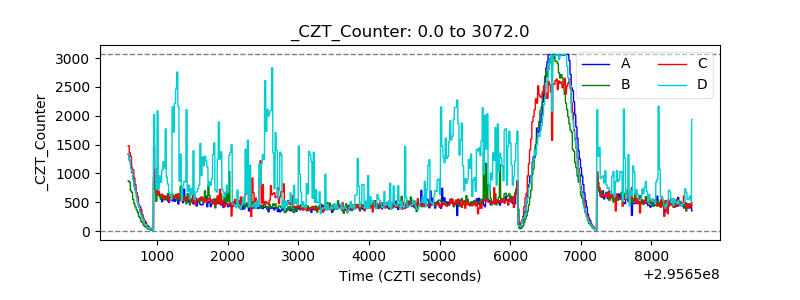 |
| +2.5 Volts monitor |  |
| +5 Volts monitor |  |
| _ROLL_ROT | 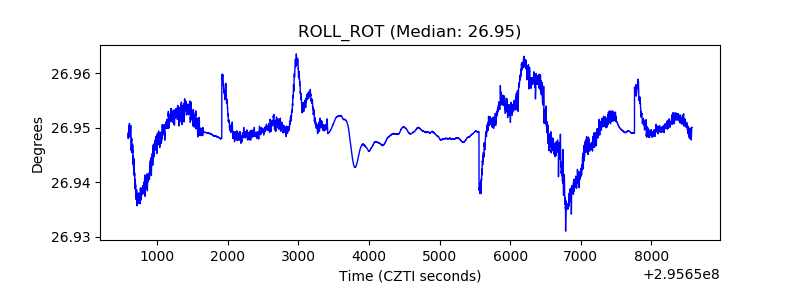 |
| _Roll_DEC |  |
| _Roll_RA | 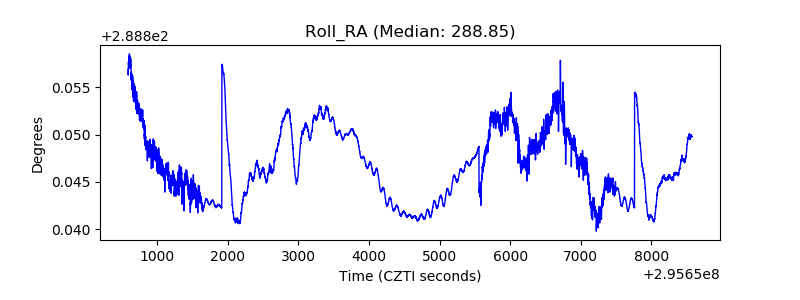 |
| Veto Counter | 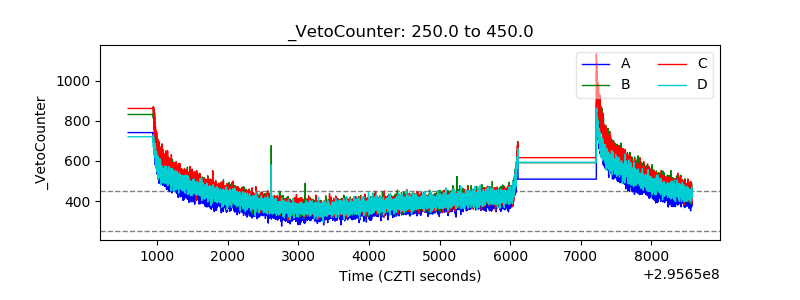 |