| Param | Original file | Final file |
|---|---|---|
| Filename | modeM0/AS1T03_116T01_9000002916_19625cztM0_level2.evt | modeM0/AS1T03_116T01_9000002916_19625cztM0_level2_quad_clean.evt |
| Size (bytes) | 478,863,360 | 99,720,000 |
| Size | 456.7 MB | 95.1 MB |
| Events in quadrant A | 3,103,495 | 654,061 |
| Events in quadrant B | 3,234,303 | 672,804 |
| Events in quadrant C | 3,202,490 | 638,932 |
| Events in quadrant D | 4,530,387 | 610,247 |
| Mode SS | |||
|---|---|---|---|
| Quadrant | BADHDUFLAG | Total packets | Discarded packets |
| A | 0 | 128 | 0 |
| B | 0 | 128 | 0 |
| C | 0 | 128 | 0 |
| D | 0 | 128 | 0 |
| Mode M0 | |||
|---|---|---|---|
| Quadrant | BADHDUFLAG | Total packets | Discarded packets |
| A | 0 | 13276 | 2 |
| B | 0 | 13598 | 2 |
| C | 0 | 13591 | 2 |
| D | 0 | 17578 | 3 |
| Mode M9 | |||
|---|---|---|---|
| Quadrant | BADHDUFLAG | Total packets | Discarded packets |
| A | 0 | 19 | 0 |
| B | 0 | 20 | 0 |
| C | 0 | 20 | 0 |
| D | 0 | 20 | 0 |
| Quadrant | Total seconds | Saturated seconds | Saturation percentage |
|---|---|---|---|
| A | 6365 | 37 | 0.581304% |
| B | 6365 | 62 | 0.974077% |
| C | 6365 | 65 | 1.021210% |
| D | 6364 | 188 | 2.954117% |
Noise dominated data is calculated using 1-second bins in cleaned event files. If a bin has >2000 counts, and if more than 50% of those come from <1% of pixels, then it is considered to be noise-dominated and hence unusable.
| Quadrant | # 1 sec bins | Bins with >0 counts | Bins with >2000 counts | High rate bins dominated by noise | Noise dominated (total time) | Noise dominated (detector-on time) | Marked lightcurve |
|---|---|---|---|---|---|---|---|
| A | 7600 | 6366 | 0 | 0 | 0.00% | 0.00% | 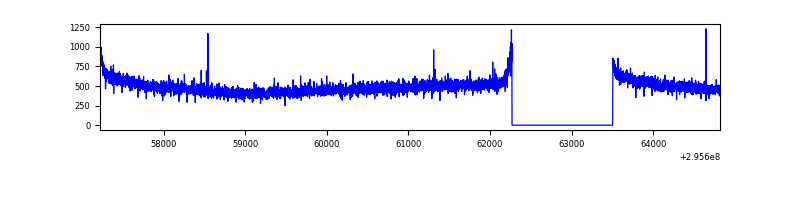 |
| B | 7600 | 6366 | 4 | 4 | 0.05% | 0.06% | 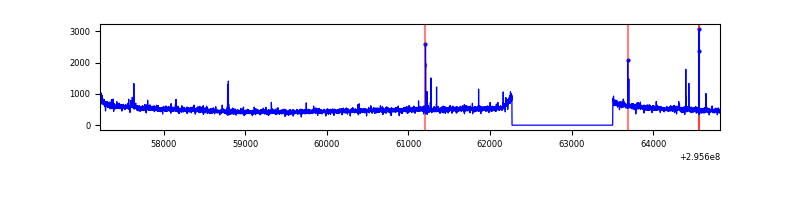 |
| C | 7600 | 6366 | 0 | 0 | 0.00% | 0.00% | 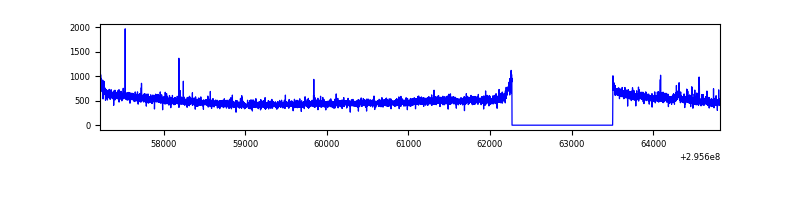 |
| D | 7599 | 6365 | 215 | 215 | 2.83% | 3.38% | 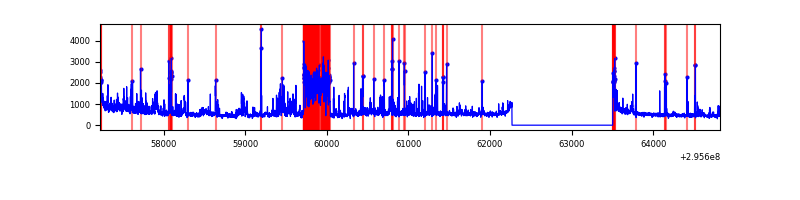 |
Top three noisy pixels from each quadrant. If the there are fewer than three noisy pixels in the level2.evt file, extra rows are filled as -1
| Pixel properties | Quadrant properties | ||||||
|---|---|---|---|---|---|---|---|
| Quadrant | DetID | PixID | Counts | Sigma | Mean | Median | Sigma |
| A | 0 | 226 | 6918 | 37.8 | 804 | 790 | 162.1 |
| A | 3 | 137 | 6139 | 33.0 | 804 | 790 | 162.1 |
| A | 13 | 254 | 5903 | 31.54 | 804 | 790 | 162.1 |
| B | 0 | 230 | 26098 | 164.59 | 809 | 790 | 153.8 |
| B | 12 | 111 | 18235 | 113.45 | 809 | 790 | 153.8 |
| B | 10 | 247 | 16840 | 104.38 | 809 | 790 | 153.8 |
| C | 14 | 238 | 123113 | 670.38 | 778 | 784 | 182.5 |
| C | 3 | 233 | 31783 | 169.88 | 778 | 784 | 182.5 |
| C | 8 | 208 | 12441 | 63.88 | 778 | 784 | 182.5 |
| D | 7 | 238 | 1060691 | 5655.15 | 773 | 752 | 187.4 |
| D | 1 | 52 | 508825 | 2710.75 | 773 | 752 | 187.4 |
| D | 2 | 234 | 23087 | 119.16 | 773 | 752 | 187.4 |
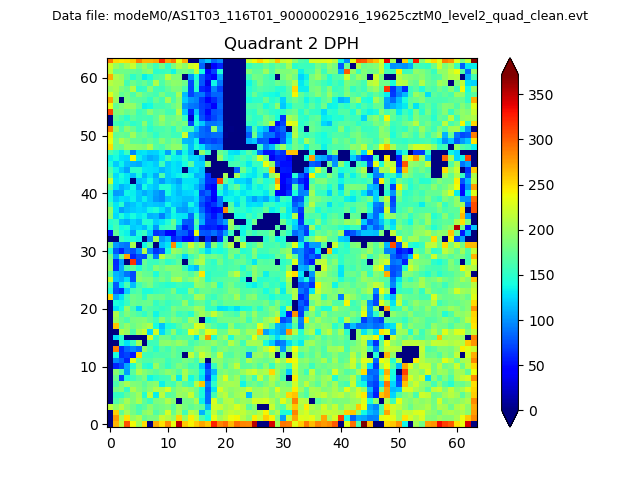
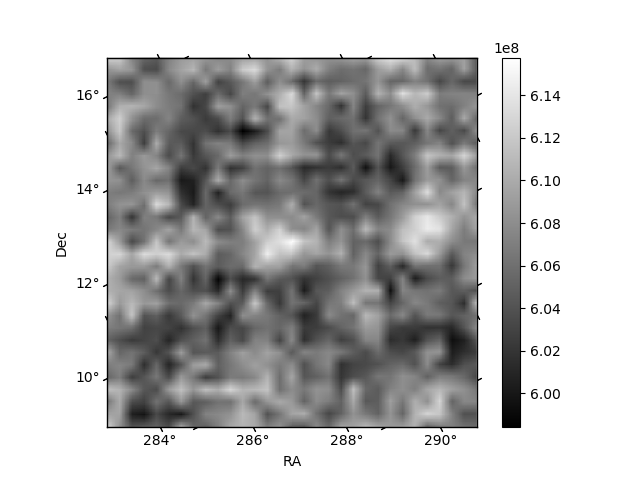
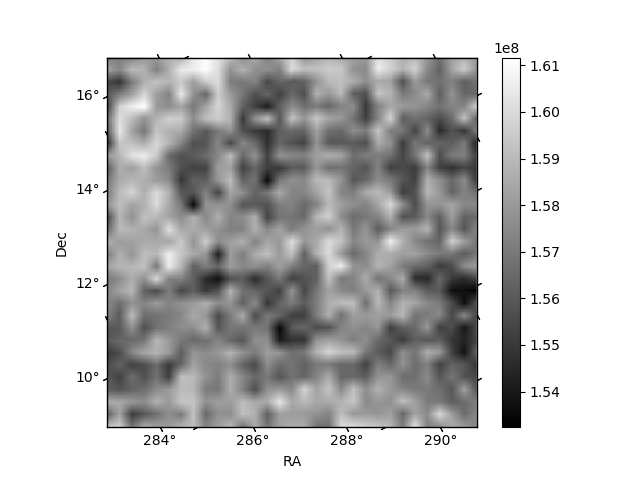
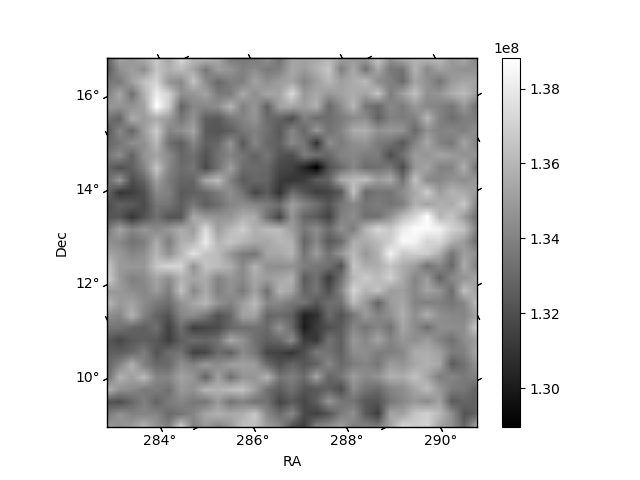
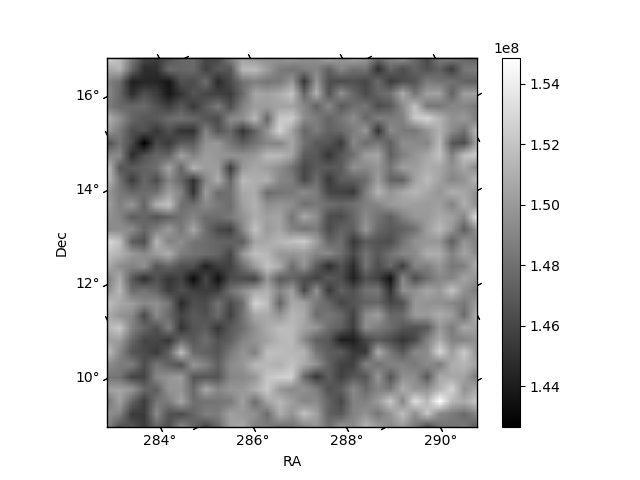
Histogram calculated using DETX and DETY for each event in the final _common_clean file
| Quadrant A | 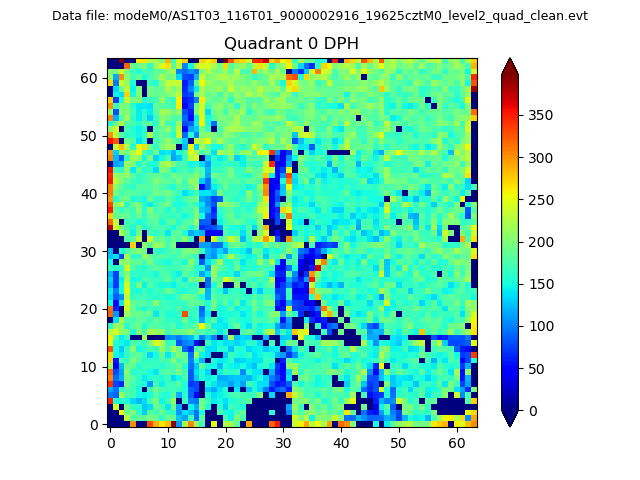 |
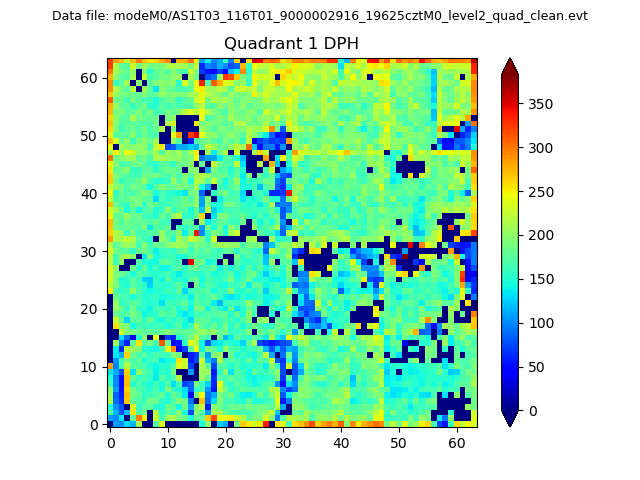 |
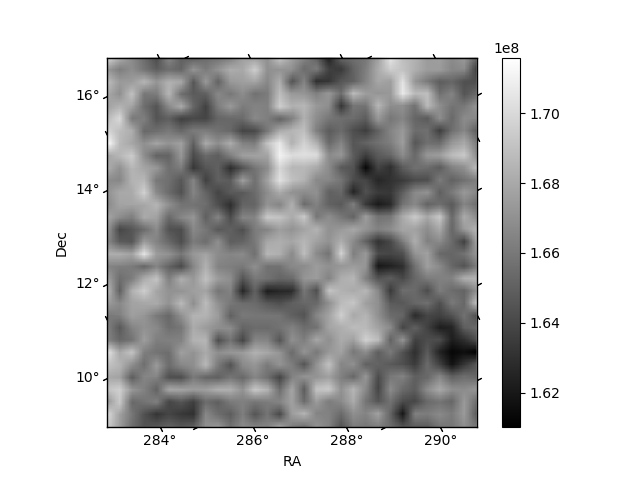
Quadrant B |
|---|---|---|---|
| Quadrant D | 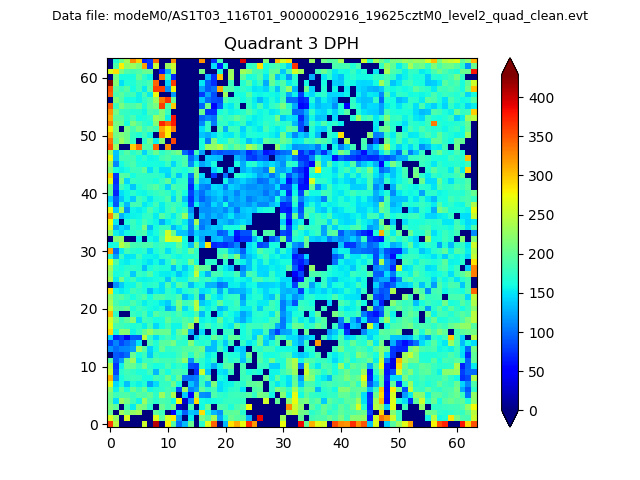 |
 |
Quadrant C |
| Plot type | Count rate plots | Images |
|---|---|---|
| Comparison with Poisson distribution Blue bars denote a histogram of data divided into 1 sec bins. Red curve is a Poisson curve with rate = median count rate of data. |
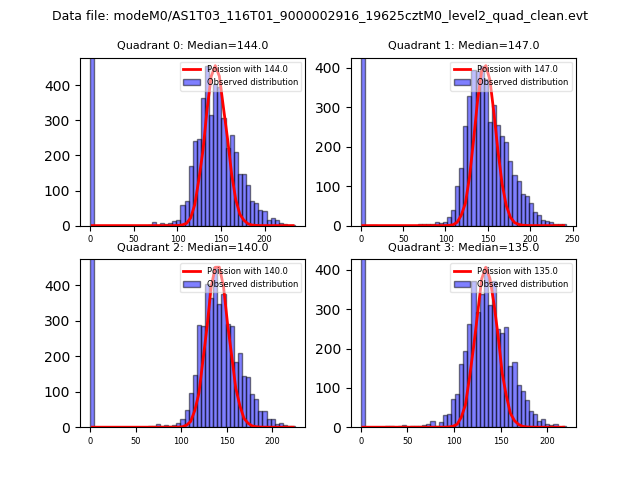 |
 |
| Quadrant-wise count rates Data is divided into 100 sec bins |
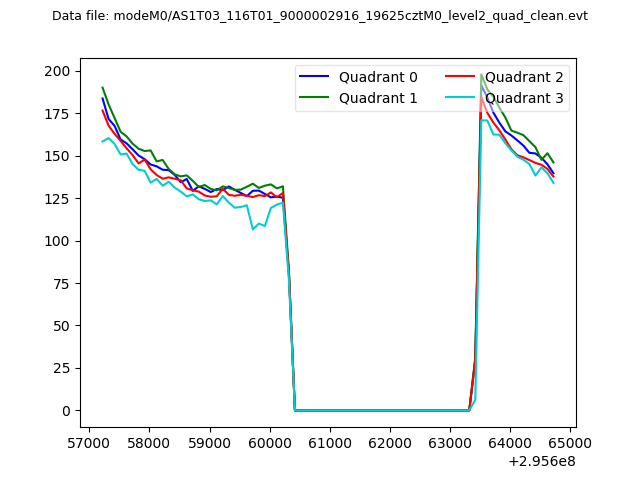 |
|
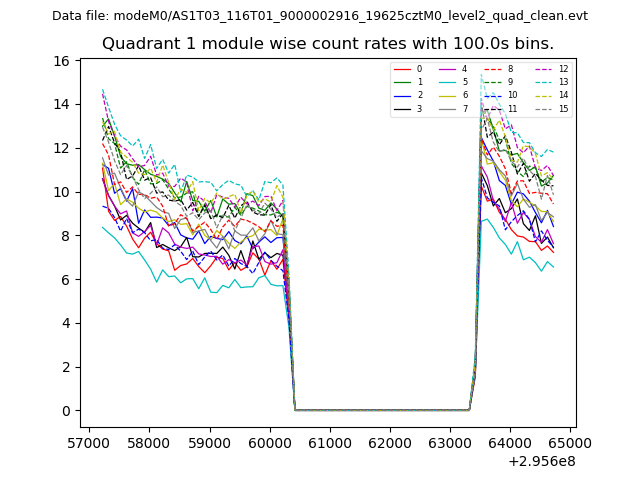
| Module-wise count rates for Quadrant A Data is divided into 100 sec bins |
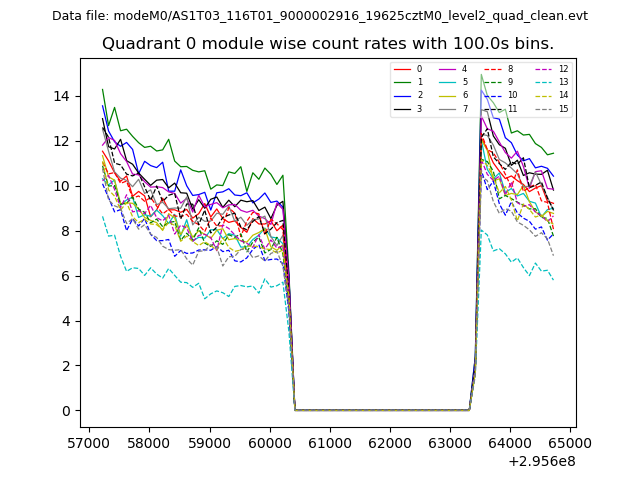 |
 |
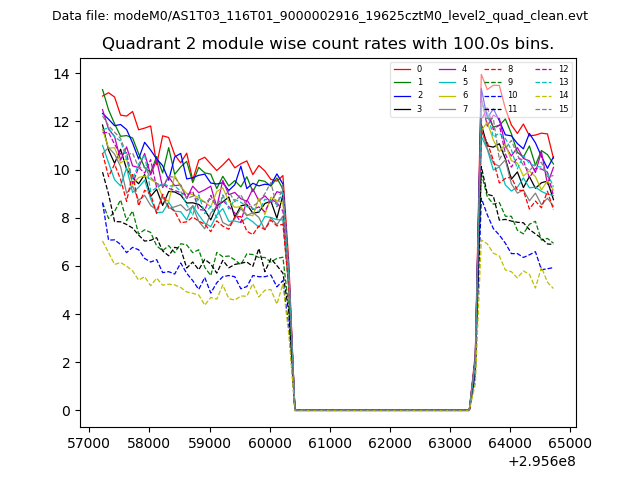
| Module-wise count rates for Quadrant B Data is divided into 100 sec bins |
 |
 |
| Module-wise count rates for Quadrant C Data is divided into 100 sec bins |
 |
 |
| Module-wise count rates for Quadrant D Data is divided into 100 sec bins |
 |
 |
| Parameter | Plot |
|---|---|
| CZT HV Monitor | 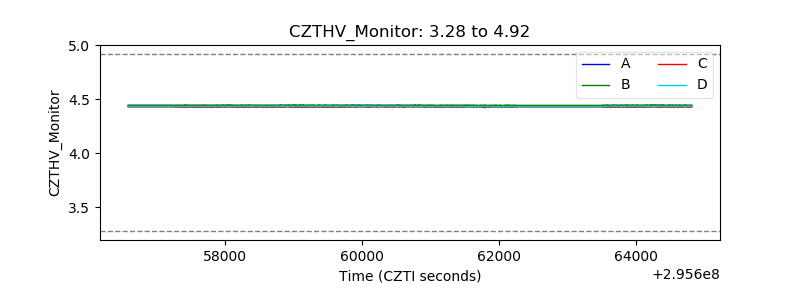 |
| D_VDD | 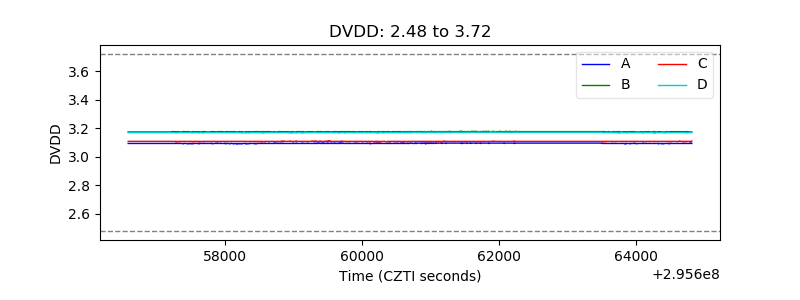 |
| Temperature 1 | 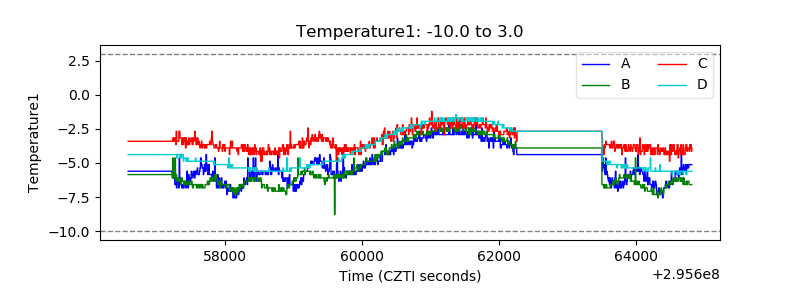 |
| Veto HV Monitor | 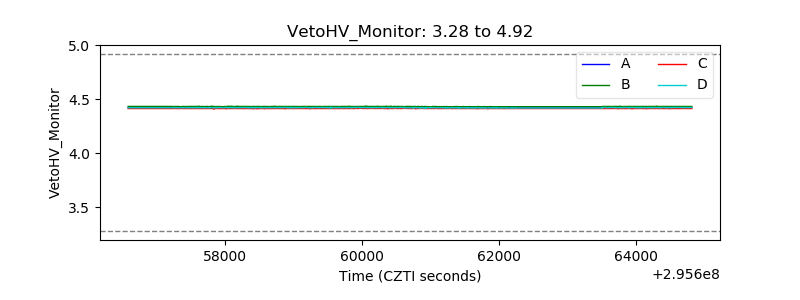 |
| Veto LLD | 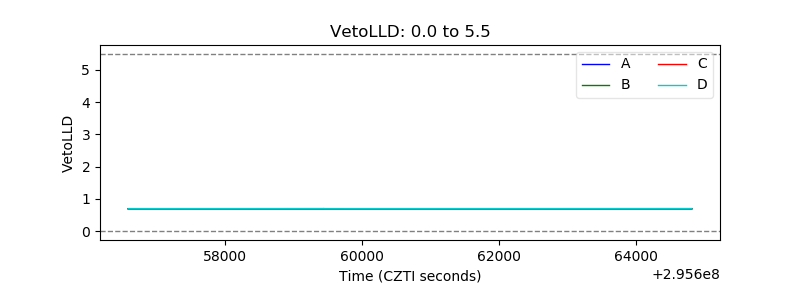 |
| Alpha Counter | 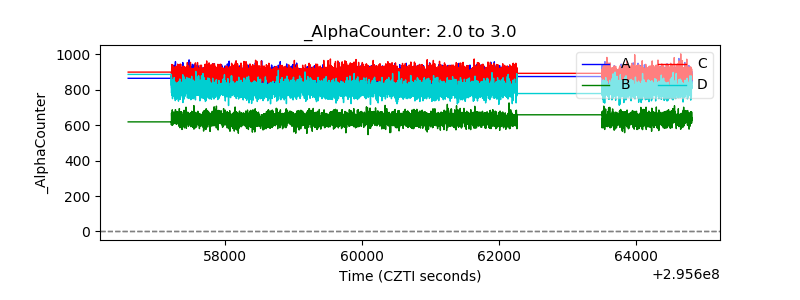 |
| _CPM_Rate | 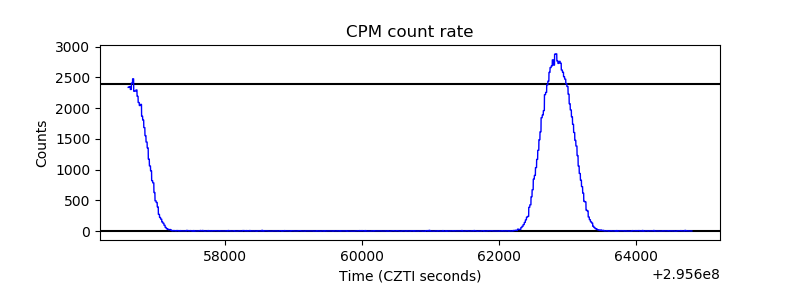 |
| CZT Counter | 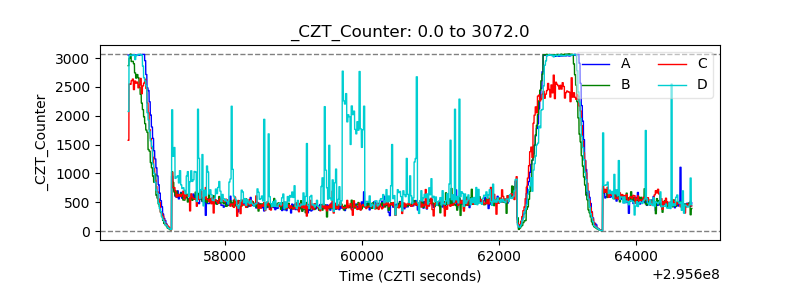 |
| +2.5 Volts monitor |  |
| +5 Volts monitor |  |
| _ROLL_ROT |  |
| _Roll_DEC | 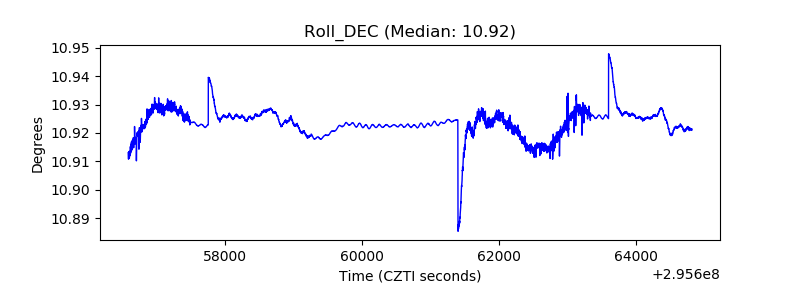 |
| _Roll_RA | 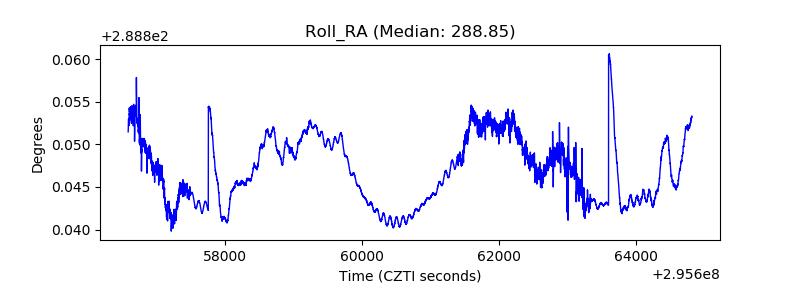 |
| Veto Counter |  |