| Param | Original file | Final file |
|---|---|---|
| Filename | modeM0/AS1T03_116T01_9000002916_19626cztM0_level2.evt | modeM0/AS1T03_116T01_9000002916_19626cztM0_level2_quad_clean.evt |
| Size (bytes) | 455,613,120 | 93,631,680 |
| Size | 434.5 MB | 89.3 MB |
| Events in quadrant A | 3,098,725 | 613,414 |
| Events in quadrant B | 3,253,701 | 630,258 |
| Events in quadrant C | 3,215,622 | 590,232 |
| Events in quadrant D | 3,811,951 | 571,706 |
| Mode SS | |||
|---|---|---|---|
| Quadrant | BADHDUFLAG | Total packets | Discarded packets |
| A | 0 | 124 | 0 |
| B | 0 | 124 | 0 |
| C | 0 | 124 | 0 |
| D | 0 | 124 | 0 |
| Mode M0 | |||
|---|---|---|---|
| Quadrant | BADHDUFLAG | Total packets | Discarded packets |
| A | 0 | 12931 | 2 |
| B | 0 | 13427 | 2 |
| C | 0 | 13282 | 2 |
| D | 0 | 15273 | 2 |
| Mode M9 | |||
|---|---|---|---|
| Quadrant | BADHDUFLAG | Total packets | Discarded packets |
| A | 0 | 22 | 0 |
| B | 0 | 23 | 0 |
| C | 0 | 23 | 0 |
| D | 0 | 23 | 0 |
| Quadrant | Total seconds | Saturated seconds | Saturation percentage |
|---|---|---|---|
| A | 6163 | 25 | 0.405647% |
| B | 6163 | 61 | 0.989778% |
| C | 6163 | 53 | 0.859971% |
| D | 6163 | 121 | 1.963330% |
Noise dominated data is calculated using 1-second bins in cleaned event files. If a bin has >2000 counts, and if more than 50% of those come from <1% of pixels, then it is considered to be noise-dominated and hence unusable.
| Quadrant | # 1 sec bins | Bins with >0 counts | Bins with >2000 counts | High rate bins dominated by noise | Noise dominated (total time) | Noise dominated (detector-on time) | Marked lightcurve |
|---|---|---|---|---|---|---|---|
| A | 7483 | 6164 | 0 | 0 | 0.00% | 0.00% | 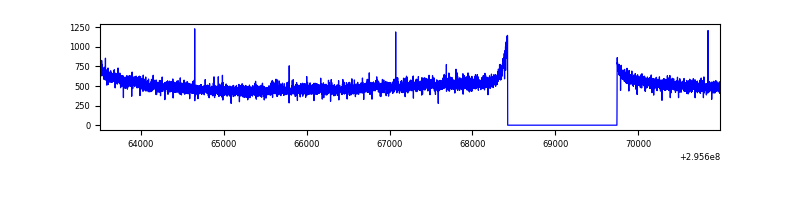 |
| B | 7483 | 6164 | 13 | 13 | 0.17% | 0.21% | 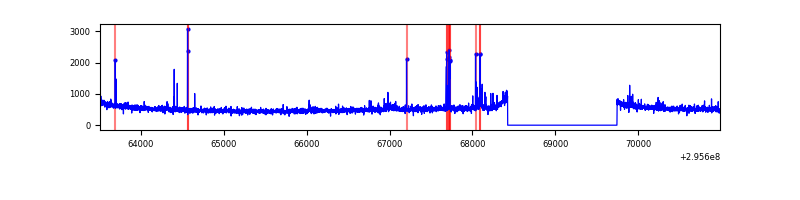 |
| C | 7483 | 6164 | 0 | 0 | 0.00% | 0.00% | 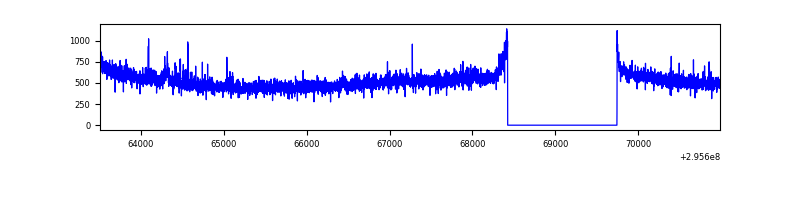 |
| D | 7483 | 6164 | 70 | 70 | 0.94% | 1.14% | 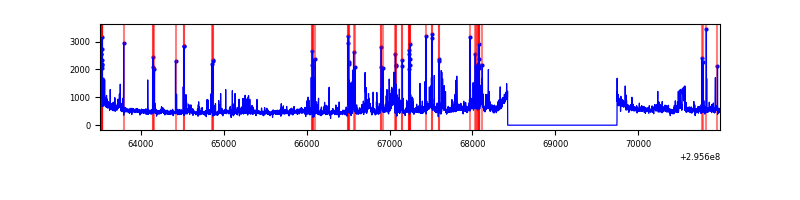 |
Top three noisy pixels from each quadrant. If the there are fewer than three noisy pixels in the level2.evt file, extra rows are filled as -1
| Pixel properties | Quadrant properties | ||||||
|---|---|---|---|---|---|---|---|
| Quadrant | DetID | PixID | Counts | Sigma | Mean | Median | Sigma |
| A | 11 | 47 | 7082 | 39.32 | 802 | 789 | 160.1 |
| A | 0 | 226 | 6917 | 38.29 | 802 | 789 | 160.1 |
| A | 13 | 254 | 6469 | 35.49 | 802 | 789 | 160.1 |
| B | 3 | 64 | 35000 | 225.66 | 802 | 785 | 151.6 |
| B | 7 | 220 | 33447 | 215.42 | 802 | 785 | 151.6 |
| B | 0 | 230 | 18940 | 119.74 | 802 | 785 | 151.6 |
| C | 14 | 238 | 121275 | 673.73 | 765 | 772 | 178.9 |
| C | 3 | 233 | 100477 | 557.45 | 765 | 772 | 178.9 |
| C | 8 | 208 | 8794 | 44.85 | 765 | 772 | 178.9 |
| D | 1 | 52 | 543224 | 2901.54 | 767 | 747 | 187.0 |
| D | 12 | 218 | 280333 | 1495.42 | 767 | 747 | 187.0 |
| D | 7 | 238 | 96497 | 512.14 | 767 | 747 | 187.0 |
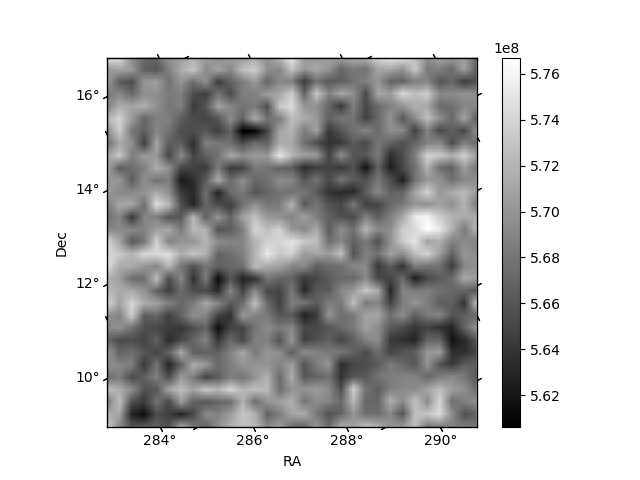
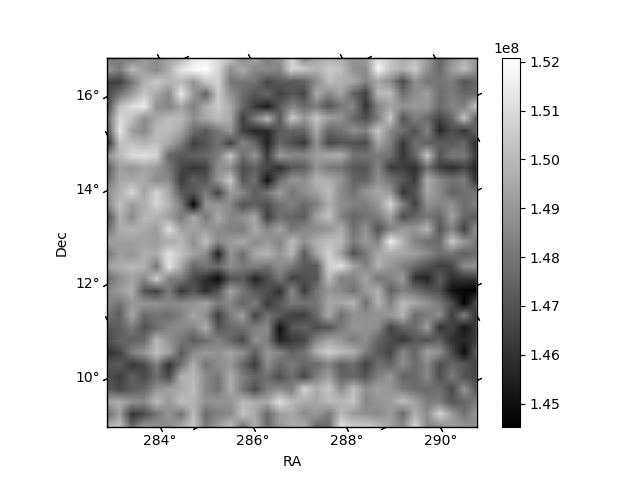
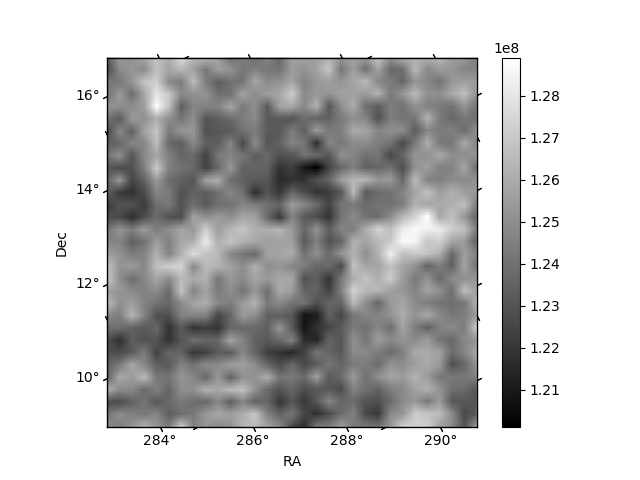
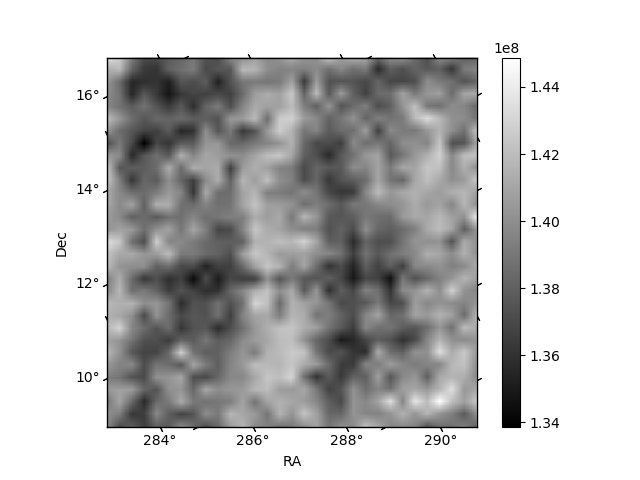
Histogram calculated using DETX and DETY for each event in the final _common_clean file
| Quadrant A | 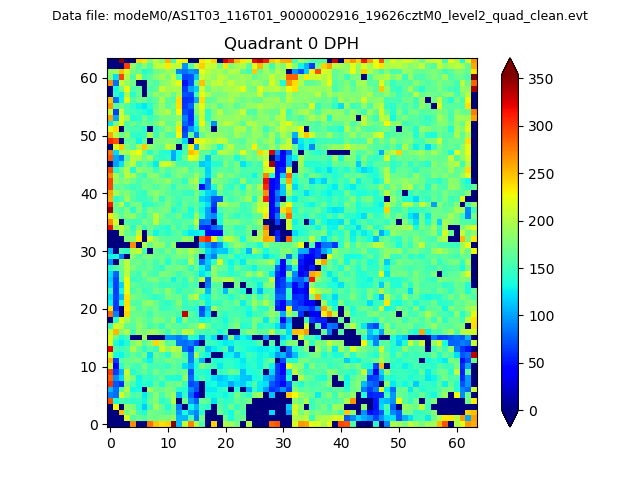 |
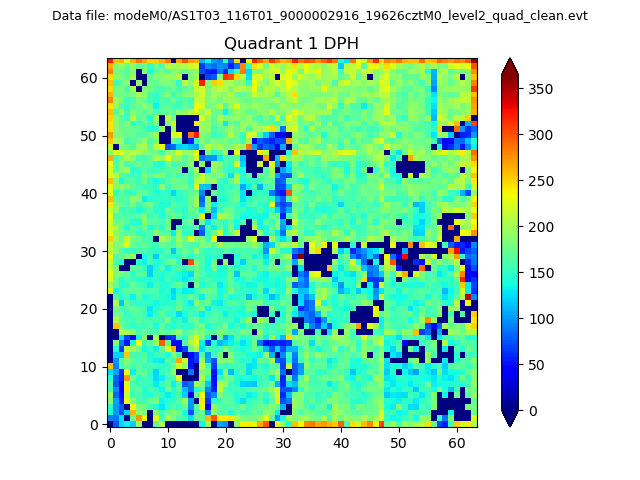 |
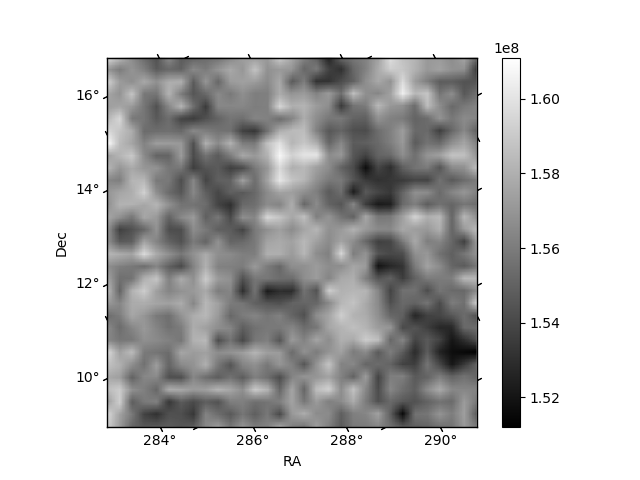
Quadrant B |
|---|---|---|---|
| Quadrant D | 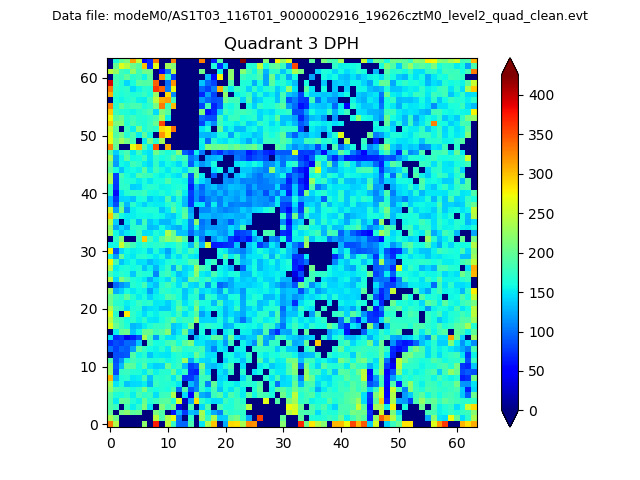 |
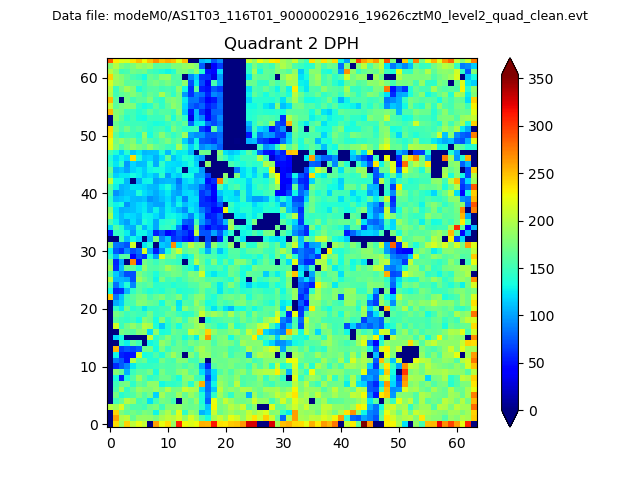 |
Quadrant C |
| Plot type | Count rate plots | Images |
|---|---|---|
| Comparison with Poisson distribution Blue bars denote a histogram of data divided into 1 sec bins. Red curve is a Poisson curve with rate = median count rate of data. |
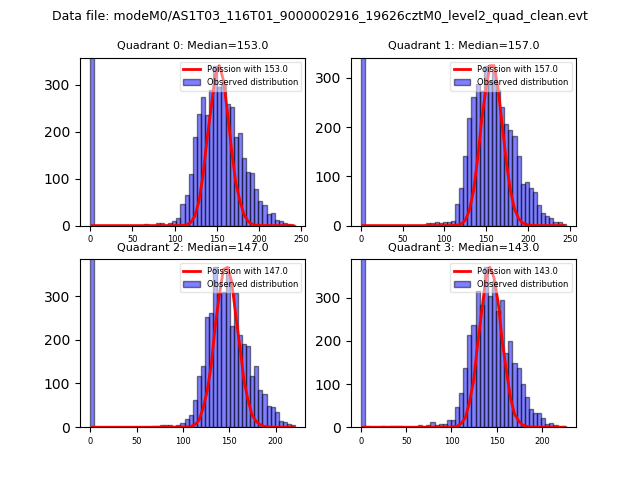 |
 |
| Quadrant-wise count rates Data is divided into 100 sec bins |
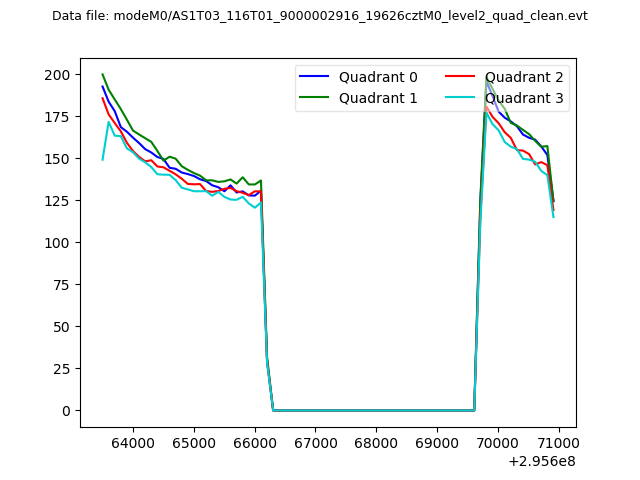 |
|
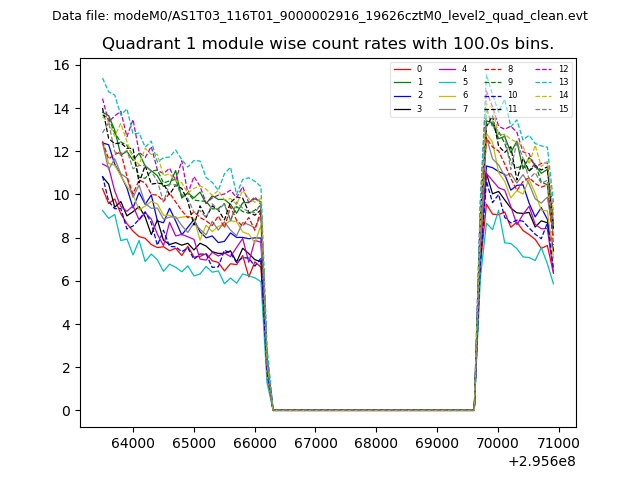
| Module-wise count rates for Quadrant A Data is divided into 100 sec bins |
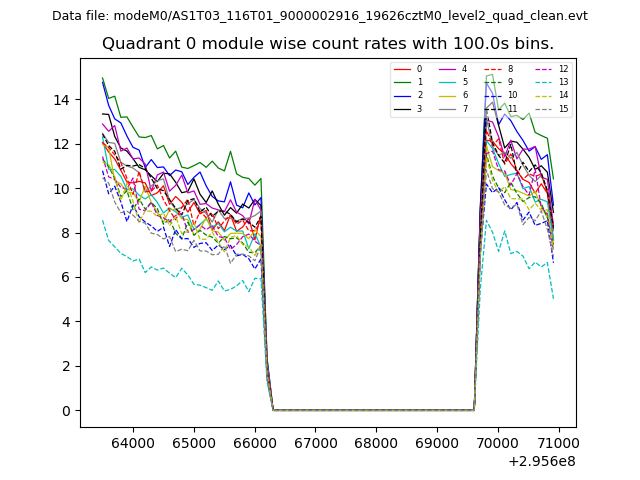 |
 |
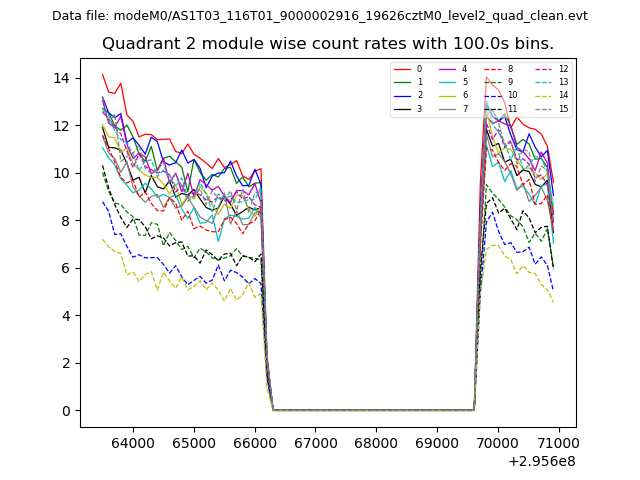
| Module-wise count rates for Quadrant B Data is divided into 100 sec bins |
 |
 |
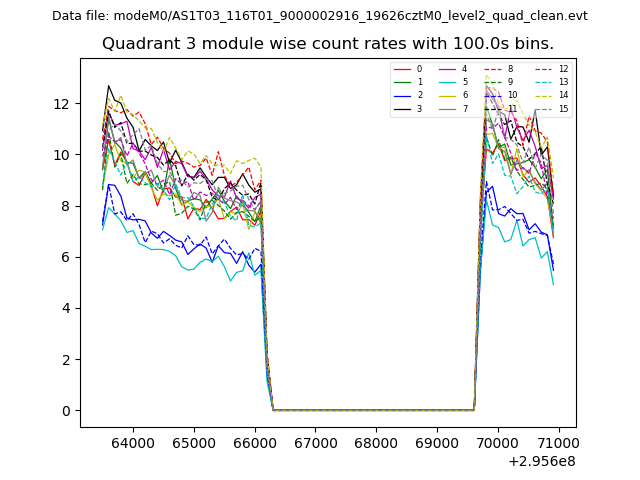
| Module-wise count rates for Quadrant C Data is divided into 100 sec bins |
 |
 |
| Module-wise count rates for Quadrant D Data is divided into 100 sec bins |
 |
 |
| Parameter | Plot |
|---|---|
| CZT HV Monitor | 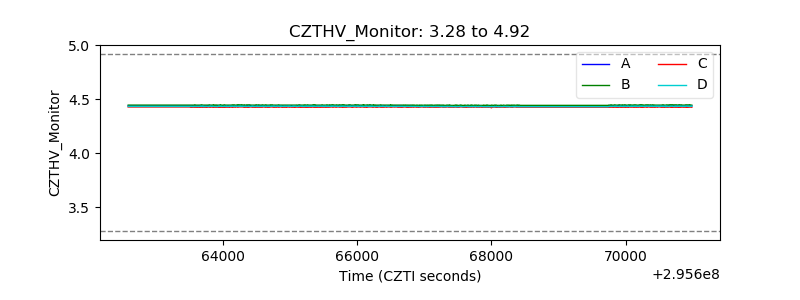 |
| D_VDD | 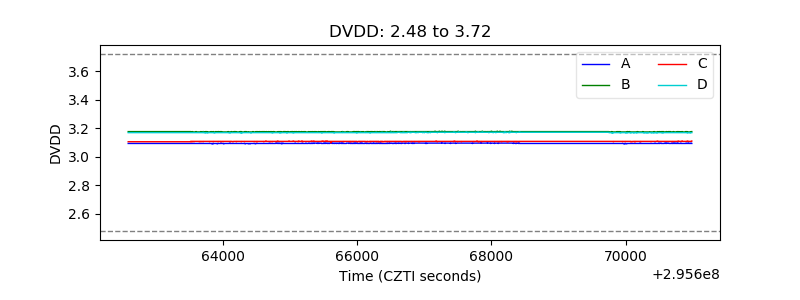 |
| Temperature 1 |  |
| Veto HV Monitor | 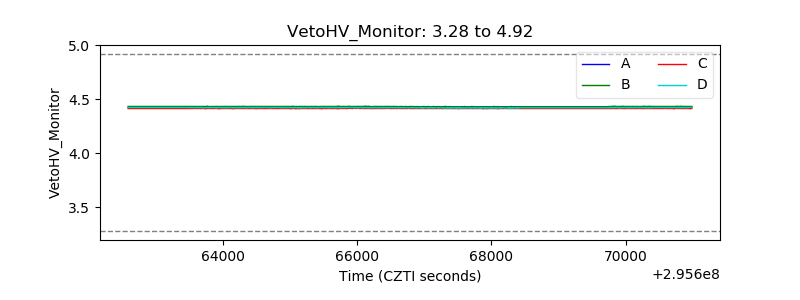 |
| Veto LLD | 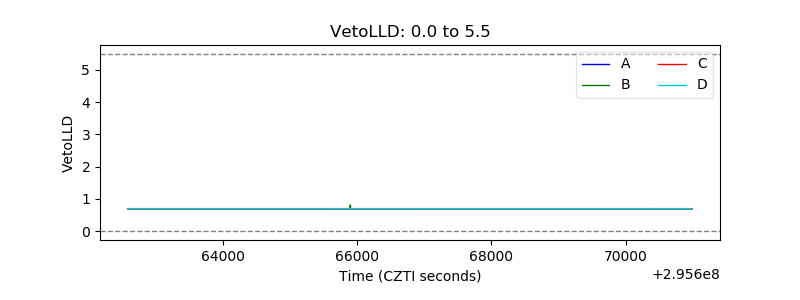 |
| Alpha Counter | 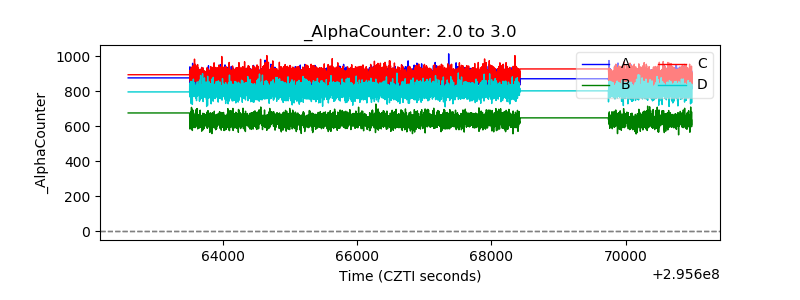 |
| _CPM_Rate | 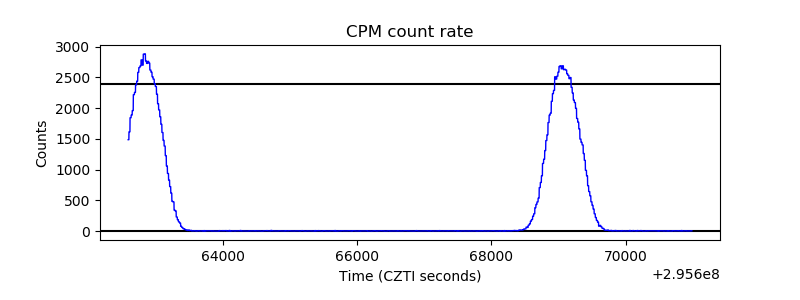 |
| CZT Counter |  |
| +2.5 Volts monitor |  |
| +5 Volts monitor |  |
| _ROLL_ROT | 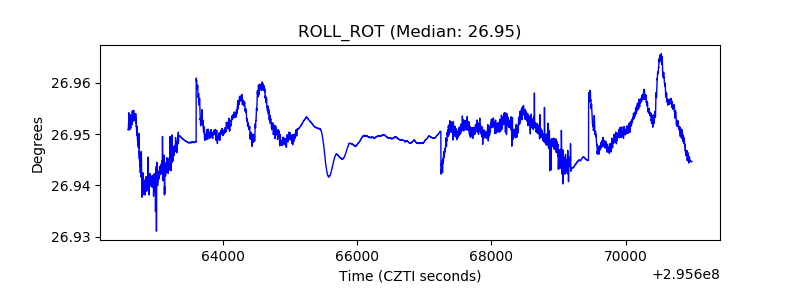 |
| _Roll_DEC | 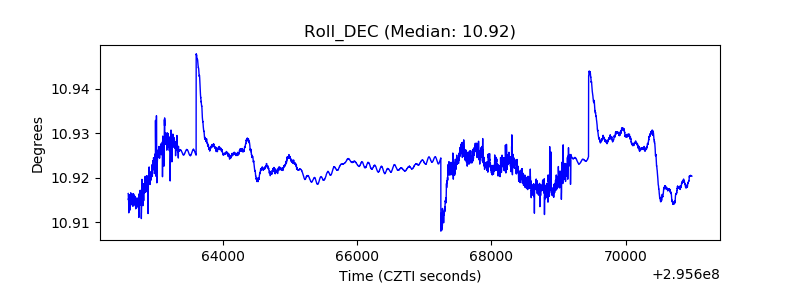 |
| _Roll_RA | 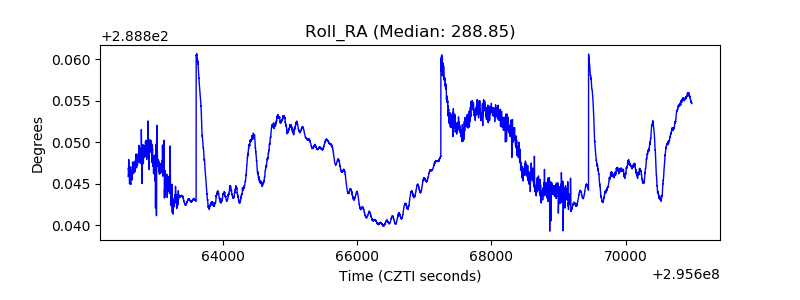 |
| Veto Counter | 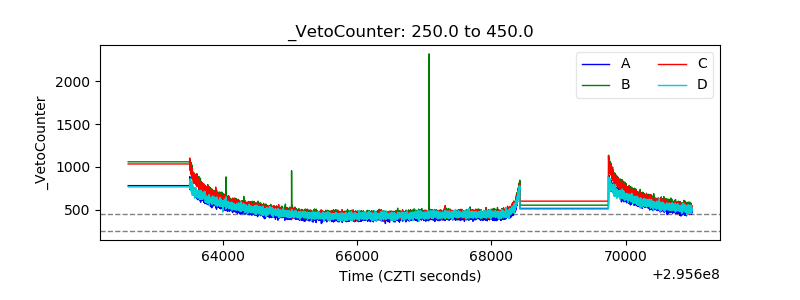 |