| Param | Original file | Final file |
|---|---|---|
| Filename | modeM0/AS1T03_116T01_9000002916_19628cztM0_level2.evt | modeM0/AS1T03_116T01_9000002916_19628cztM0_level2_quad_clean.evt |
| Size (bytes) | 617,103,360 | 98,026,560 |
| Size | 588.5 MB | 93.5 MB |
| Events in quadrant A | 3,352,742 | 658,973 |
| Events in quadrant B | 3,429,492 | 664,647 |
| Events in quadrant C | 3,527,204 | 621,735 |
| Events in quadrant D | 7,934,311 | 564,403 |
| Mode SS | |||
|---|---|---|---|
| Quadrant | BADHDUFLAG | Total packets | Discarded packets |
| A | 0 | 134 | 0 |
| B | 0 | 134 | 0 |
| C | 0 | 134 | 0 |
| D | 0 | 134 | 0 |
| Mode M0 | |||
|---|---|---|---|
| Quadrant | BADHDUFLAG | Total packets | Discarded packets |
| A | 0 | 13775 | 2 |
| B | 0 | 14024 | 2 |
| C | 0 | 14263 | 3 |
| D | 0 | 28067 | 2 |
| Mode M9 | |||
|---|---|---|---|
| Quadrant | BADHDUFLAG | Total packets | Discarded packets |
| A | 0 | 18 | 0 |
| B | 0 | 19 | 0 |
| C | 0 | 19 | 0 |
| D | 0 | 19 | 0 |
| Quadrant | Total seconds | Saturated seconds | Saturation percentage |
|---|---|---|---|
| A | 6582 | 67 | 1.017928% |
| B | 6582 | 99 | 1.504102% |
| C | 6581 | 123 | 1.869017% |
| D | 6581 | 1458 | 22.154688% |
Noise dominated data is calculated using 1-second bins in cleaned event files. If a bin has >2000 counts, and if more than 50% of those come from <1% of pixels, then it is considered to be noise-dominated and hence unusable.
| Quadrant | # 1 sec bins | Bins with >0 counts | Bins with >2000 counts | High rate bins dominated by noise | Noise dominated (total time) | Noise dominated (detector-on time) | Marked lightcurve |
|---|---|---|---|---|---|---|---|
| A | 7867 | 6584 | 0 | 0 | 0.00% | 0.00% | 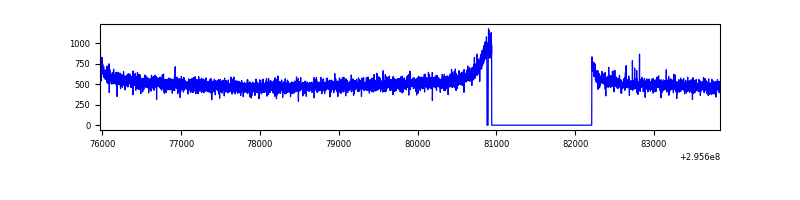 |
| B | 7867 | 6583 | 7 | 7 | 0.09% | 0.11% | 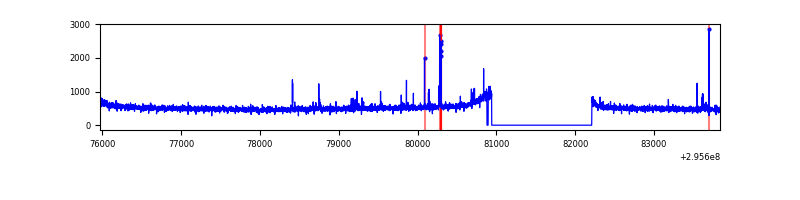 |
| C | 7866 | 6583 | 6 | 6 | 0.08% | 0.09% | 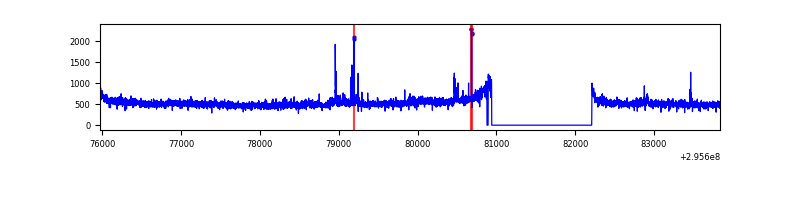 |
| D | 7866 | 6582 | 1271 | 1271 | 16.16% | 19.31% | 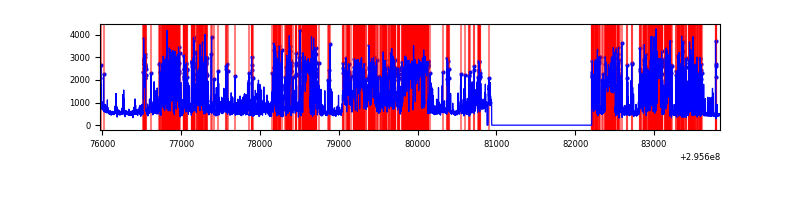 |
Top three noisy pixels from each quadrant. If the there are fewer than three noisy pixels in the level2.evt file, extra rows are filled as -1
| Pixel properties | Quadrant properties | ||||||
|---|---|---|---|---|---|---|---|
| Quadrant | DetID | PixID | Counts | Sigma | Mean | Median | Sigma |
| A | 0 | 226 | 7726 | 39.42 | 871 | 859 | 174.2 |
| A | 13 | 254 | 6906 | 34.72 | 871 | 859 | 174.2 |
| A | 3 | 137 | 6376 | 31.67 | 871 | 859 | 174.2 |
| B | 7 | 220 | 37342 | 227.31 | 857 | 838 | 160.6 |
| B | 12 | 111 | 18968 | 112.89 | 857 | 838 | 160.6 |
| B | 11 | 111 | 16729 | 98.95 | 857 | 838 | 160.6 |
| C | 3 | 233 | 200740 | 1058.63 | 814 | 821 | 188.8 |
| C | 14 | 238 | 130536 | 686.88 | 814 | 821 | 188.8 |
| C | 9 | 54 | 16174 | 81.3 | 814 | 821 | 188.8 |
| D | 12 | 218 | 3592160 | 19473.53 | 760 | 738 | 184.4 |
| D | 1 | 52 | 704047 | 3813.51 | 760 | 738 | 184.4 |
| D | 12 | 233 | 551618 | 2987.0 | 760 | 738 | 184.4 |
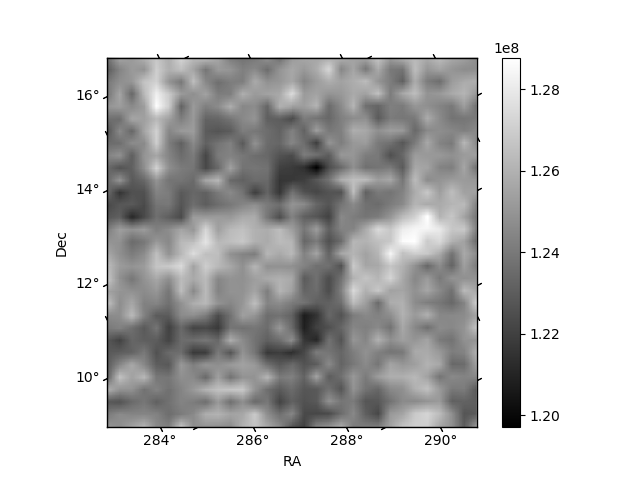
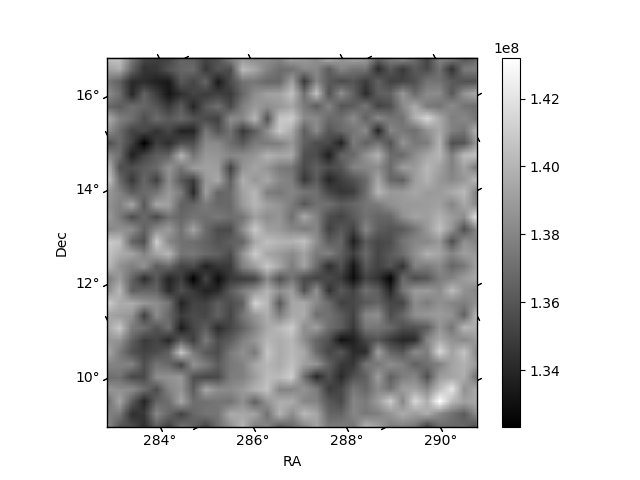
Histogram calculated using DETX and DETY for each event in the final _common_clean file
| Quadrant A |  |
 |
Quadrant B |
|---|---|---|---|
| Quadrant D |  |
 |
Quadrant C |
| Plot type | Count rate plots | Images |
|---|---|---|
| Comparison with Poisson distribution Blue bars denote a histogram of data divided into 1 sec bins. Red curve is a Poisson curve with rate = median count rate of data. |
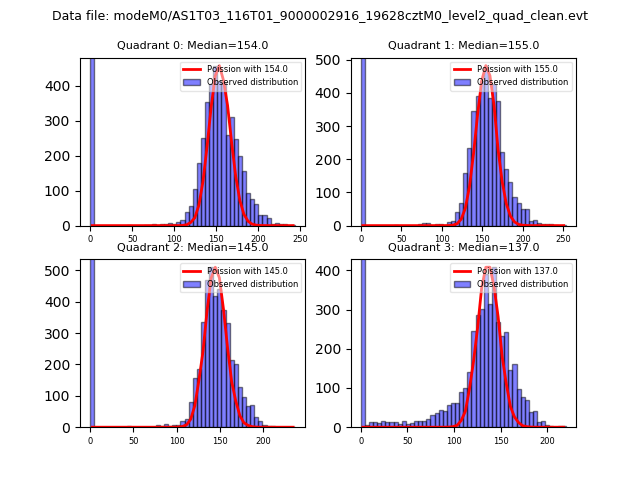 |
 |
| Quadrant-wise count rates Data is divided into 100 sec bins |
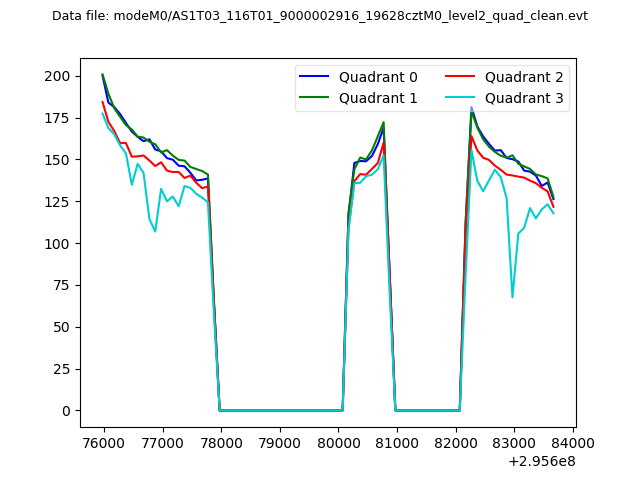 |
|
| Module-wise count rates for Quadrant A Data is divided into 100 sec bins |
 |
 |
| Module-wise count rates for Quadrant B Data is divided into 100 sec bins |
 |
 |
| Module-wise count rates for Quadrant C Data is divided into 100 sec bins |
 |
 |
| Module-wise count rates for Quadrant D Data is divided into 100 sec bins |
 |
 |
| Parameter | Plot |
|---|---|
| CZT HV Monitor |  |
| D_VDD |  |
| Temperature 1 |  |
| Veto HV Monitor |  |
| Veto LLD |  |
| Alpha Counter | 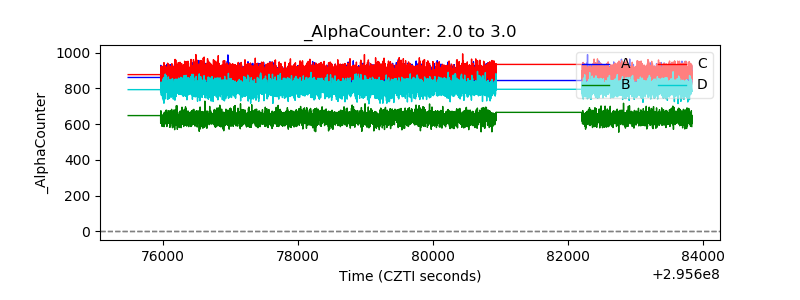 |
| _CPM_Rate | 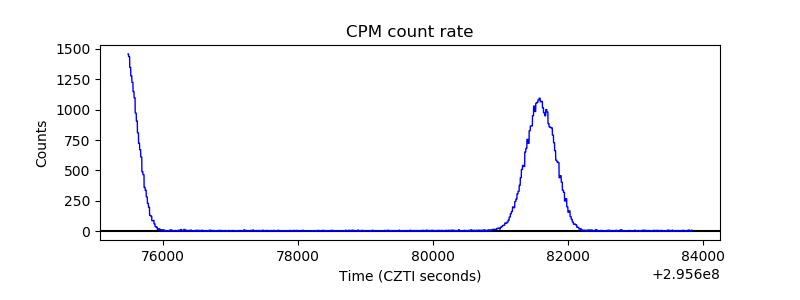 |
| CZT Counter |  |
| +2.5 Volts monitor |  |
| +5 Volts monitor |  |
| _ROLL_ROT |  |
| _Roll_DEC |  |
| _Roll_RA |  |
| Veto Counter |  |