| Param | Original file | Final file |
|---|---|---|
| Filename | modeM0/AS1A05_012T01_9000002918cztM0_level2.fits | modeM0/AS1A05_012T01_9000002918cztM0_level2_quad_clean.evt |
| Size (bytes) | 214,283,520 | 215,850,240 |
| Size | 204.4 MB | 205.9 MB |
| Events in quadrant A | 1,310,766 | 1,322,625 |
| Events in quadrant B | 1,247,000 | 1,288,065 |
| Events in quadrant C | 1,269,212 | 1,242,046 |
| Events in quadrant D | 1,103,508 | 1,125,823 |
| Mode M0 | |||
|---|---|---|---|
| Quadrant | BADHDUFLAG | Total packets | Discarded packets |
| A | 0 | 48164 | 0 |
| B | 0 | 54776 | 0 |
| C | 0 | 47885 | 0 |
| D | 0 | 60535 | 0 |
| Mode SS | |||
|---|---|---|---|
| Quadrant | BADHDUFLAG | Total packets | Discarded packets |
| A | 0 | 458 | 0 |
| B | 0 | 458 | 0 |
| C | 0 | 458 | 0 |
| D | 0 | 458 | 0 |
| Mode M9 | |||
|---|---|---|---|
| Quadrant | BADHDUFLAG | Total packets | Discarded packets |
| A | 0 | 13 | 0 |
| B | 0 | 13 | 0 |
| C | 0 | 13 | 0 |
| D | 0 | 13 | 0 |
| Quadrant | Total seconds | Saturated seconds | Saturation percentage |
|---|---|---|---|
| A | 22636 | 792 | 3.498851% |
| B | 22636 | 1151 | 5.084821% |
| C | 22636 | 834 | 3.684397% |
| D | 22636 | 1288 | 5.690051% |
Noise dominated data is calculated using 1-second bins in cleaned event files. If a bin has >2000 counts, and if more than 50% of those come from <1% of pixels, then it is considered to be noise-dominated and hence unusable.
| Quadrant | # 1 sec bins | Bins with >0 counts | Bins with >2000 counts | High rate bins dominated by noise | Noise dominated (total time) | Noise dominated (detector-on time) | Marked lightcurve |
|---|---|---|---|---|---|---|---|
| A | 27817 | 22633 | 0 | 0 | 0.00% | 0.00% |  |
| B | 27817 | 22632 | 0 | 0 | 0.00% | 0.00% |  |
| C | 27817 | 22633 | 0 | 0 | 0.00% | 0.00% |  |
| D | 27817 | 22630 | 0 | 0 | 0.00% | 0.00% |  |
Top three noisy pixels from each quadrant. If the there are fewer than three noisy pixels in the level2.evt file, extra rows are filled as -1
| Pixel properties | Quadrant properties | ||||||
|---|---|---|---|---|---|---|---|
| Quadrant | DetID | PixID | Counts | Sigma | Mean | Median | Sigma |
| A | 0 | 29 | 1250 | 10.83 | 340 | 317 | 86.1 |
| A | 7 | 110 | 1049 | 8.5 | 340 | 317 | 86.1 |
| A | 9 | 19 | 988 | 7.79 | 340 | 317 | 86.1 |
| B | 2 | 9 | 933 | 9.14 | 329 | 312 | 67.9 |
| B | 14 | 254 | 847 | 7.88 | 329 | 312 | 67.9 |
| B | 3 | 17 | 823 | 7.52 | 329 | 312 | 67.9 |
| C | 12 | 249 | 907 | 6.79 | 335 | 310 | 87.9 |
| C | 12 | 241 | 898 | 6.69 | 335 | 310 | 87.9 |
| C | 9 | 233 | 891 | 6.61 | 335 | 310 | 87.9 |
| D | 15 | 46 | 789 | 5.76 | 315 | 285 | 87.5 |
| D | 3 | 14 | 788 | 5.75 | 315 | 285 | 87.5 |
| D | 3 | 31 | 780 | 5.66 | 315 | 285 | 87.5 |
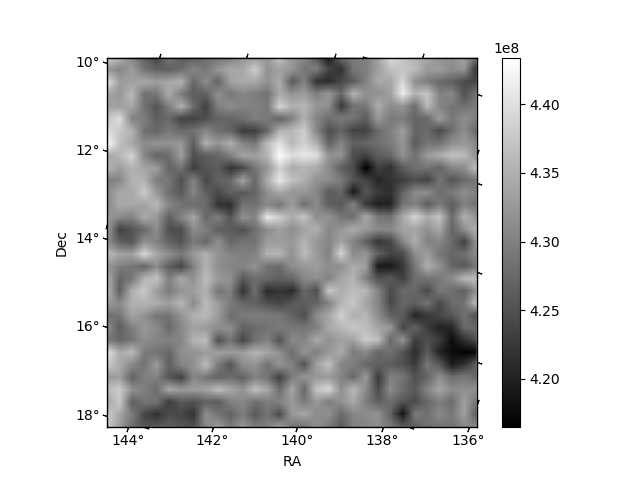
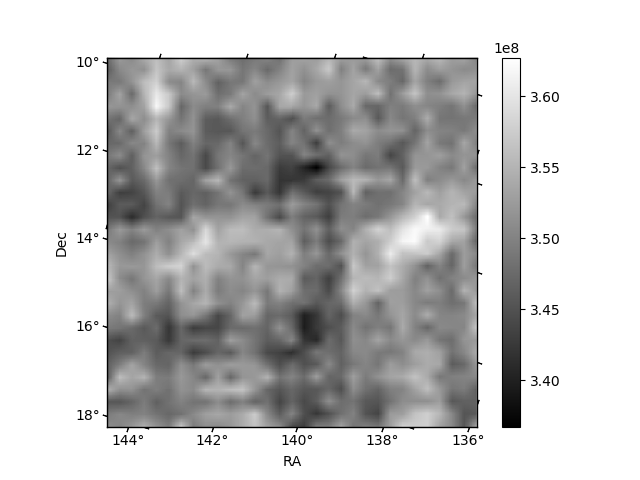
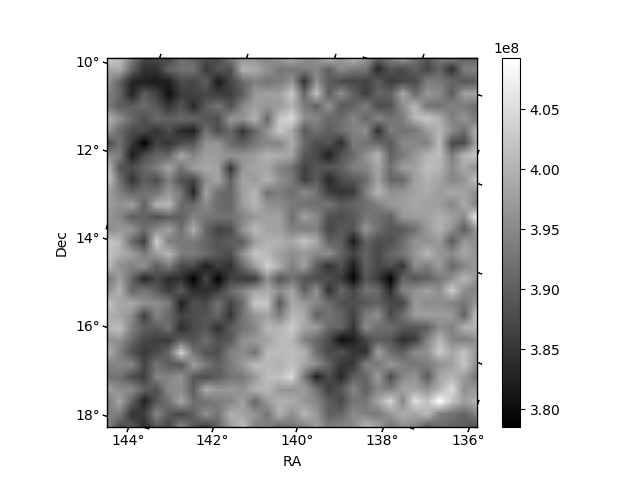
Histogram calculated using DETX and DETY for each event in the final _common_clean file
| Quadrant A | 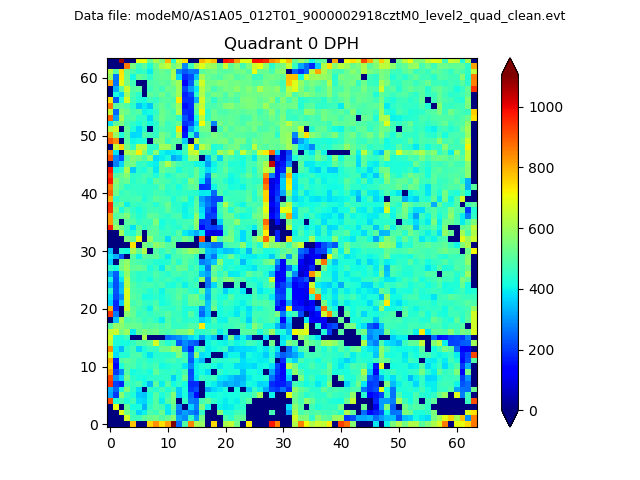 |
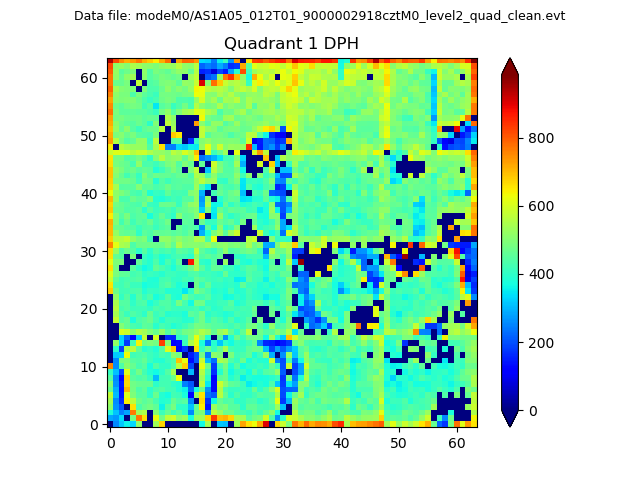 |
Quadrant B |
|---|---|---|---|
| Quadrant D | 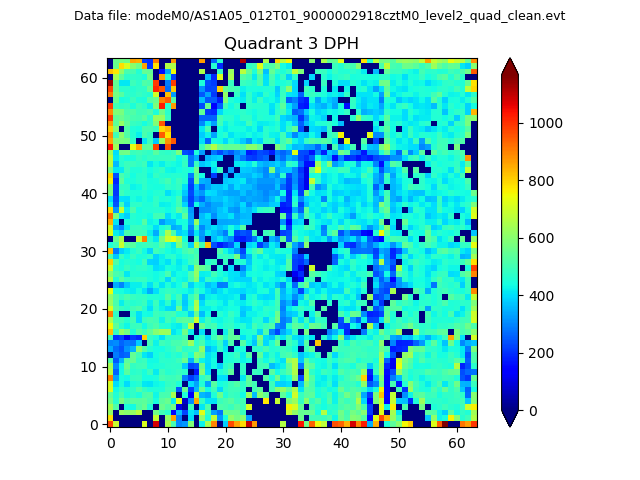 |
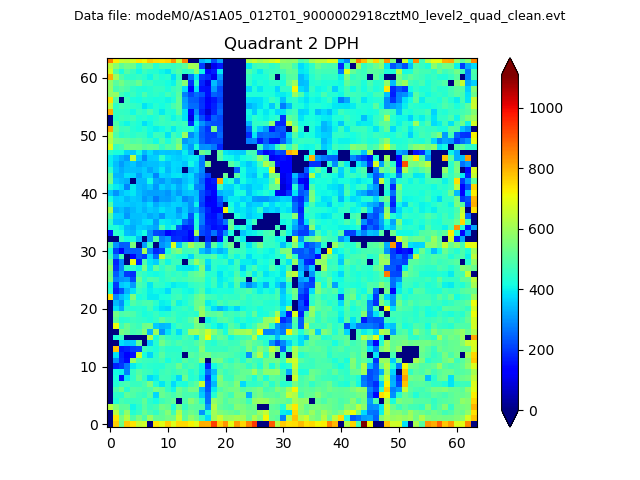 |
Quadrant C |
| Plot type | Count rate plots | Images |
|---|---|---|
| Comparison with Poisson distribution Blue bars denote a histogram of data divided into 1 sec bins. Red curve is a Poisson curve with rate = median count rate of data. |
 |
 |
| Quadrant-wise count rates Data is divided into 100 sec bins |
 |
|
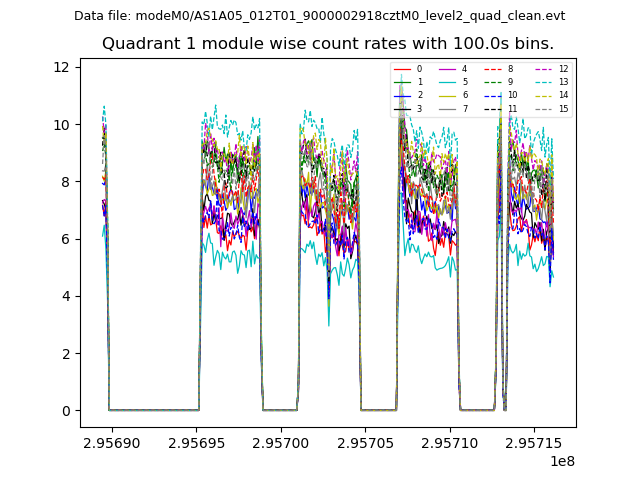
| Module-wise count rates for Quadrant A Data is divided into 100 sec bins |
 |
 |
| Module-wise count rates for Quadrant B Data is divided into 100 sec bins |
 |
 |
| Module-wise count rates for Quadrant C Data is divided into 100 sec bins |
 |
 |
| Module-wise count rates for Quadrant D Data is divided into 100 sec bins |
 |
 |
| Parameter | Plot |
|---|---|
| CZT HV Monitor | 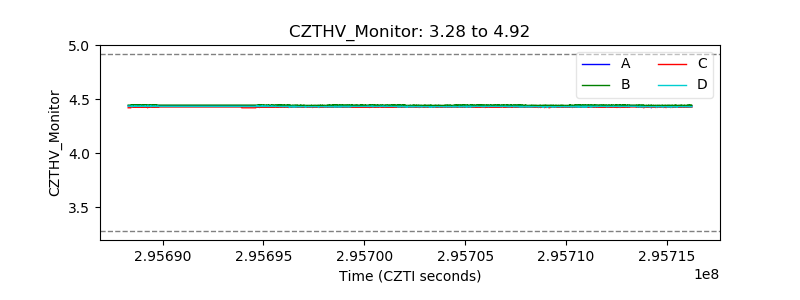 |
| D_VDD | 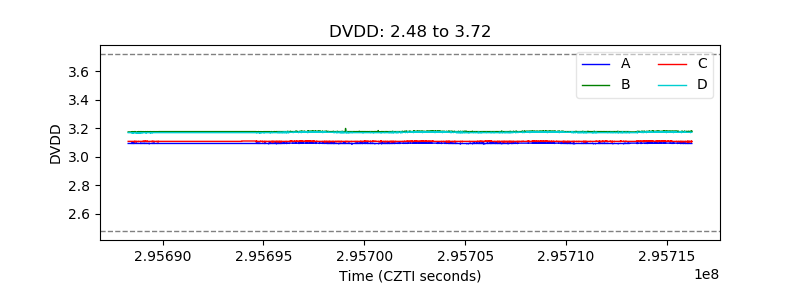 |
| Temperature 1 | 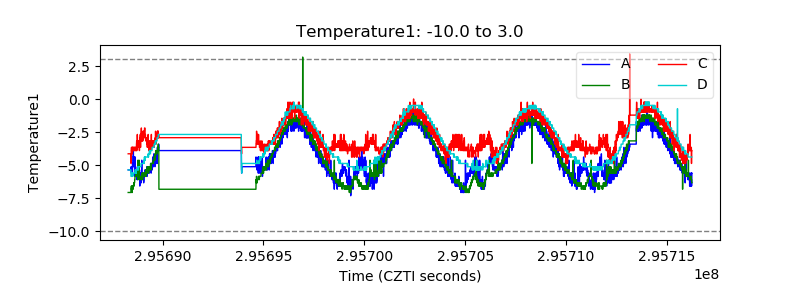 |
| Veto HV Monitor |  |
| Veto LLD |  |
| Alpha Counter | 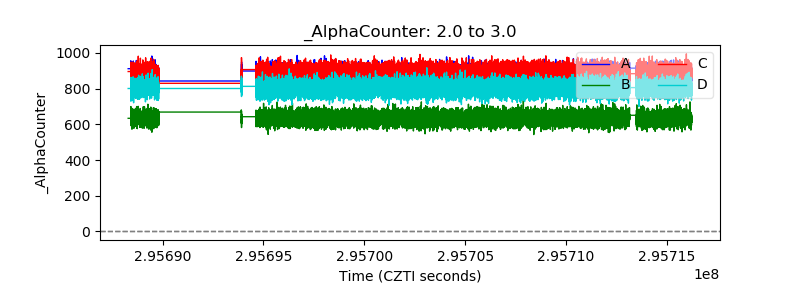 |
| _CPM_Rate | 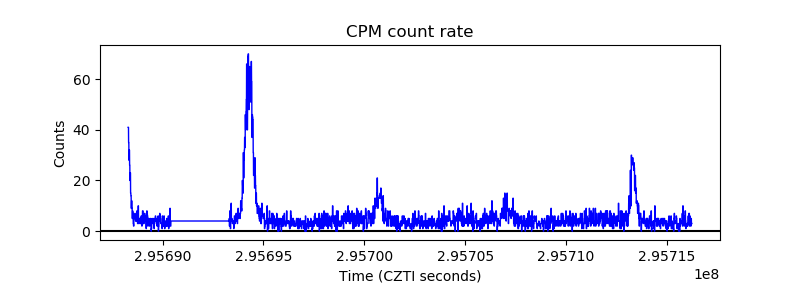 |
| CZT Counter |  |
| +2.5 Volts monitor |  |
| +5 Volts monitor |  |
| _ROLL_ROT |  |
| _Roll_DEC |  |
| _Roll_RA | 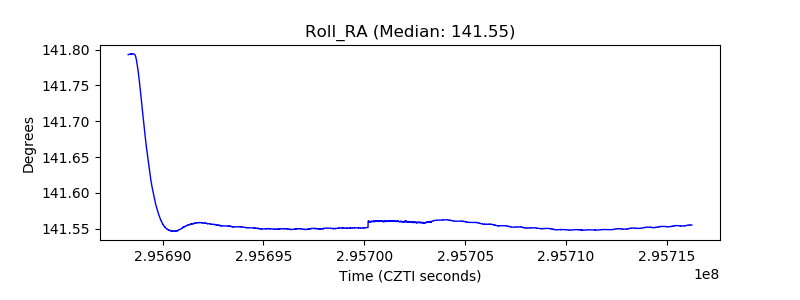 |
| Veto Counter |  |