| Param | Original file | Final file |
|---|---|---|
| Filename | modeM0/AS1A05_012T01_9000002918_19629cztM0_level2.evt | modeM0/AS1A05_012T01_9000002918_19629cztM0_level2_quad_clean.evt |
| Size (bytes) | 111,173,760 | 9,688,320 |
| Size | 106.0 MB | 9.2 MB |
| Events in quadrant A | 748,429 | 47,689 |
| Events in quadrant B | 740,942 | 49,392 |
| Events in quadrant C | 740,680 | 46,556 |
| Events in quadrant D | 1,039,166 | 44,885 |
| Mode M0 | |||
|---|---|---|---|
| Quadrant | BADHDUFLAG | Total packets | Discarded packets |
| A | 0 | 3004 | 1 |
| B | 0 | 2975 | 1 |
| C | 0 | 2961 | 2 |
| D | 0 | 3966 | 1 |
| Mode SS | |||
|---|---|---|---|
| Quadrant | BADHDUFLAG | Total packets | Discarded packets |
| A | 0 | 28 | 0 |
| B | 0 | 28 | 0 |
| C | 0 | 28 | 0 |
| D | 0 | 28 | 0 |
| Mode M9 | |||
|---|---|---|---|
| Quadrant | BADHDUFLAG | Total packets | Discarded packets |
| A | 0 | 2 | 0 |
| B | 0 | 2 | 0 |
| C | 0 | 2 | 0 |
| D | 0 | 2 | 0 |
| Quadrant | Total seconds | Saturated seconds | Saturation percentage |
|---|---|---|---|
| A | 1396 | 44 | 3.151862% |
| B | 1396 | 41 | 2.936963% |
| C | 1395 | 43 | 3.082437% |
| D | 1395 | 137 | 9.820789% |
Noise dominated data is calculated using 1-second bins in cleaned event files. If a bin has >2000 counts, and if more than 50% of those come from <1% of pixels, then it is considered to be noise-dominated and hence unusable.
| Quadrant | # 1 sec bins | Bins with >0 counts | Bins with >2000 counts | High rate bins dominated by noise | Noise dominated (total time) | Noise dominated (detector-on time) | Marked lightcurve |
|---|---|---|---|---|---|---|---|
| A | 1396 | 1396 | 3 | 3 | 0.21% | 0.21% | 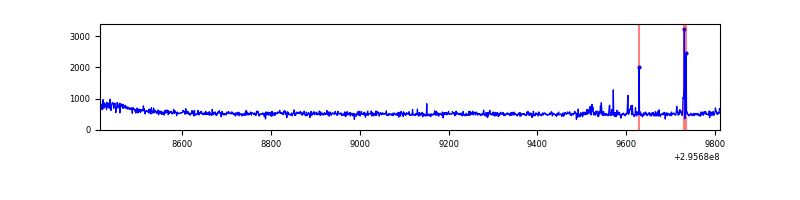 |
| B | 1396 | 1396 | 0 | 0 | 0.00% | 0.00% | 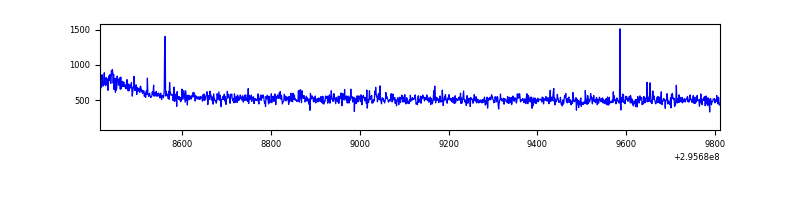 |
| C | 1395 | 1395 | 0 | 0 | 0.00% | 0.00% | 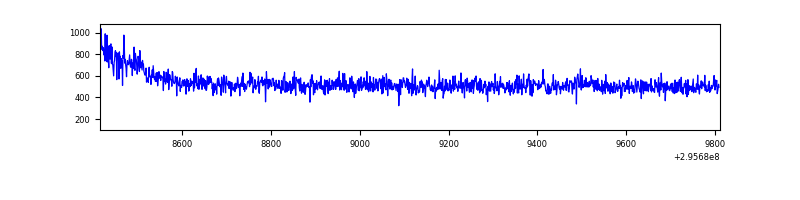 |
| D | 1395 | 1395 | 85 | 85 | 6.09% | 6.09% | 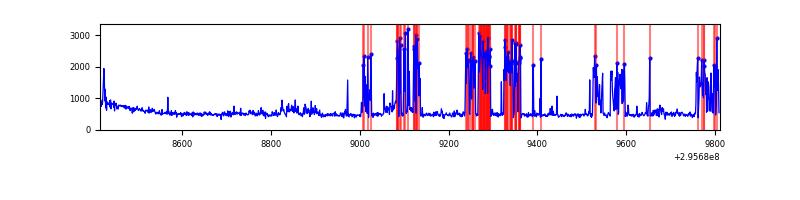 |
Top three noisy pixels from each quadrant. If the there are fewer than three noisy pixels in the level2.evt file, extra rows are filled as -1
| Pixel properties | Quadrant properties | ||||||
|---|---|---|---|---|---|---|---|
| Quadrant | DetID | PixID | Counts | Sigma | Mean | Median | Sigma |
| A | 5 | 16 | 20134 | 504.3 | 189 | 185 | 39.6 |
| A | 0 | 226 | 1636 | 36.68 | 189 | 185 | 39.6 |
| A | 3 | 137 | 1550 | 34.51 | 189 | 185 | 39.6 |
| B | 3 | 112 | 5473 | 140.94 | 187 | 182 | 37.5 |
| B | 12 | 111 | 4543 | 116.17 | 187 | 182 | 37.5 |
| B | 11 | 111 | 4024 | 102.34 | 187 | 182 | 37.5 |
| C | 14 | 238 | 28580 | 660.47 | 177 | 178 | 43.0 |
| C | 3 | 233 | 12522 | 287.05 | 177 | 178 | 43.0 |
| C | 9 | 54 | 3485 | 76.9 | 177 | 178 | 43.0 |
| D | 1 | 52 | 355967 | 7798.93 | 178 | 172 | 45.6 |
| D | 7 | 223 | 4856 | 102.67 | 178 | 172 | 45.6 |
| D | 2 | 234 | 4128 | 86.71 | 178 | 172 | 45.6 |
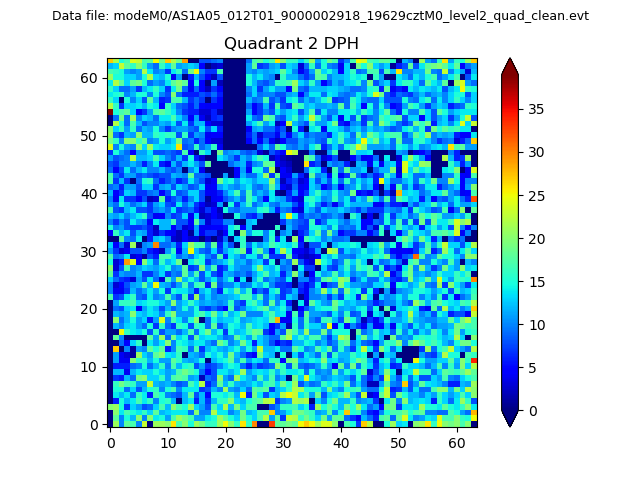
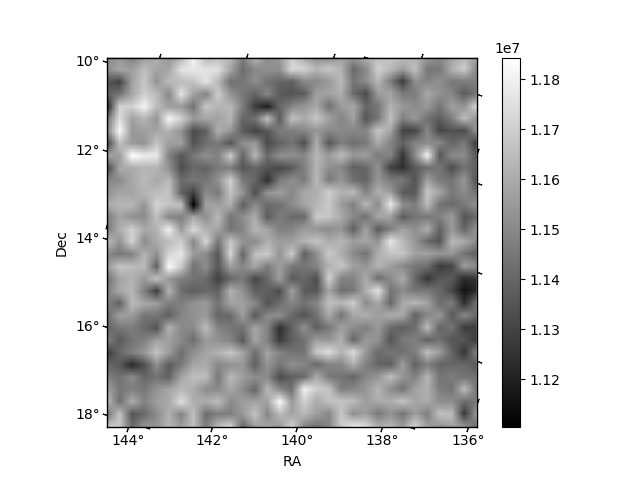
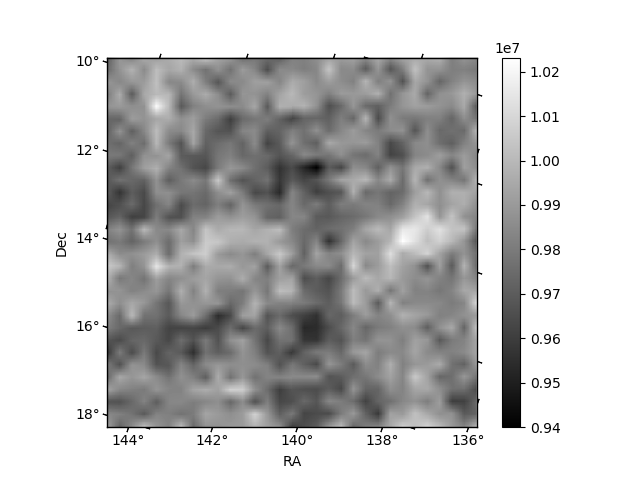
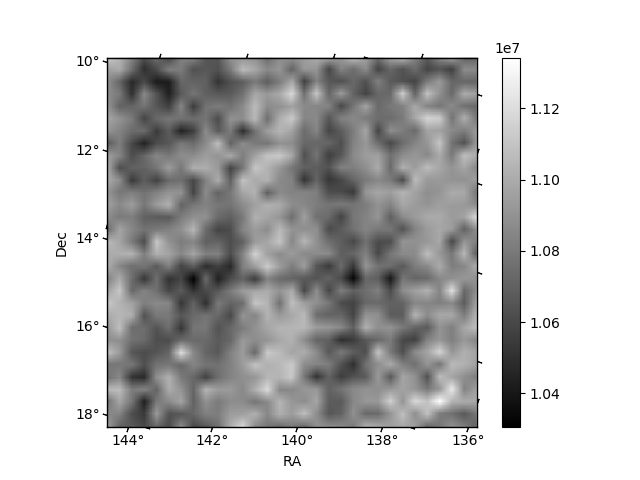
Histogram calculated using DETX and DETY for each event in the final _common_clean file
| Quadrant A | 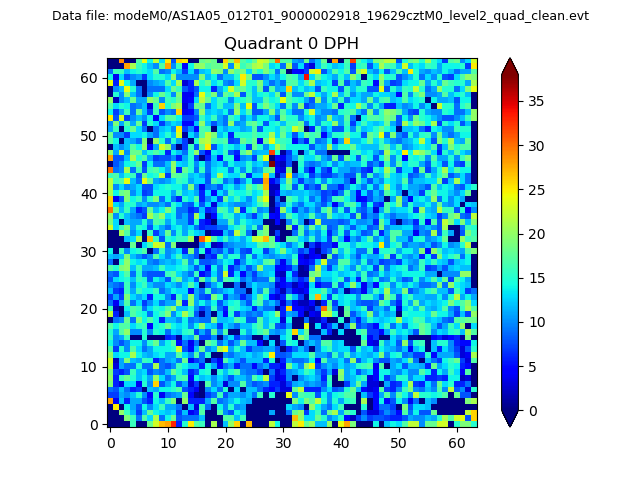 |
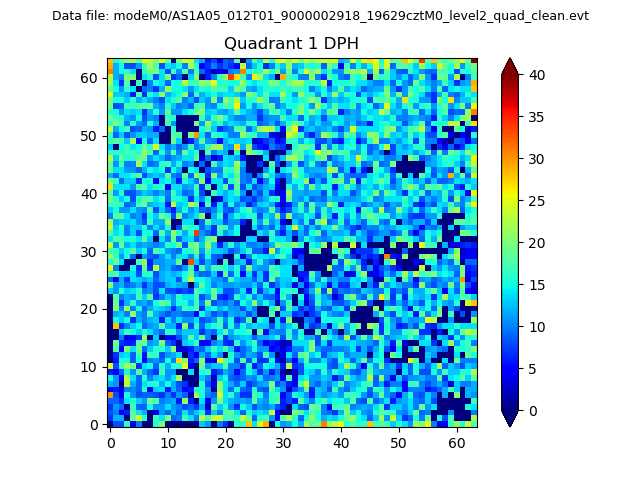 |
Quadrant B |
|---|---|---|---|
| Quadrant D | 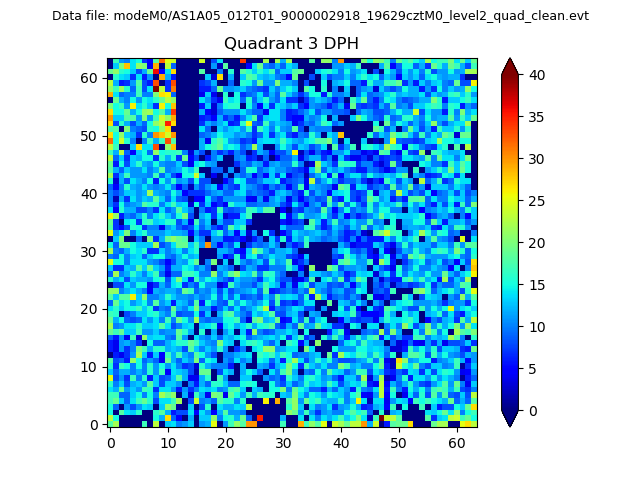 |
 |
Quadrant C |
| Plot type | Count rate plots | Images |
|---|---|---|
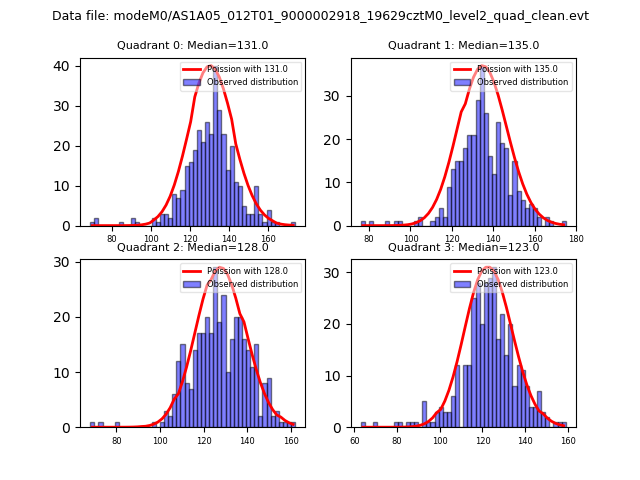
| Comparison with Poisson distribution Blue bars denote a histogram of data divided into 1 sec bins. Red curve is a Poisson curve with rate = median count rate of data. |
 |
 |
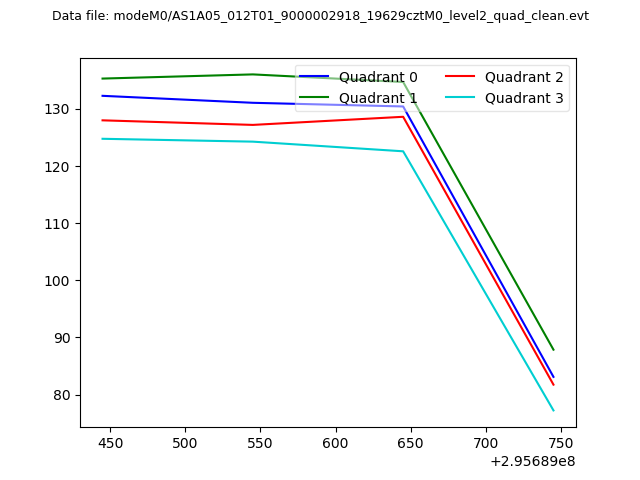
| Quadrant-wise count rates Data is divided into 100 sec bins |
 |
|
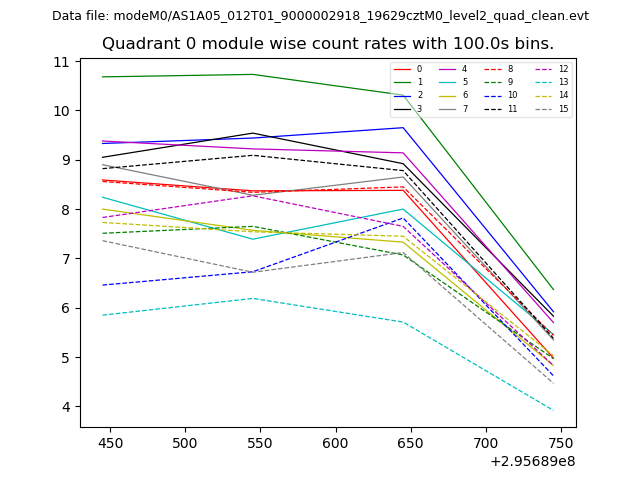
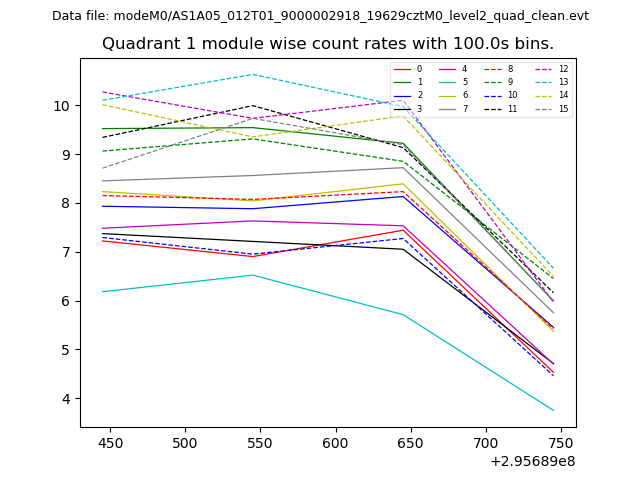
| Module-wise count rates for Quadrant A Data is divided into 100 sec bins |
 |
 |
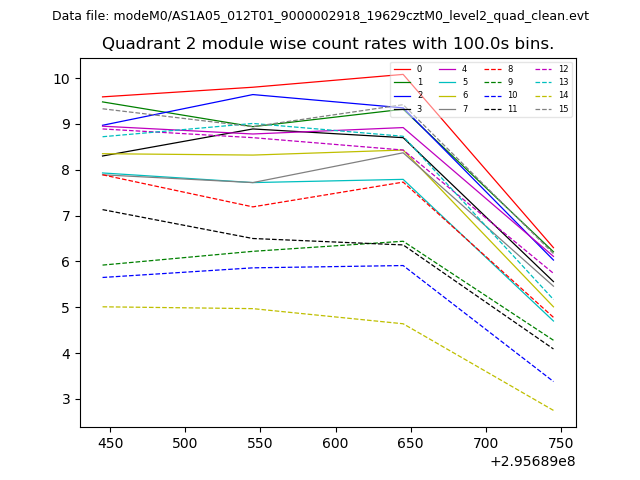
| Module-wise count rates for Quadrant B Data is divided into 100 sec bins |
 |
 |
| Module-wise count rates for Quadrant C Data is divided into 100 sec bins |
 |
 |
| Module-wise count rates for Quadrant D Data is divided into 100 sec bins |
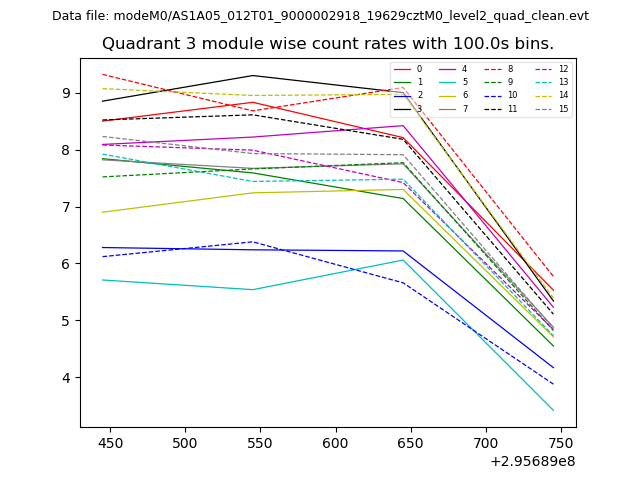 |
 |
| Parameter | Plot |
|---|---|
| CZT HV Monitor | 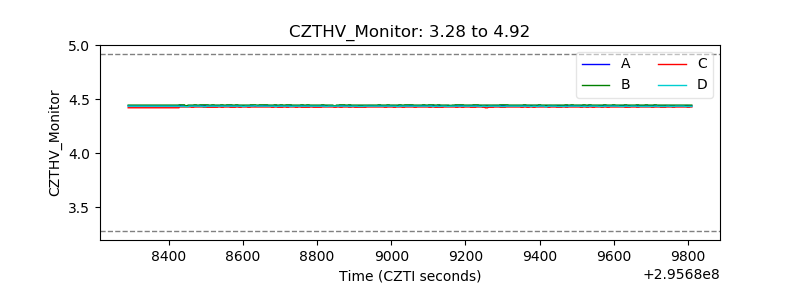 |
| D_VDD | 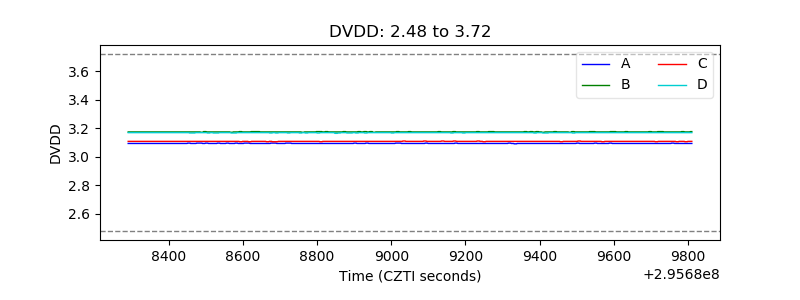 |
| Temperature 1 | 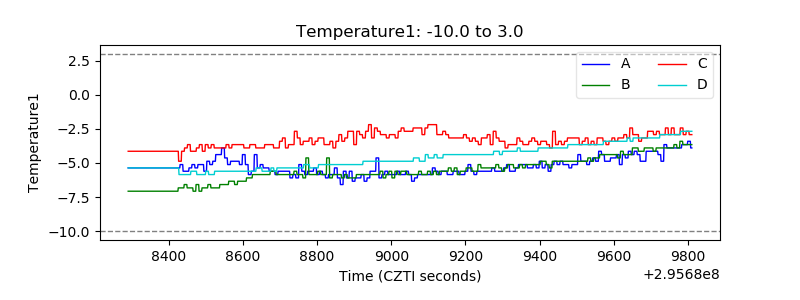 |
| Veto HV Monitor | 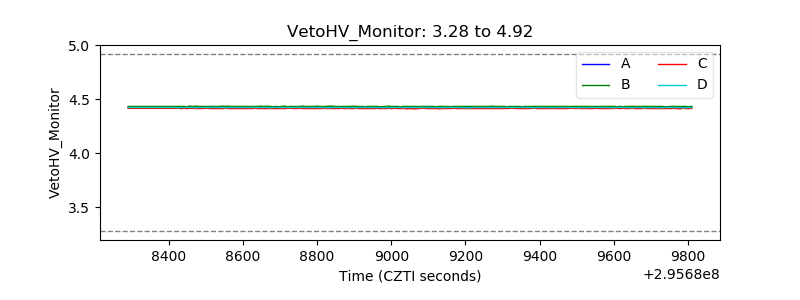 |
| Veto LLD | 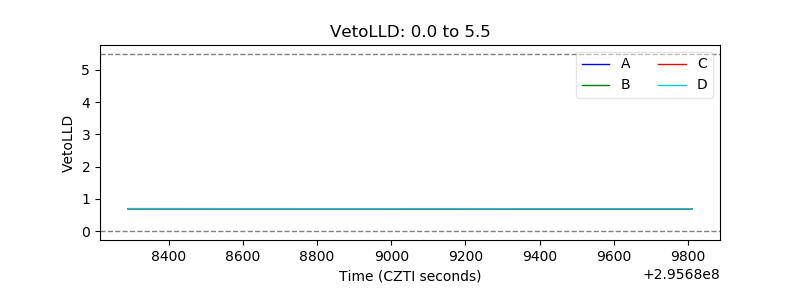 |
| Alpha Counter | 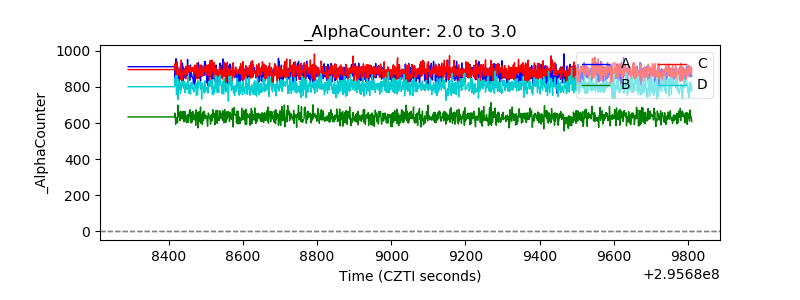 |
| _CPM_Rate | 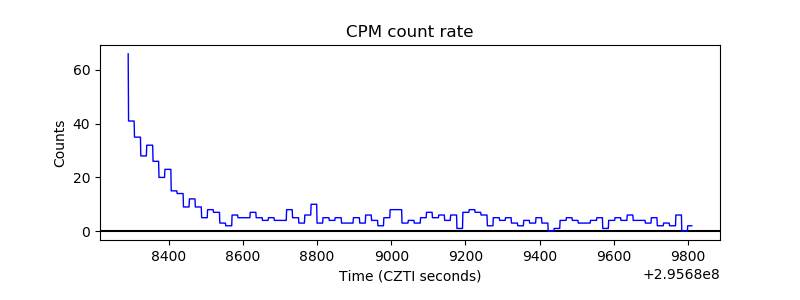 |
| CZT Counter | 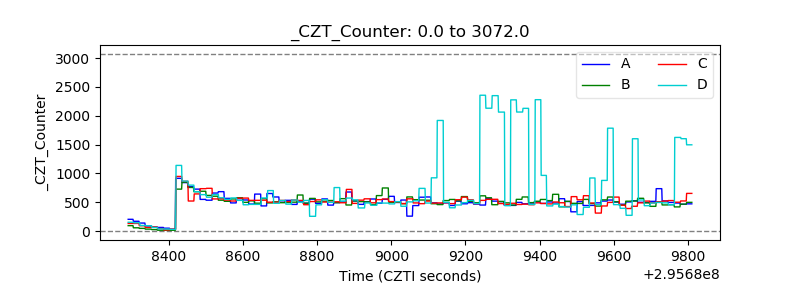 |
| +2.5 Volts monitor |  |
| +5 Volts monitor |  |
| _ROLL_ROT | 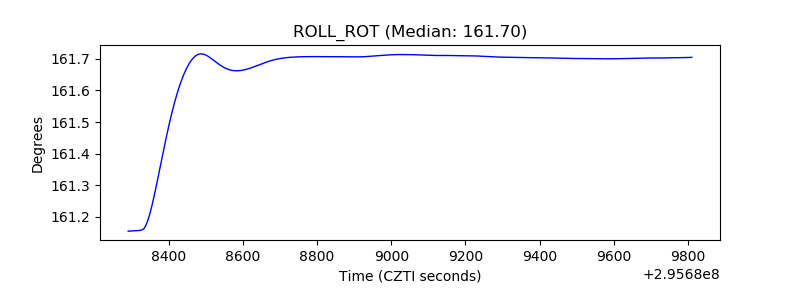 |
| _Roll_DEC |  |
| _Roll_RA | 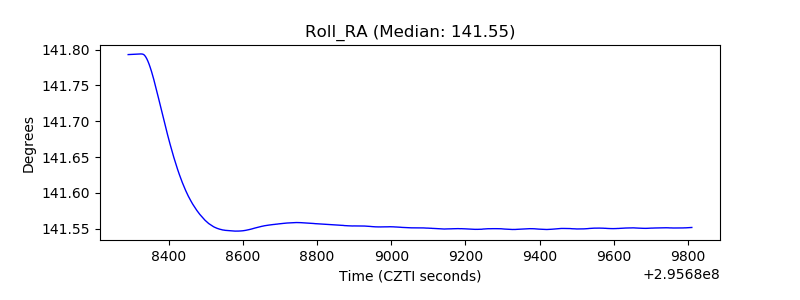 |
| Veto Counter | 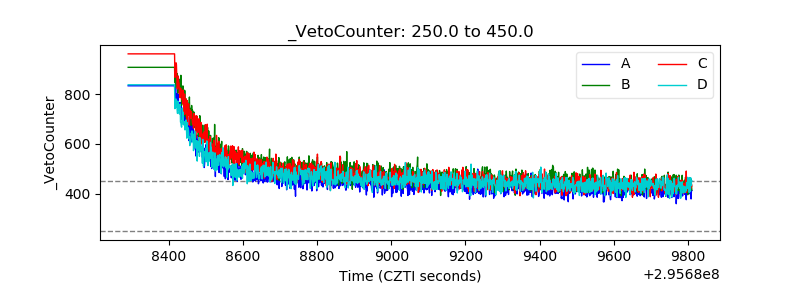 |