| Param | Original file | Final file |
|---|---|---|
| Filename | modeM0/AS1A05_012T01_9000002918_19632cztM0_level2.evt | modeM0/AS1A05_012T01_9000002918_19632cztM0_level2_quad_clean.evt |
| Size (bytes) | 623,439,360 | 101,004,480 |
| Size | 594.6 MB | 96.3 MB |
| Events in quadrant A | 3,793,954 | 653,060 |
| Events in quadrant B | 5,640,908 | 642,373 |
| Events in quadrant C | 3,788,001 | 628,435 |
| Events in quadrant D | 5,149,035 | 611,820 |
| Mode M0 | |||
|---|---|---|---|
| Quadrant | BADHDUFLAG | Total packets | Discarded packets |
| A | 0 | 16209 | 0 |
| B | 0 | 21795 | 0 |
| C | 0 | 16028 | 0 |
| D | 0 | 20333 | 0 |
| Mode SS | |||
|---|---|---|---|
| Quadrant | BADHDUFLAG | Total packets | Discarded packets |
| A | 0 | 150 | 0 |
| B | 0 | 150 | 0 |
| C | 0 | 150 | 0 |
| D | 0 | 150 | 0 |
| Quadrant | Total seconds | Saturated seconds | Saturation percentage |
|---|---|---|---|
| A | 7513 | 259 | 3.447358% |
| B | 7514 | 505 | 6.720788% |
| C | 7514 | 262 | 3.486825% |
| D | 7514 | 379 | 5.043918% |
Noise dominated data is calculated using 1-second bins in cleaned event files. If a bin has >2000 counts, and if more than 50% of those come from <1% of pixels, then it is considered to be noise-dominated and hence unusable.
| Quadrant | # 1 sec bins | Bins with >0 counts | Bins with >2000 counts | High rate bins dominated by noise | Noise dominated (total time) | Noise dominated (detector-on time) | Marked lightcurve |
|---|---|---|---|---|---|---|---|
| A | 7513 | 7513 | 21 | 21 | 0.28% | 0.28% | 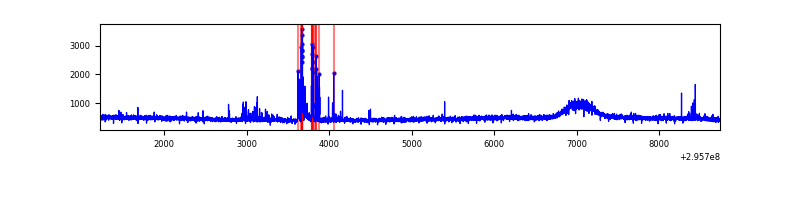 |
| B | 7514 | 7514 | 213 | 213 | 2.83% | 2.83% | 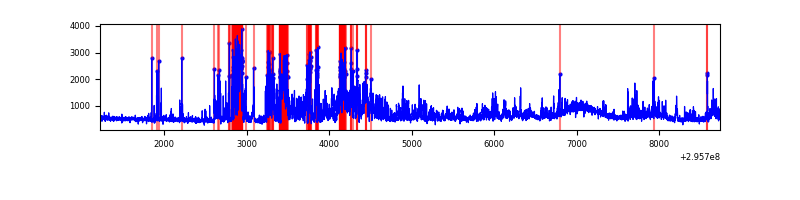 |
| C | 7514 | 7514 | 0 | 0 | 0.00% | 0.00% | 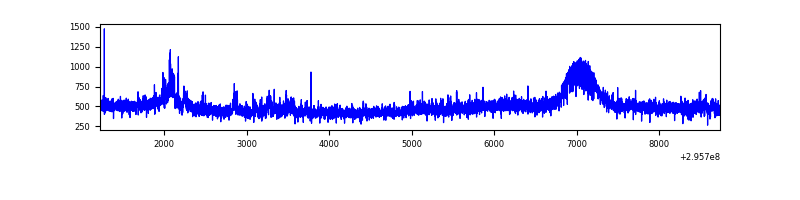 |
| D | 7514 | 7514 | 204 | 204 | 2.71% | 2.71% | 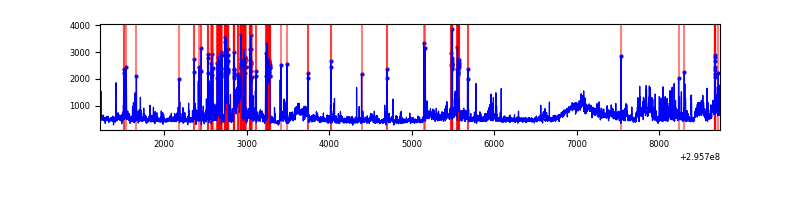 |
Top three noisy pixels from each quadrant. If the there are fewer than three noisy pixels in the level2.evt file, extra rows are filled as -1
| Pixel properties | Quadrant properties | ||||||
|---|---|---|---|---|---|---|---|
| Quadrant | DetID | PixID | Counts | Sigma | Mean | Median | Sigma |
| A | 5 | 16 | 180706 | 933.17 | 938 | 915 | 192.7 |
| A | 0 | 226 | 8362 | 38.65 | 938 | 915 | 192.7 |
| A | 3 | 137 | 7479 | 34.07 | 938 | 915 | 192.7 |
| B | 3 | 112 | 1821493 | 10154.0 | 919 | 894 | 179.3 |
| B | 7 | 220 | 65411 | 359.83 | 919 | 894 | 179.3 |
| B | 4 | 216 | 41644 | 227.27 | 919 | 894 | 179.3 |
| C | 14 | 238 | 135973 | 640.42 | 891 | 897 | 210.9 |
| C | 3 | 233 | 100845 | 473.87 | 891 | 897 | 210.9 |
| C | 7 | 247 | 71522 | 334.85 | 891 | 897 | 210.9 |
| D | 7 | 238 | 655451 | 2927.37 | 909 | 881 | 223.6 |
| D | 1 | 20 | 441222 | 1969.3 | 909 | 881 | 223.6 |
| D | 1 | 52 | 409417 | 1827.06 | 909 | 881 | 223.6 |
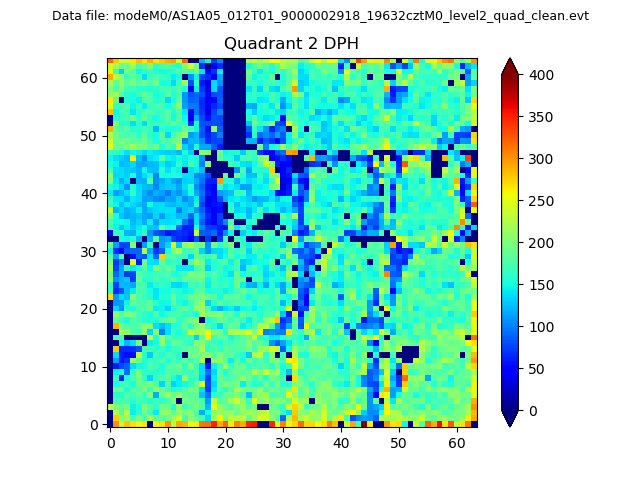
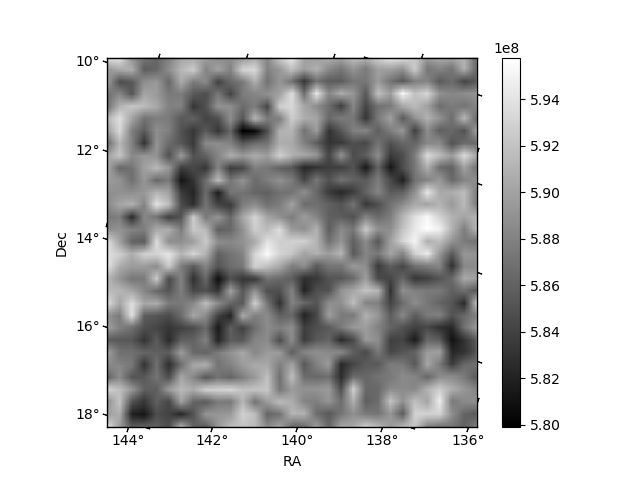
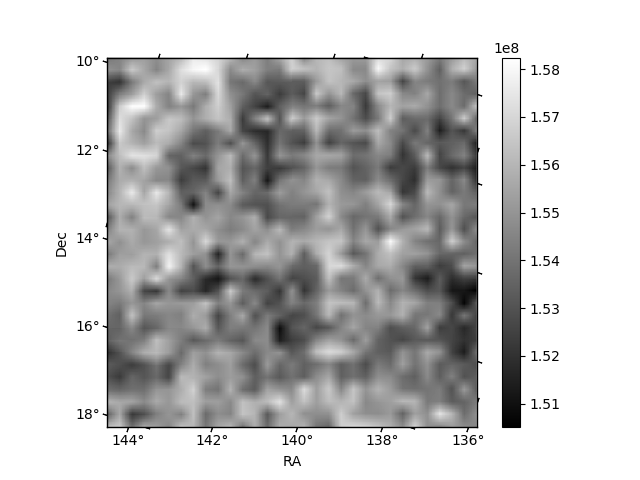
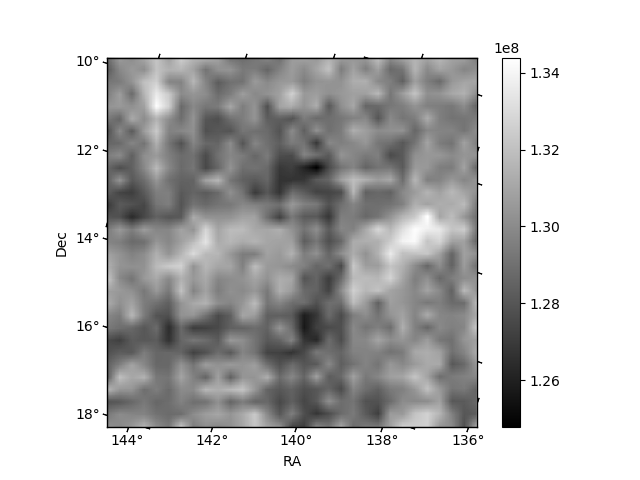
Histogram calculated using DETX and DETY for each event in the final _common_clean file
| Quadrant A | 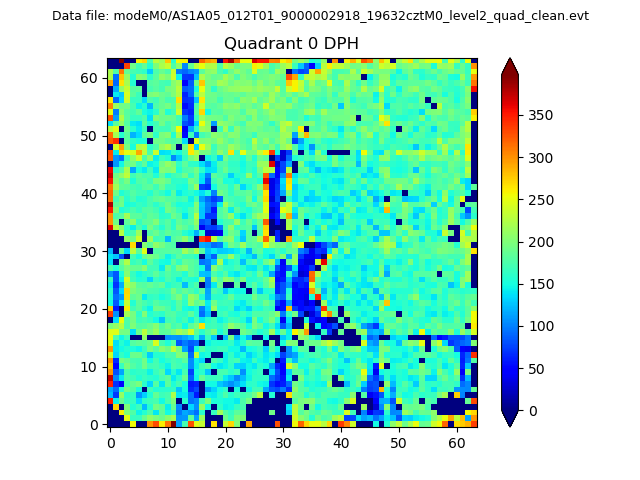 |
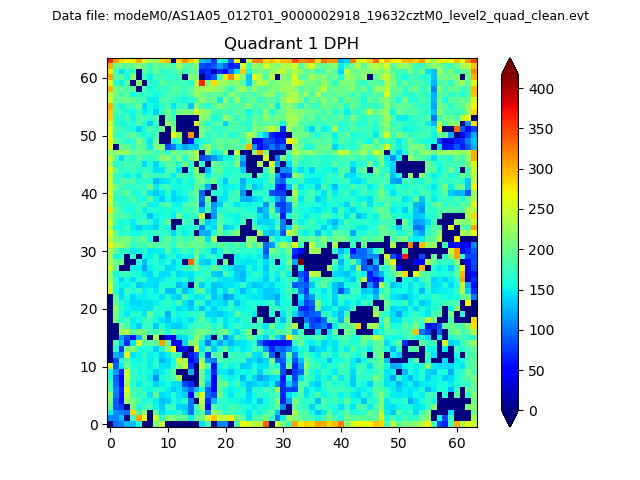 |
Quadrant B |
|---|---|---|---|
| Quadrant D | 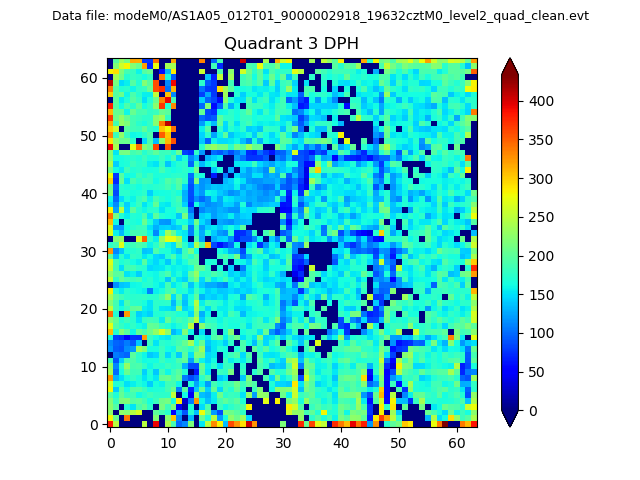 |
 |
Quadrant C |
| Plot type | Count rate plots | Images |
|---|---|---|
| Comparison with Poisson distribution Blue bars denote a histogram of data divided into 1 sec bins. Red curve is a Poisson curve with rate = median count rate of data. |
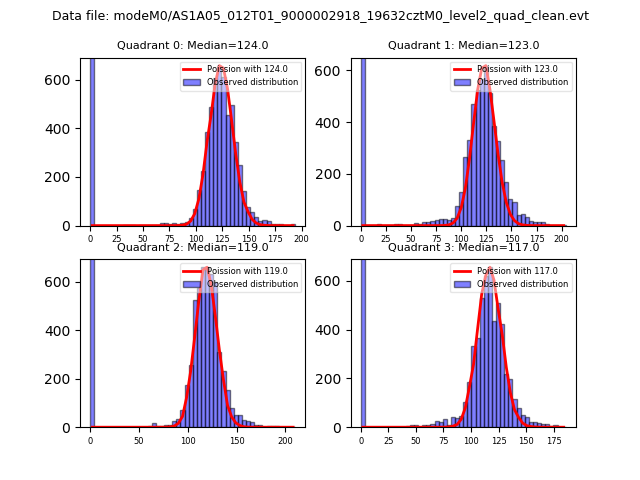 |
 |
| Quadrant-wise count rates Data is divided into 100 sec bins |
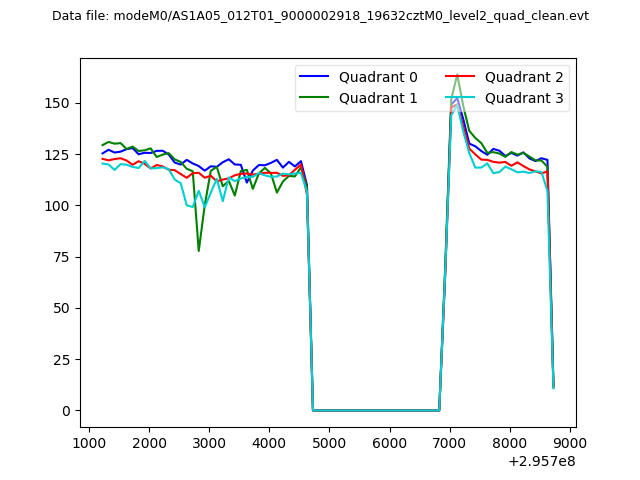 |
|
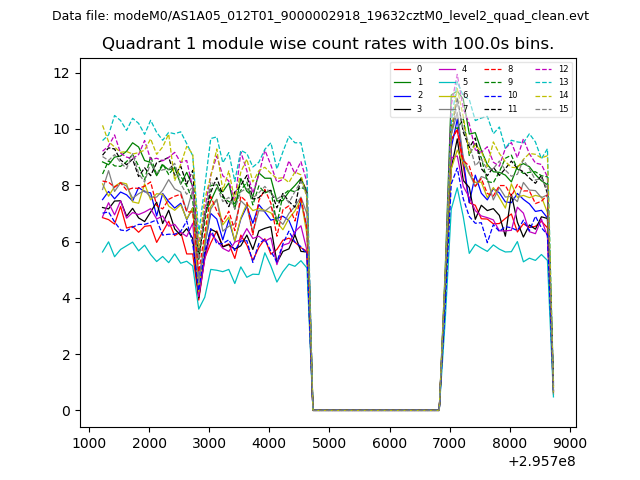
| Module-wise count rates for Quadrant A Data is divided into 100 sec bins |
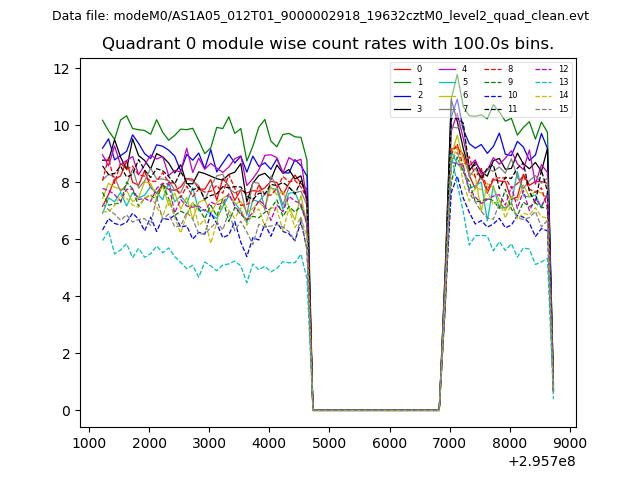 |
 |
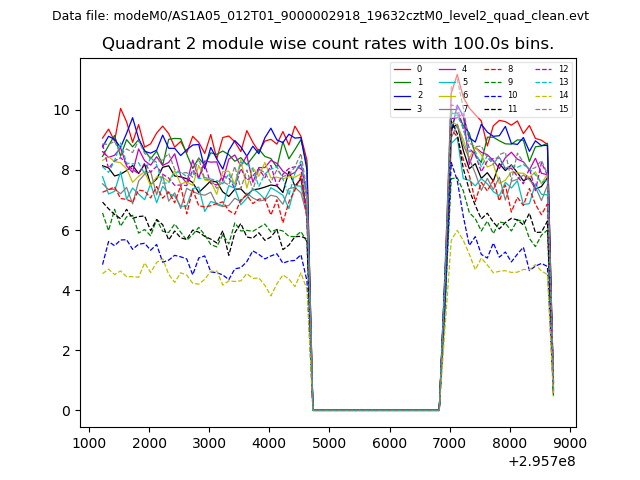
| Module-wise count rates for Quadrant B Data is divided into 100 sec bins |
 |
 |
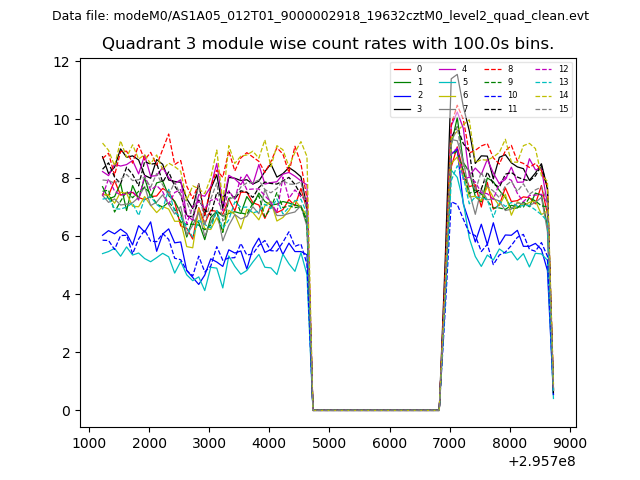
| Module-wise count rates for Quadrant C Data is divided into 100 sec bins |
 |
 |
| Module-wise count rates for Quadrant D Data is divided into 100 sec bins |
 |
 |
| Parameter | Plot |
|---|---|
| CZT HV Monitor | 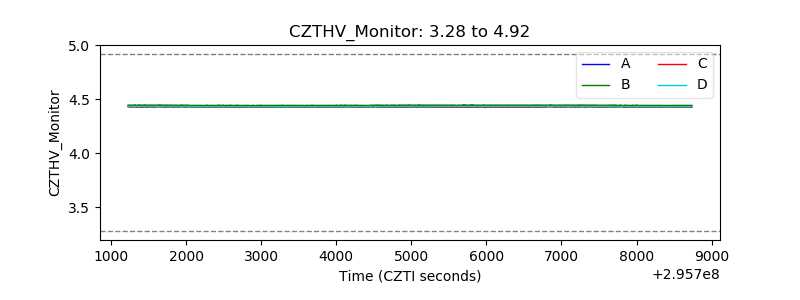 |
| D_VDD | 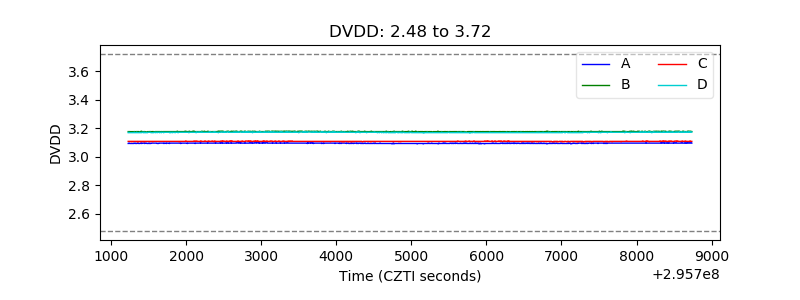 |
| Temperature 1 | 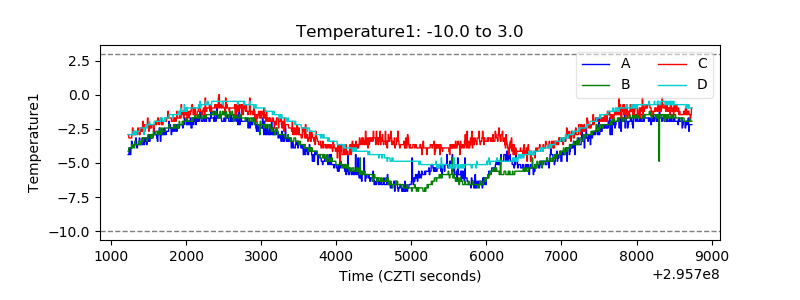 |
| Veto HV Monitor | 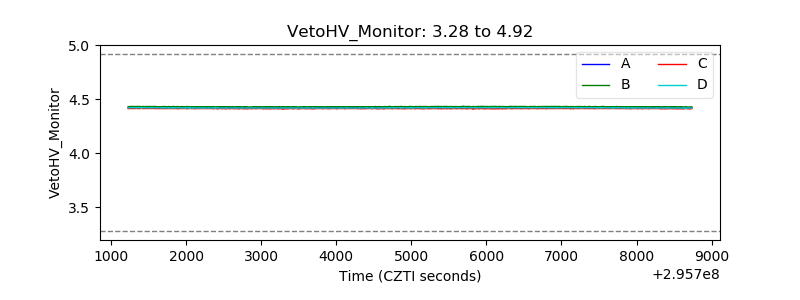 |
| Veto LLD | 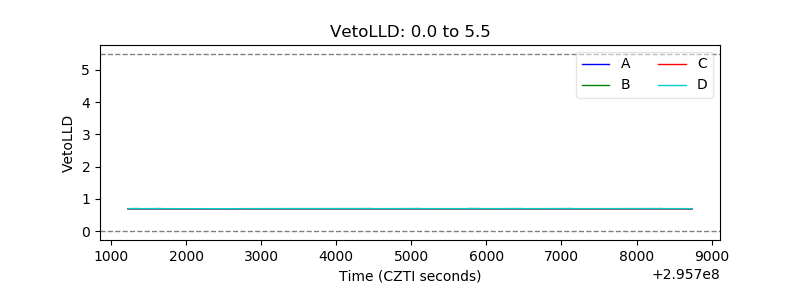 |
| Alpha Counter | 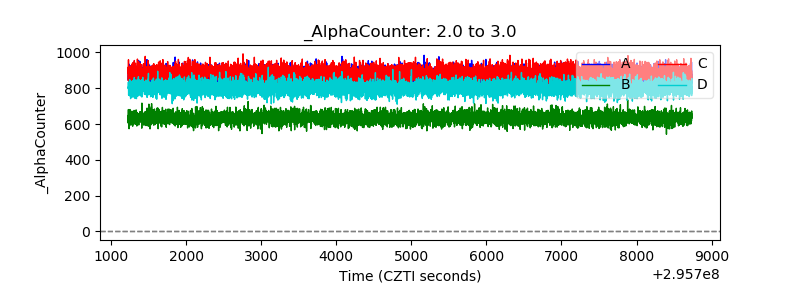 |
| _CPM_Rate | 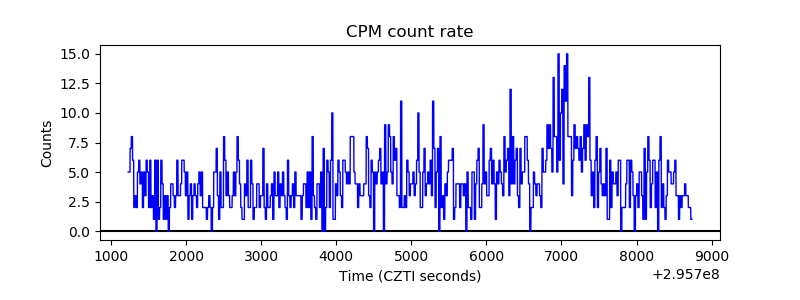 |
| CZT Counter | 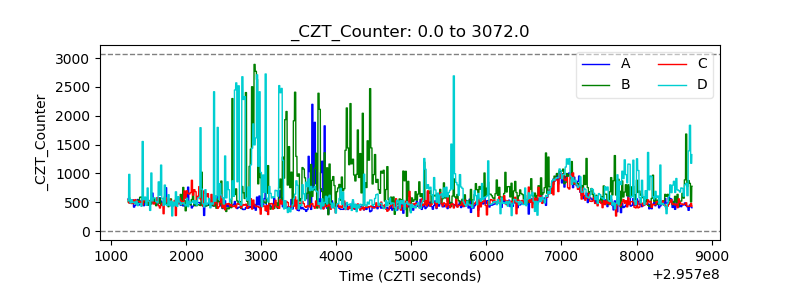 |
| +2.5 Volts monitor |  |
| +5 Volts monitor |  |
| _ROLL_ROT | 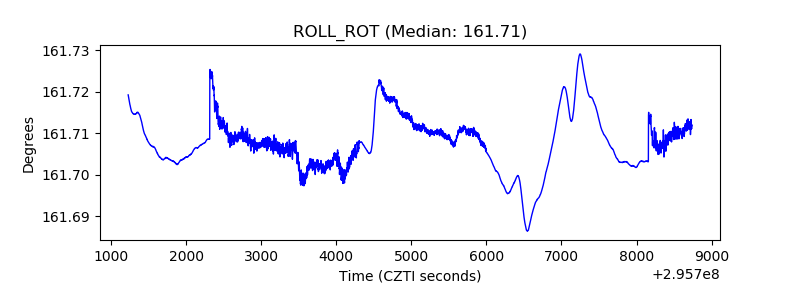 |
| _Roll_DEC | 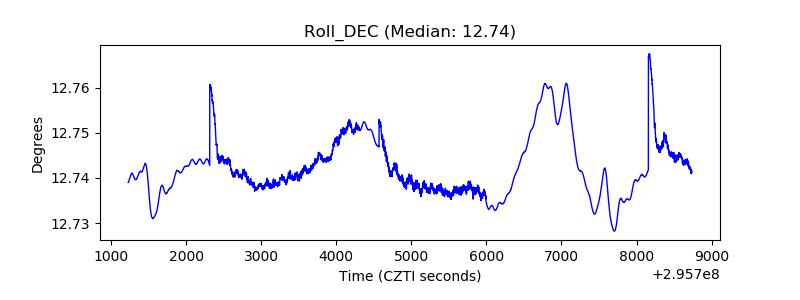 |
| _Roll_RA | 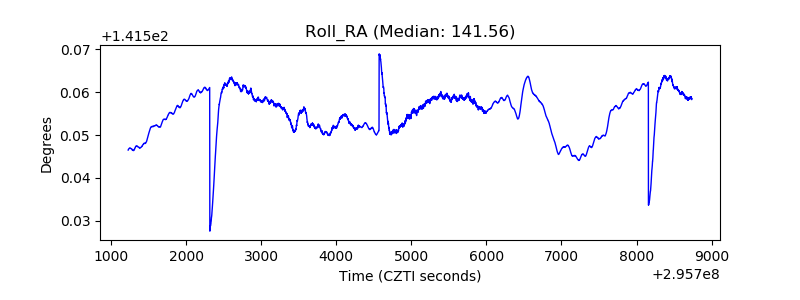 |
| Veto Counter | 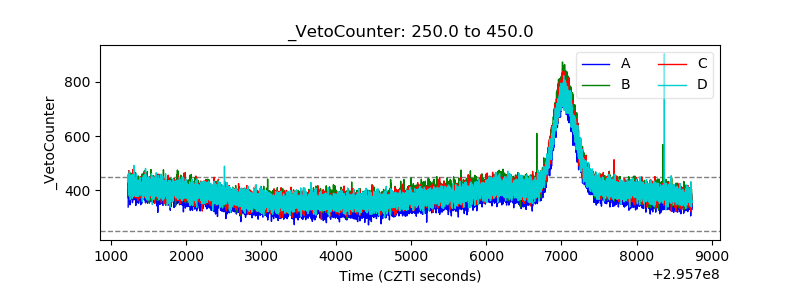 |