| Param | Original file | Final file |
|---|---|---|
| Filename | modeM0/AS1A05_012T01_9000002918_19633cztM0_level2.evt | modeM0/AS1A05_012T01_9000002918_19633cztM0_level2_quad_clean.evt |
| Size (bytes) | 522,020,160 | 93,625,920 |
| Size | 497.8 MB | 89.3 MB |
| Events in quadrant A | 3,347,766 | 602,155 |
| Events in quadrant B | 3,753,824 | 599,085 |
| Events in quadrant C | 3,436,796 | 576,546 |
| Events in quadrant D | 4,787,366 | 561,222 |
| Mode M0 | |||
|---|---|---|---|
| Quadrant | BADHDUFLAG | Total packets | Discarded packets |
| A | 0 | 14753 | 1 |
| B | 0 | 15813 | 1 |
| C | 0 | 14714 | 1 |
| D | 0 | 19041 | 1 |
| Mode SS | |||
|---|---|---|---|
| Quadrant | BADHDUFLAG | Total packets | Discarded packets |
| A | 0 | 144 | 0 |
| B | 0 | 144 | 0 |
| C | 0 | 144 | 0 |
| D | 0 | 144 | 0 |
| Mode M9 | |||
|---|---|---|---|
| Quadrant | BADHDUFLAG | Total packets | Discarded packets |
| A | 0 | 3 | 0 |
| B | 0 | 3 | 0 |
| C | 0 | 3 | 0 |
| D | 0 | 3 | 0 |
| Quadrant | Total seconds | Saturated seconds | Saturation percentage |
|---|---|---|---|
| A | 7128 | 76 | 1.066218% |
| B | 7128 | 131 | 1.837823% |
| C | 7128 | 110 | 1.543210% |
| D | 7128 | 170 | 2.384961% |
Noise dominated data is calculated using 1-second bins in cleaned event files. If a bin has >2000 counts, and if more than 50% of those come from <1% of pixels, then it is considered to be noise-dominated and hence unusable.
| Quadrant | # 1 sec bins | Bins with >0 counts | Bins with >2000 counts | High rate bins dominated by noise | Noise dominated (total time) | Noise dominated (detector-on time) | Marked lightcurve |
|---|---|---|---|---|---|---|---|
| A | 7448 | 7128 | 1 | 1 | 0.01% | 0.01% | 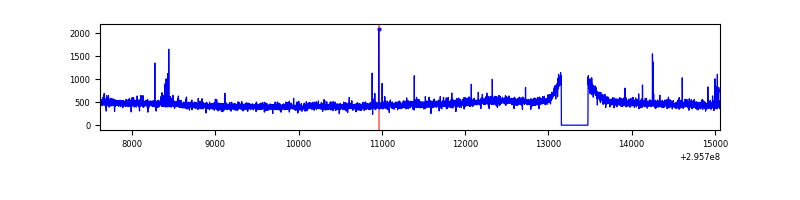 |
| B | 7448 | 7129 | 19 | 19 | 0.26% | 0.27% | 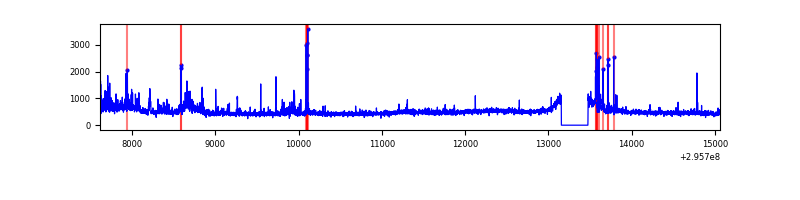 |
| C | 7448 | 7129 | 0 | 0 | 0.00% | 0.00% | 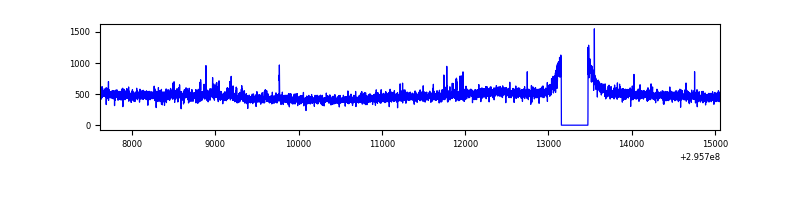 |
| D | 7448 | 7129 | 137 | 137 | 1.84% | 1.92% | 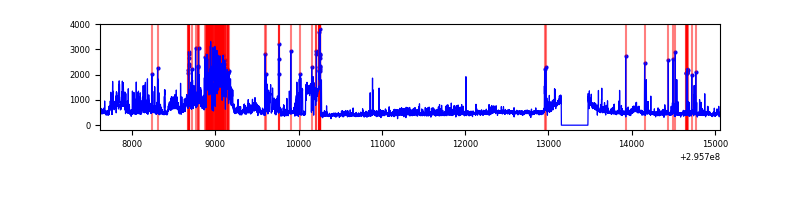 |
Top three noisy pixels from each quadrant. If the there are fewer than three noisy pixels in the level2.evt file, extra rows are filled as -1
| Pixel properties | Quadrant properties | ||||||
|---|---|---|---|---|---|---|---|
| Quadrant | DetID | PixID | Counts | Sigma | Mean | Median | Sigma |
| A | 5 | 16 | 30970 | 172.49 | 858 | 839 | 174.7 |
| A | 11 | 29 | 8644 | 44.68 | 858 | 839 | 174.7 |
| A | 0 | 226 | 7472 | 37.97 | 858 | 839 | 174.7 |
| B | 3 | 112 | 244160 | 1479.2 | 847 | 826 | 164.5 |
| B | 7 | 220 | 87086 | 524.37 | 847 | 826 | 164.5 |
| B | 4 | 216 | 38228 | 227.36 | 847 | 826 | 164.5 |
| C | 14 | 238 | 126970 | 653.37 | 815 | 820 | 193.1 |
| C | 3 | 233 | 113477 | 583.49 | 815 | 820 | 193.1 |
| C | 8 | 208 | 9328 | 44.07 | 815 | 820 | 193.1 |
| D | 1 | 52 | 741974 | 3617.98 | 832 | 808 | 204.9 |
| D | 1 | 20 | 465031 | 2266.09 | 832 | 808 | 204.9 |
| D | 7 | 238 | 226562 | 1102.01 | 832 | 808 | 204.9 |
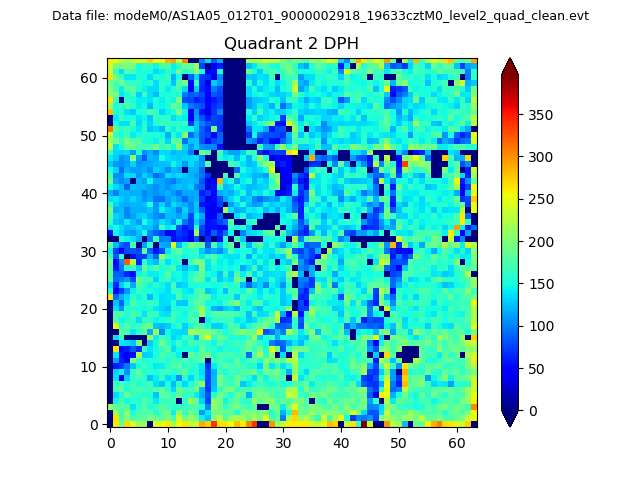
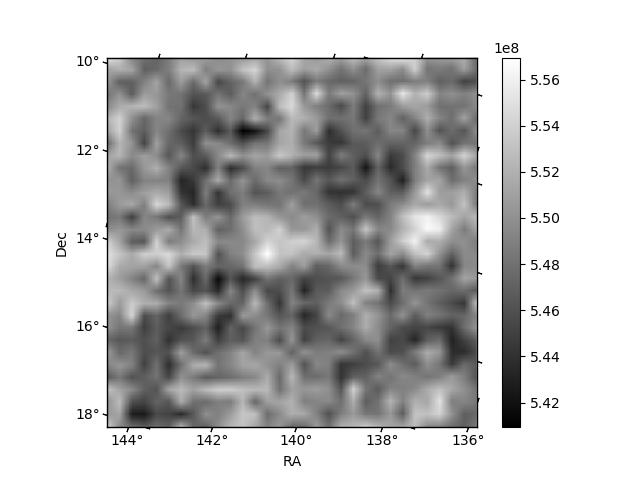
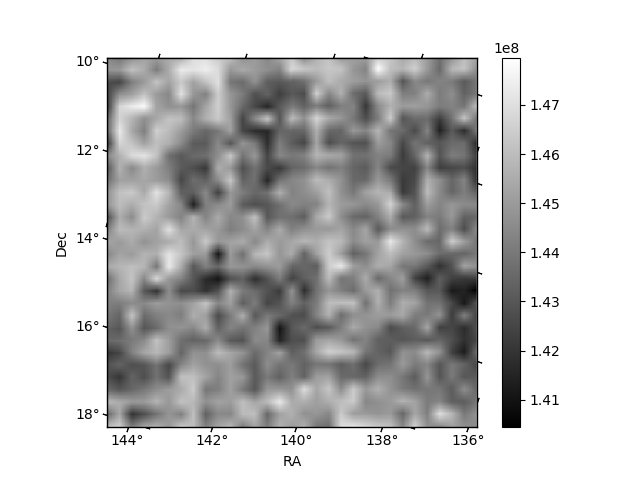
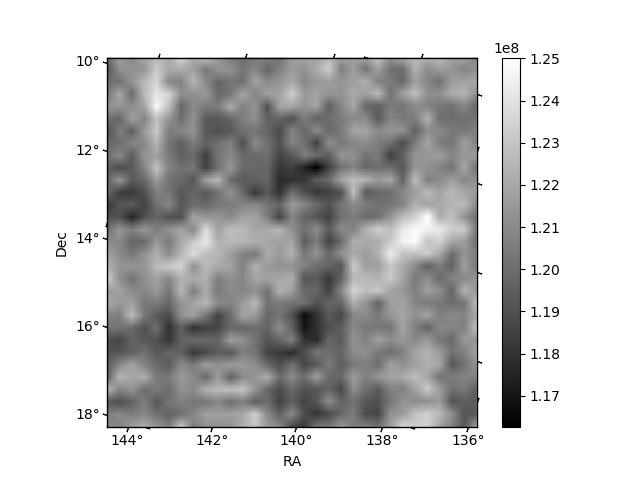
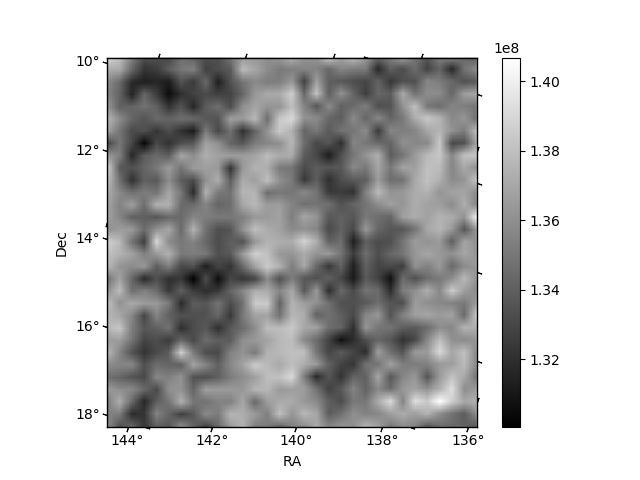
Histogram calculated using DETX and DETY for each event in the final _common_clean file
| Quadrant A | 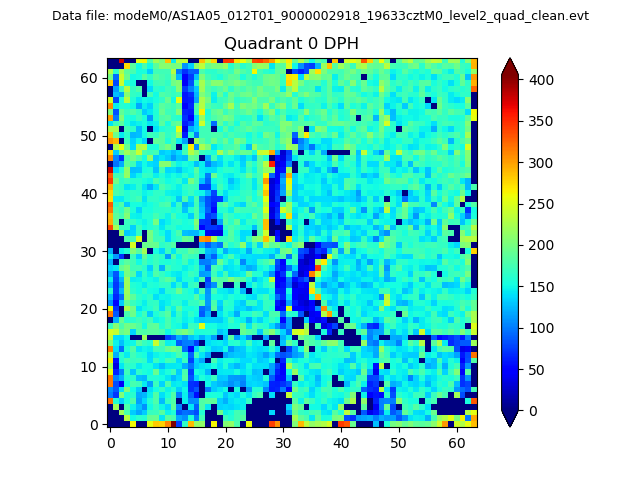 |
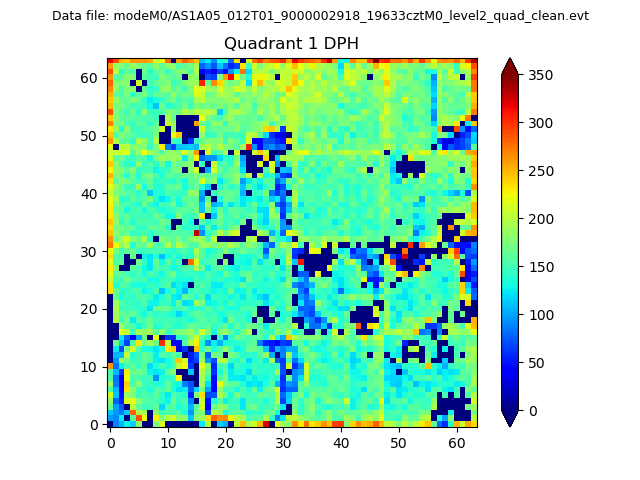 |
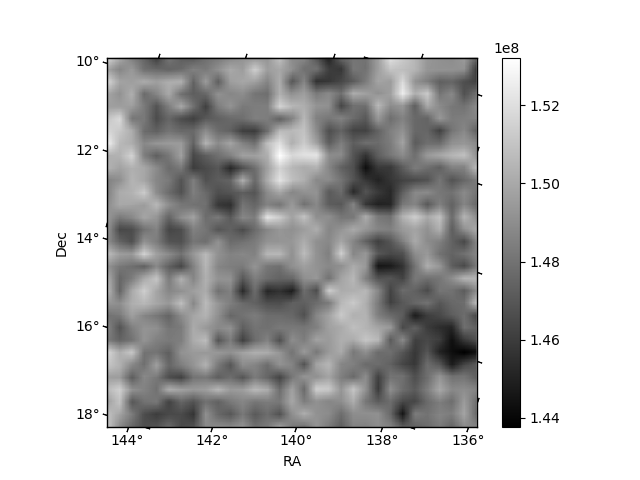
Quadrant B |
|---|---|---|---|
| Quadrant D | 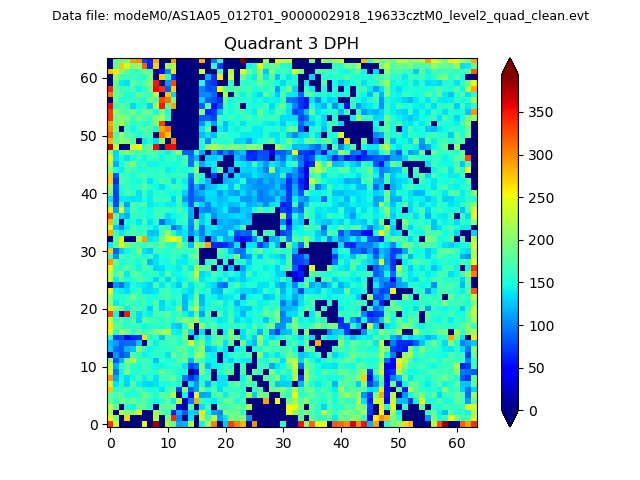 |
 |
Quadrant C |
| Plot type | Count rate plots | Images |
|---|---|---|
| Comparison with Poisson distribution Blue bars denote a histogram of data divided into 1 sec bins. Red curve is a Poisson curve with rate = median count rate of data. |
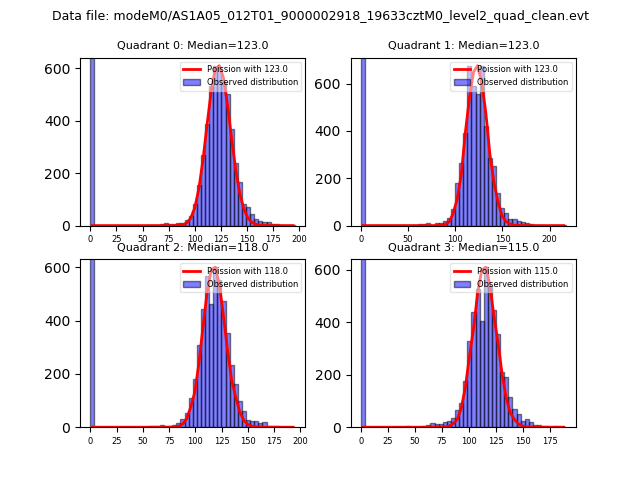 |
 |
| Quadrant-wise count rates Data is divided into 100 sec bins |
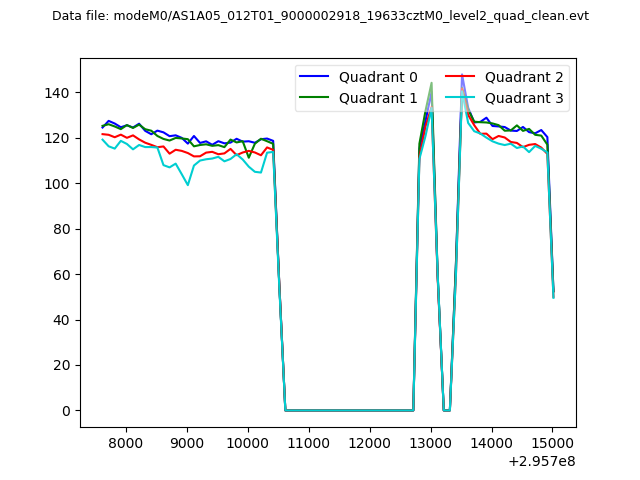 |
|
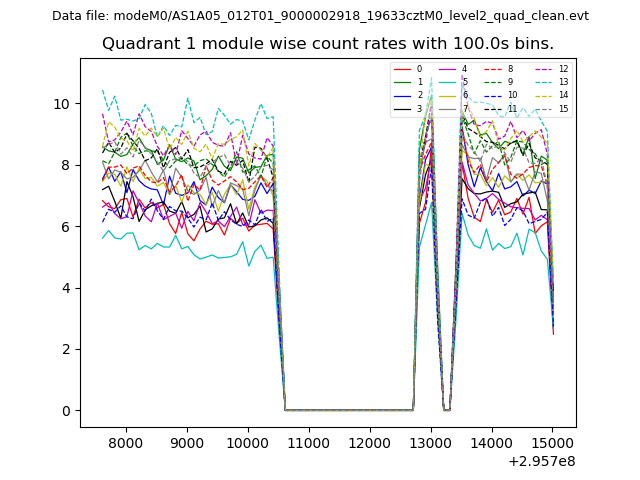
| Module-wise count rates for Quadrant A Data is divided into 100 sec bins |
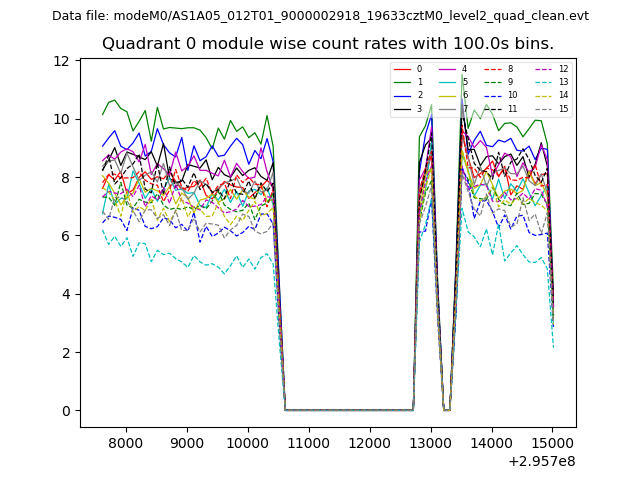 |
 |
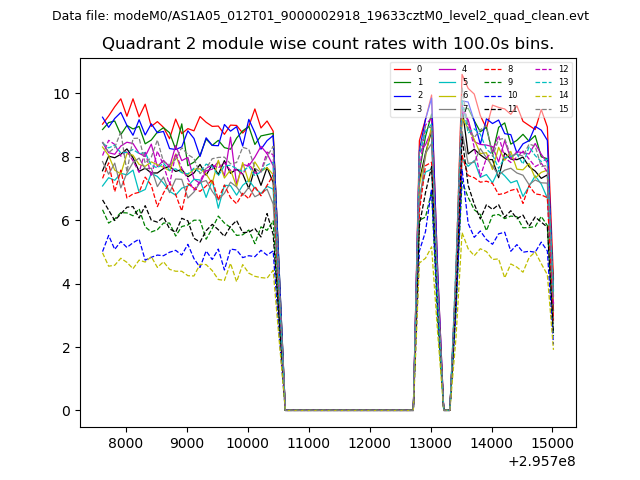
| Module-wise count rates for Quadrant B Data is divided into 100 sec bins |
 |
 |
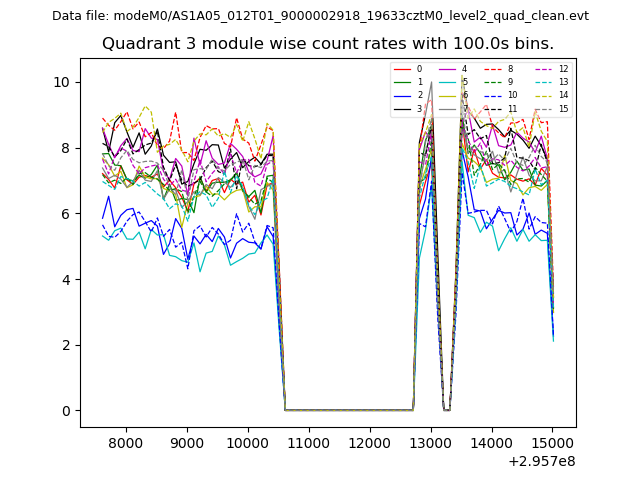
| Module-wise count rates for Quadrant C Data is divided into 100 sec bins |
 |
 |
| Module-wise count rates for Quadrant D Data is divided into 100 sec bins |
 |
 |
| Parameter | Plot |
|---|---|
| CZT HV Monitor | 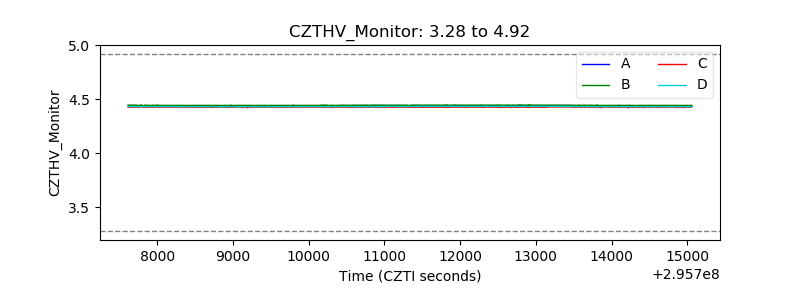 |
| D_VDD | 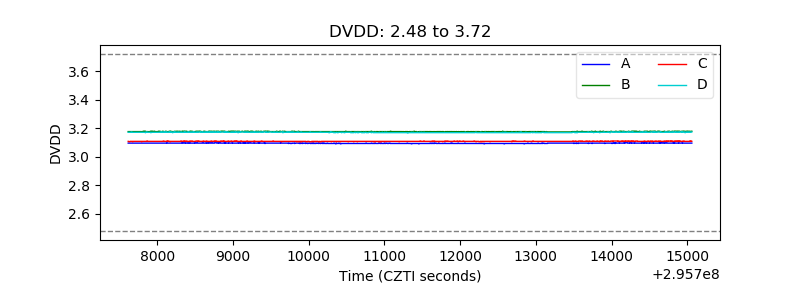 |
| Temperature 1 | 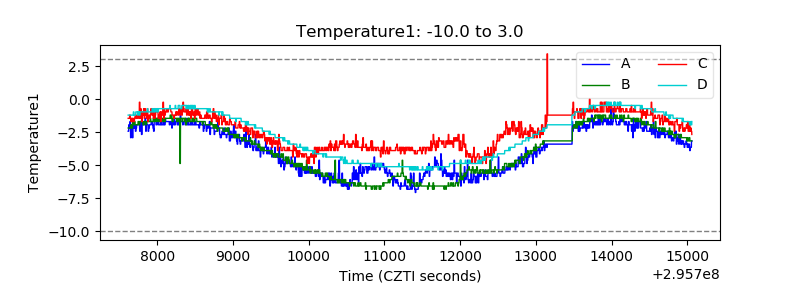 |
| Veto HV Monitor | 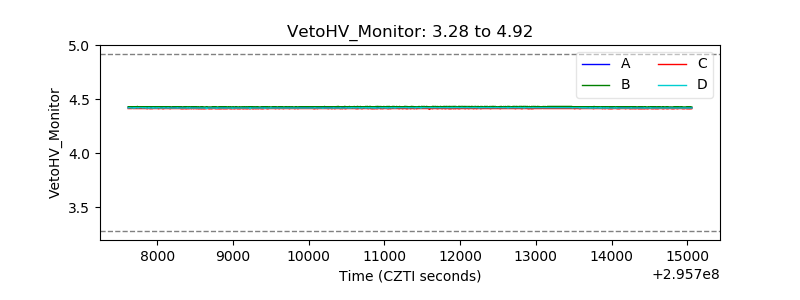 |
| Veto LLD |  |
| Alpha Counter | 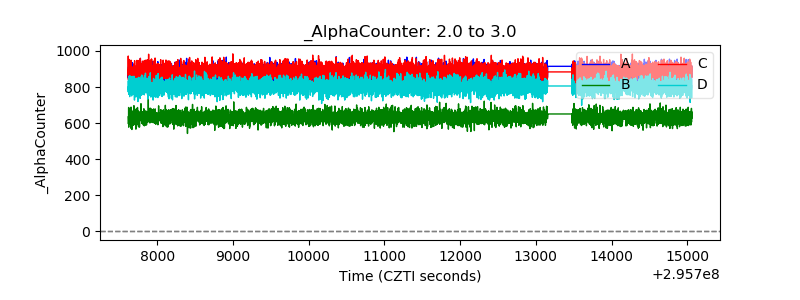 |
| _CPM_Rate | 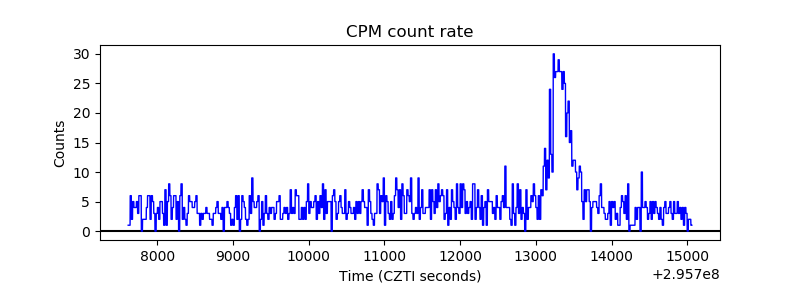 |
| CZT Counter | 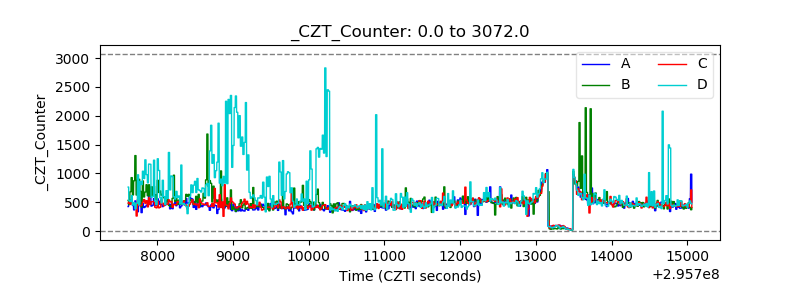 |
| +2.5 Volts monitor |  |
| +5 Volts monitor |  |
| _ROLL_ROT |  |
| _Roll_DEC |  |
| _Roll_RA | 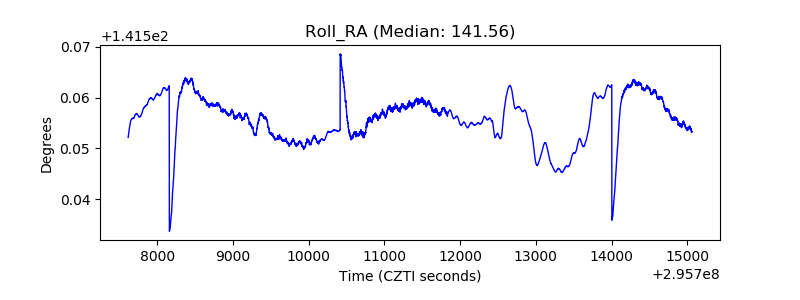 |
| Veto Counter | 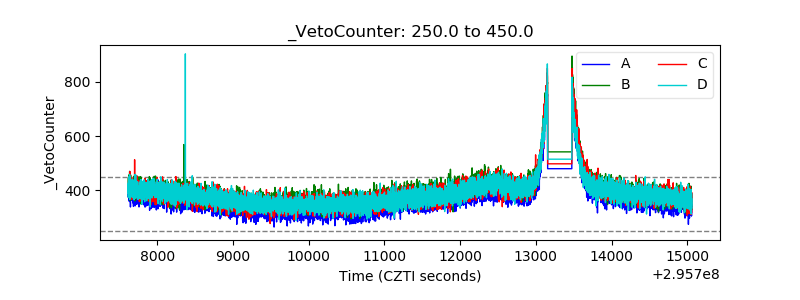 |