| Param | Original file | Final file |
|---|---|---|
| Filename | modeM0/AS1A05_012T01_9000002918_19635cztM0_level2.evt | modeM0/AS1A05_012T01_9000002918_19635cztM0_level2_quad_clean.evt |
| Size (bytes) | 188,496,000 | 50,086,080 |
| Size | 179.8 MB | 47.8 MB |
| Events in quadrant A | 1,298,821 | 339,038 |
| Events in quadrant B | 1,469,930 | 334,181 |
| Events in quadrant C | 1,314,339 | 323,292 |
| Events in quadrant D | 1,435,600 | 322,523 |
| Mode M0 | |||
|---|---|---|---|
| Quadrant | BADHDUFLAG | Total packets | Discarded packets |
| A | 0 | 5790 | 1 |
| B | 0 | 6246 | 1 |
| C | 0 | 5743 | 1 |
| D | 0 | 6185 | 1 |
| Mode SS | |||
|---|---|---|---|
| Quadrant | BADHDUFLAG | Total packets | Discarded packets |
| A | 0 | 56 | 0 |
| B | 0 | 56 | 0 |
| C | 0 | 56 | 0 |
| D | 0 | 56 | 0 |
| Mode M9 | |||
|---|---|---|---|
| Quadrant | BADHDUFLAG | Total packets | Discarded packets |
| A | 1 | 140576430222216 | 46 |
| B | 1 | -1 | -1 |
| C | 1 | -1 | -1 |
| D | 1 | -1 | -1 |
| Quadrant | Total seconds | Saturated seconds | Saturation percentage |
|---|---|---|---|
| A | 2758 | 34 | 1.232777% |
| B | 2758 | 103 | 3.734590% |
| C | 2758 | 39 | 1.414068% |
| D | 2758 | 33 | 1.196519% |
Noise dominated data is calculated using 1-second bins in cleaned event files. If a bin has >2000 counts, and if more than 50% of those come from <1% of pixels, then it is considered to be noise-dominated and hence unusable.
| Quadrant | # 1 sec bins | Bins with >0 counts | Bins with >2000 counts | High rate bins dominated by noise | Noise dominated (total time) | Noise dominated (detector-on time) | Marked lightcurve |
|---|---|---|---|---|---|---|---|
| A | 2758 | 2758 | 3 | 3 | 0.11% | 0.11% | 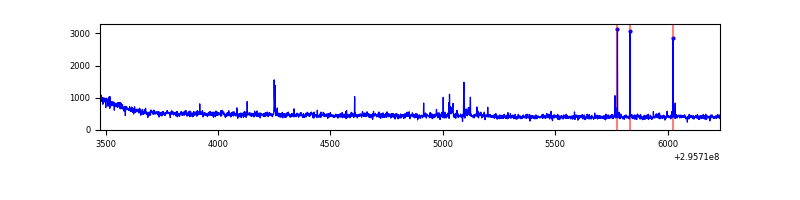 |
| B | 2758 | 2758 | 42 | 42 | 1.52% | 1.52% | 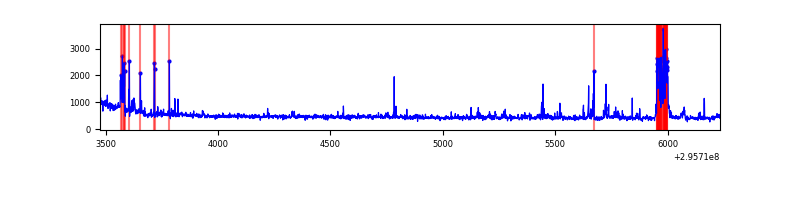 |
| C | 2758 | 2758 | 2 | 2 | 0.07% | 0.07% | 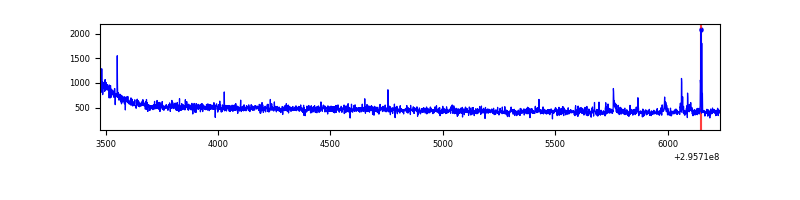 |
| D | 2758 | 2758 | 17 | 17 | 0.62% | 0.62% | 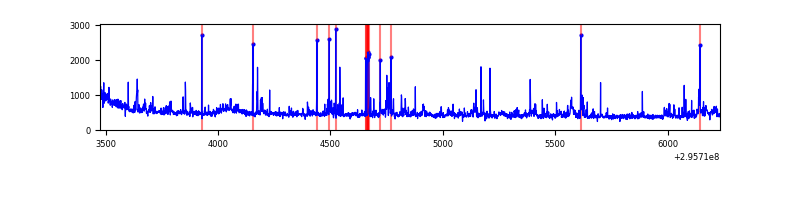 |
Top three noisy pixels from each quadrant. If the there are fewer than three noisy pixels in the level2.evt file, extra rows are filled as -1
| Pixel properties | Quadrant properties | ||||||
|---|---|---|---|---|---|---|---|
| Quadrant | DetID | PixID | Counts | Sigma | Mean | Median | Sigma |
| A | 5 | 16 | 37974 | 559.65 | 323 | 316 | 67.3 |
| A | 11 | 29 | 14654 | 213.08 | 323 | 316 | 67.3 |
| A | 13 | 254 | 3065 | 40.85 | 323 | 316 | 67.3 |
| B | 7 | 220 | 157443 | 2482.88 | 316 | 308 | 63.3 |
| B | 3 | 112 | 25192 | 393.19 | 316 | 308 | 63.3 |
| B | 4 | 216 | 13397 | 206.82 | 316 | 308 | 63.3 |
| C | 14 | 238 | 47992 | 640.91 | 307 | 309 | 74.4 |
| C | 3 | 233 | 41492 | 553.54 | 307 | 309 | 74.4 |
| C | 5 | 112 | 20733 | 274.52 | 307 | 309 | 74.4 |
| D | 1 | 52 | 71814 | 910.26 | 315 | 306 | 78.6 |
| D | 7 | 38 | 67644 | 857.18 | 315 | 306 | 78.6 |
| D | 13 | 172 | 29265 | 368.63 | 315 | 306 | 78.6 |
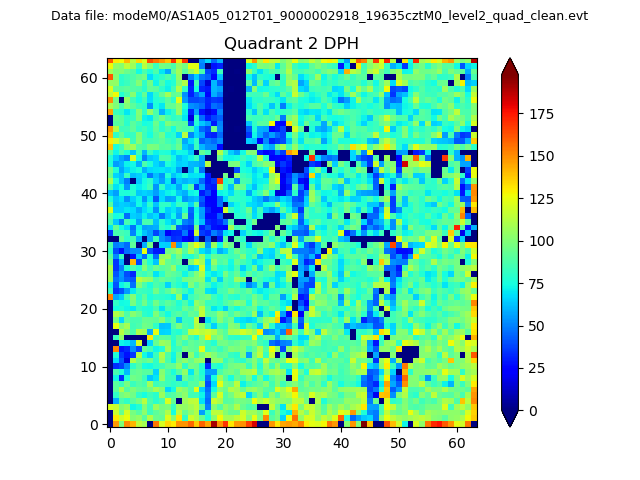
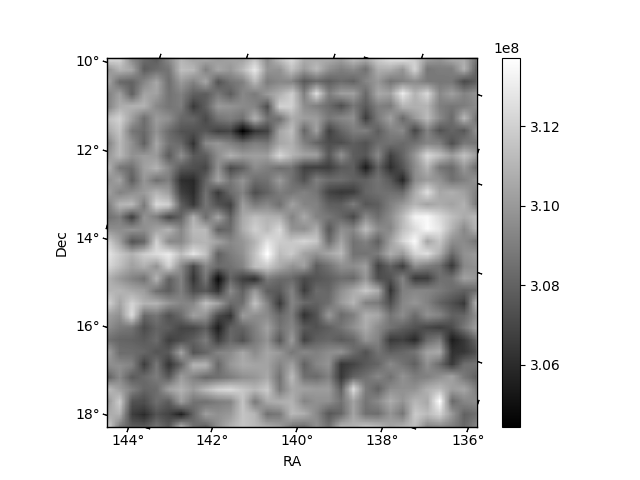
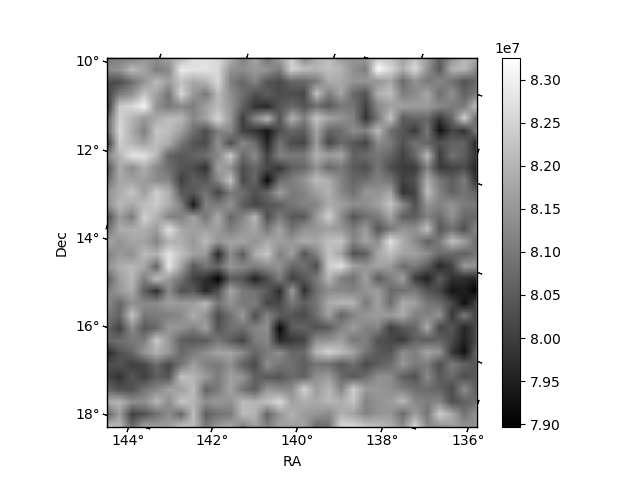
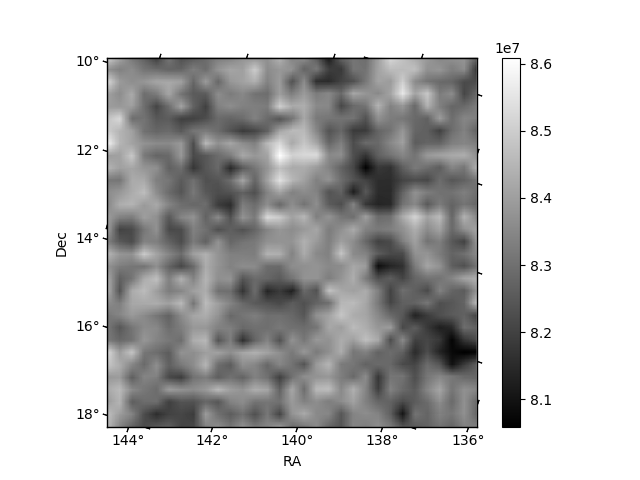
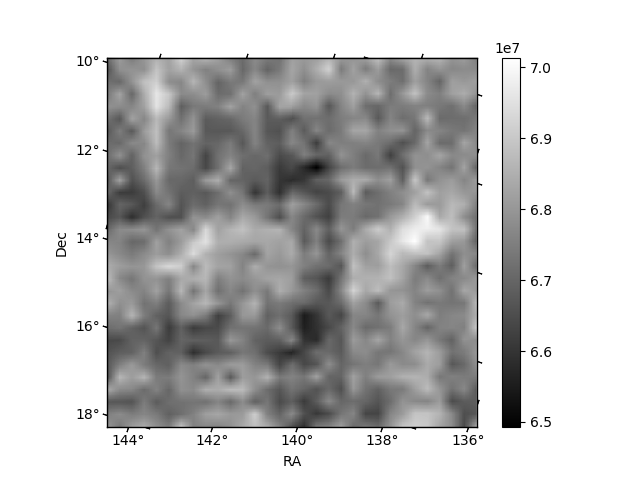
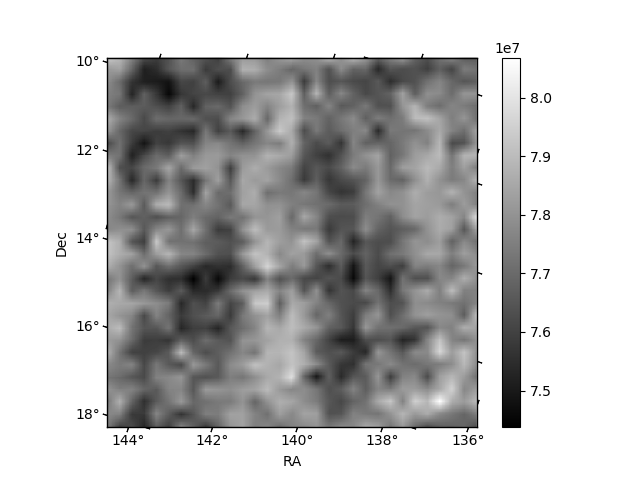
Histogram calculated using DETX and DETY for each event in the final _common_clean file
| Quadrant A | 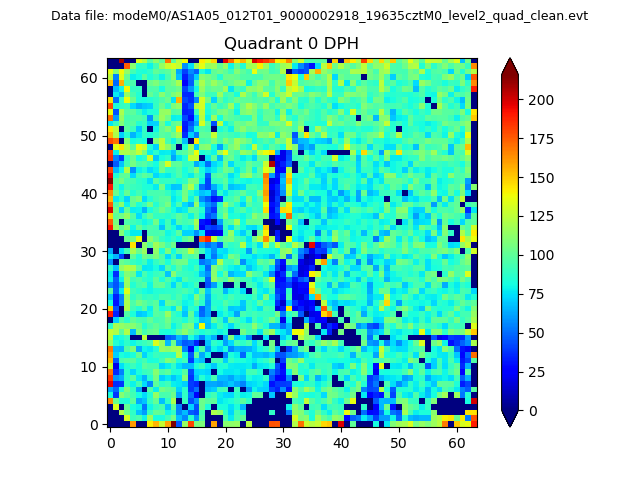 |
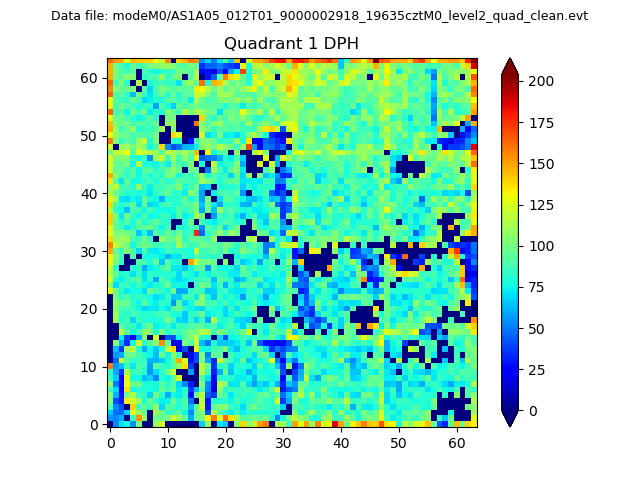 |
Quadrant B |
|---|---|---|---|
| Quadrant D | 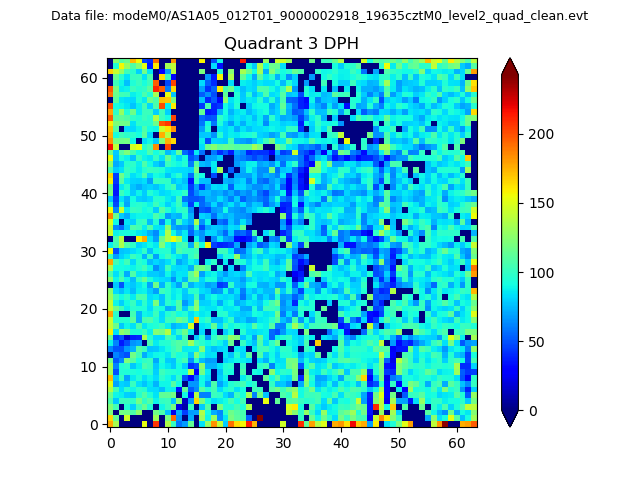 |
 |
Quadrant C |
| Plot type | Count rate plots | Images |
|---|---|---|
| Comparison with Poisson distribution Blue bars denote a histogram of data divided into 1 sec bins. Red curve is a Poisson curve with rate = median count rate of data. |
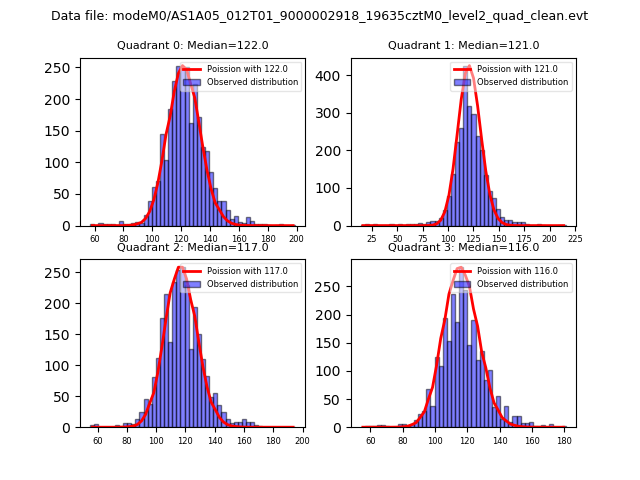 |
 |
| Quadrant-wise count rates Data is divided into 100 sec bins |
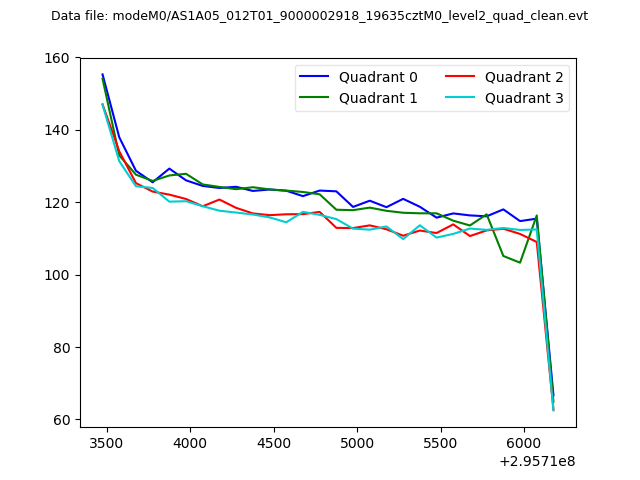 |
|
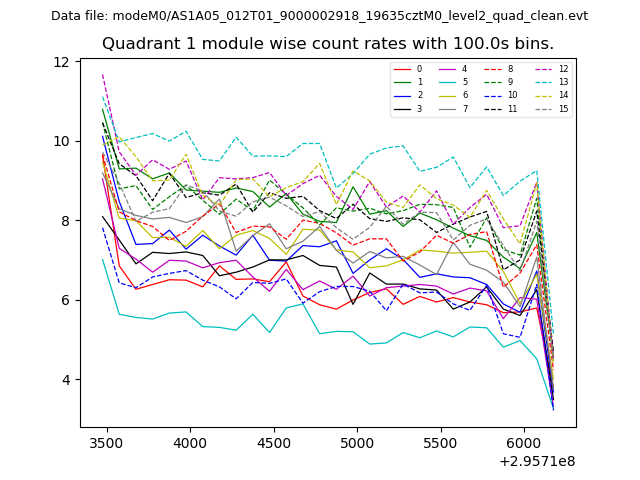
| Module-wise count rates for Quadrant A Data is divided into 100 sec bins |
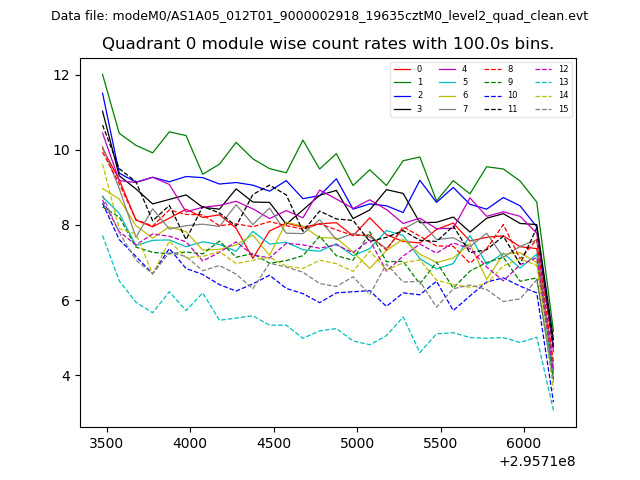 |
 |
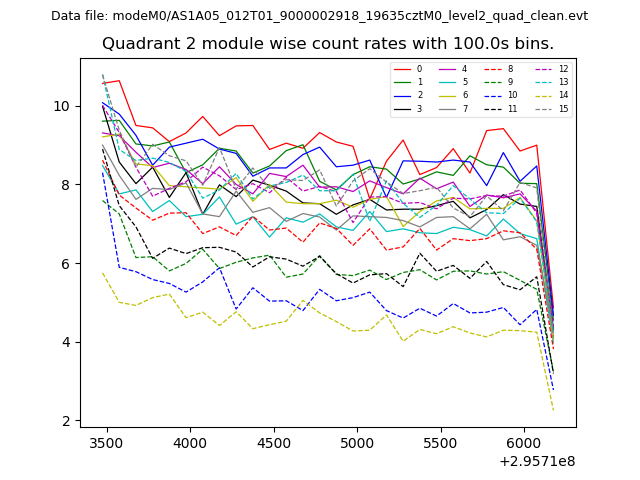
| Module-wise count rates for Quadrant B Data is divided into 100 sec bins |
 |
 |
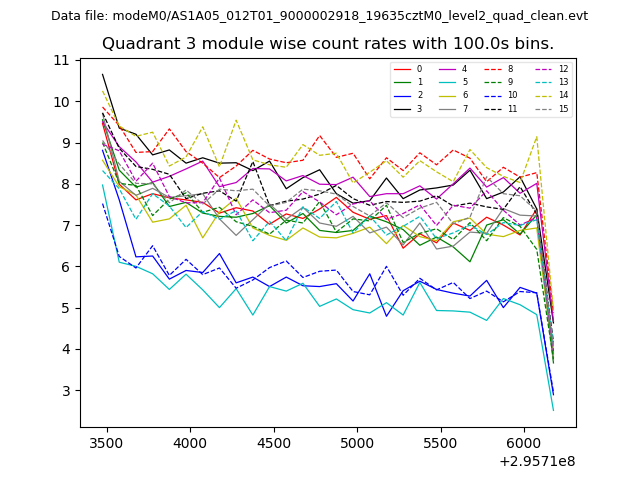
| Module-wise count rates for Quadrant C Data is divided into 100 sec bins |
 |
 |
| Module-wise count rates for Quadrant D Data is divided into 100 sec bins |
 |
 |
| Parameter | Plot |
|---|---|
| CZT HV Monitor | 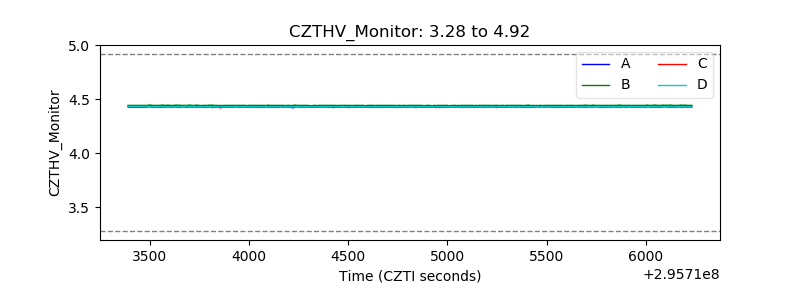 |
| D_VDD | 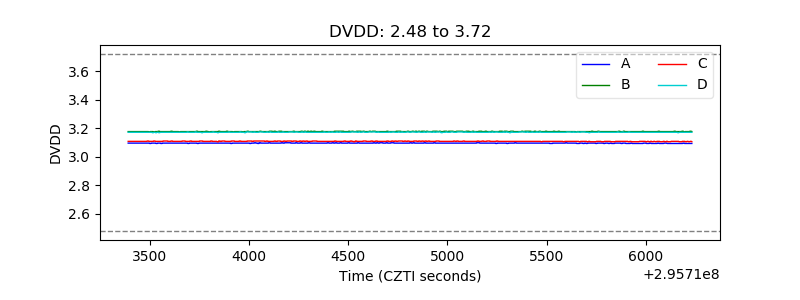 |
| Temperature 1 | 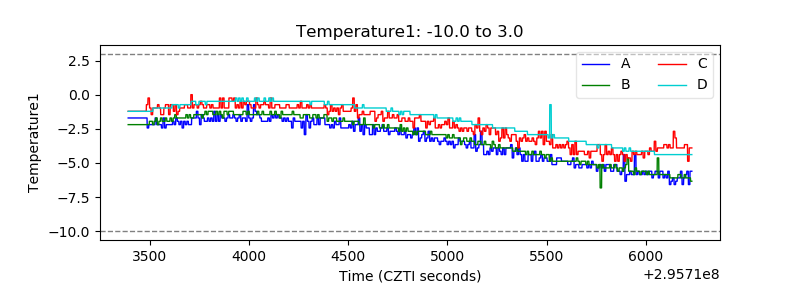 |
| Veto HV Monitor |  |
| Veto LLD | 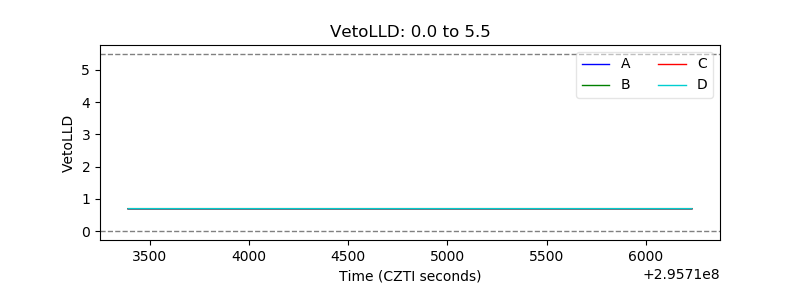 |
| Alpha Counter | 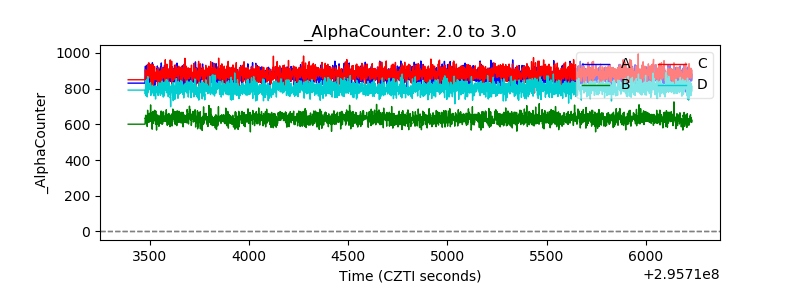 |
| _CPM_Rate | 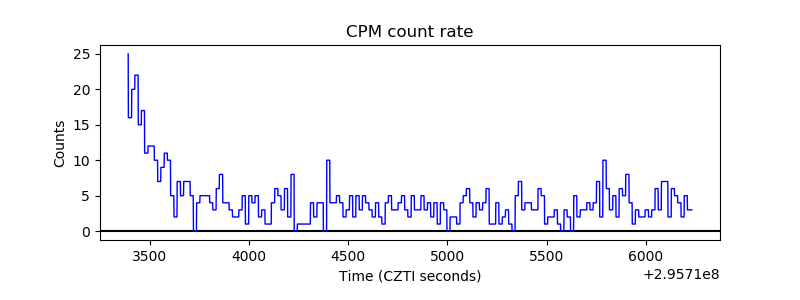 |
| CZT Counter | 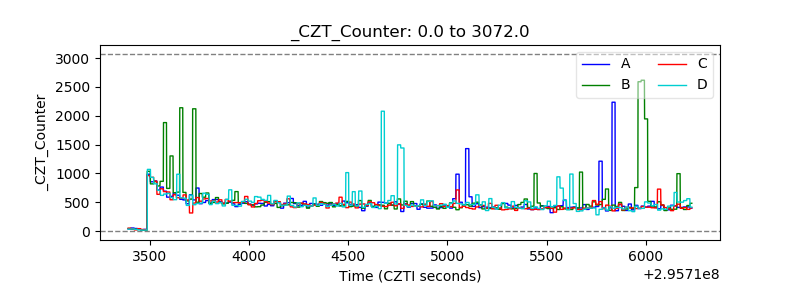 |
| +2.5 Volts monitor |  |
| +5 Volts monitor |  |
| _ROLL_ROT | 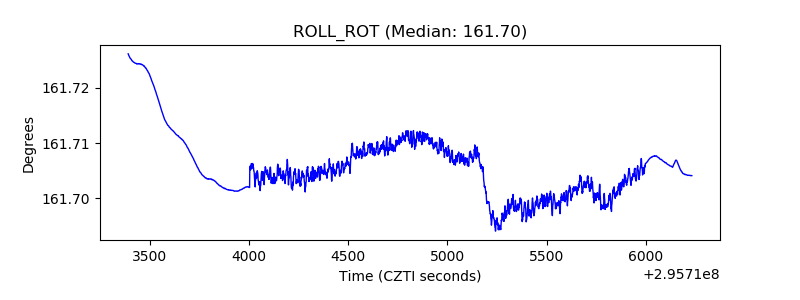 |
| _Roll_DEC | 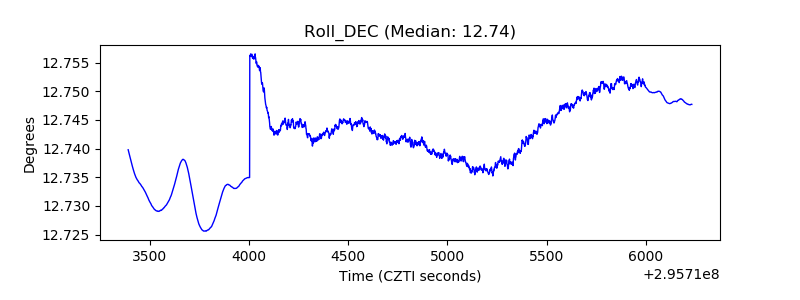 |
| _Roll_RA | 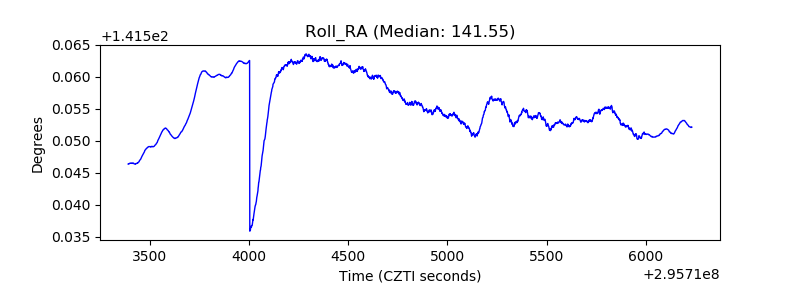 |
| Veto Counter |  |