| Param | Original file | Final file |
|---|---|---|
| Filename | modeM0/AS1A05_101T03_9000002920cztM0_level2.fits | modeM0/AS1A05_101T03_9000002920cztM0_level2_quad_clean.evt |
| Size (bytes) | 127,480,320 | 143,320,320 |
| Size | 121.6 MB | 136.7 MB |
| Events in quadrant A | 775,582 | 903,419 |
| Events in quadrant B | 741,534 | 889,089 |
| Events in quadrant C | 750,308 | 842,729 |
| Events in quadrant D | 646,456 | 758,064 |
| Mode SS | |||
|---|---|---|---|
| Quadrant | BADHDUFLAG | Total packets | Discarded packets |
| A | 0 | 280 | 0 |
| B | 0 | 280 | 0 |
| C | 0 | 280 | 0 |
| D | 0 | 280 | 0 |
| Mode M9 | |||
|---|---|---|---|
| Quadrant | BADHDUFLAG | Total packets | Discarded packets |
| A | 0 | 21 | 0 |
| B | 0 | 21 | 0 |
| C | 0 | 21 | 0 |
| D | 0 | 21 | 0 |
| Mode M0 | |||
|---|---|---|---|
| Quadrant | BADHDUFLAG | Total packets | Discarded packets |
| A | 0 | 27906 | 0 |
| B | 0 | 29341 | 0 |
| C | 0 | 28304 | 0 |
| D | 0 | 37462 | 0 |
| Quadrant | Total seconds | Saturated seconds | Saturation percentage |
|---|---|---|---|
| A | 13709 | 114 | 0.831571% |
| B | 13709 | 228 | 1.663141% |
| C | 13709 | 167 | 1.218178% |
| D | 13709 | 532 | 3.880662% |
Noise dominated data is calculated using 1-second bins in cleaned event files. If a bin has >2000 counts, and if more than 50% of those come from <1% of pixels, then it is considered to be noise-dominated and hence unusable.
| Quadrant | # 1 sec bins | Bins with >0 counts | Bins with >2000 counts | High rate bins dominated by noise | Noise dominated (total time) | Noise dominated (detector-on time) | Marked lightcurve |
|---|---|---|---|---|---|---|---|
| A | 15894 | 13706 | 0 | 0 | 0.00% | 0.00% |  |
| B | 15894 | 13707 | 0 | 0 | 0.00% | 0.00% |  |
| C | 15894 | 13707 | 0 | 0 | 0.00% | 0.00% |  |
| D | 15894 | 13688 | 0 | 0 | 0.00% | 0.00% |  |
Top three noisy pixels from each quadrant. If the there are fewer than three noisy pixels in the level2.evt file, extra rows are filled as -1
| Pixel properties | Quadrant properties | ||||||
|---|---|---|---|---|---|---|---|
| Quadrant | DetID | PixID | Counts | Sigma | Mean | Median | Sigma |
| A | 0 | 29 | 773 | 11.17 | 201 | 189 | 52.3 |
| A | 7 | 110 | 655 | 8.91 | 201 | 189 | 52.3 |
| A | 9 | 19 | 590 | 7.67 | 201 | 189 | 52.3 |
| B | 2 | 9 | 601 | 10.07 | 195 | 186 | 41.2 |
| B | 5 | 232 | 504 | 7.71 | 195 | 186 | 41.2 |
| B | 2 | 8 | 490 | 7.37 | 195 | 186 | 41.2 |
| C | 3 | 126 | 580 | 7.46 | 198 | 184 | 53.1 |
| C | 12 | 241 | 560 | 7.08 | 198 | 184 | 53.1 |
| C | 1 | 81 | 548 | 6.85 | 198 | 184 | 53.1 |
| D | 4 | 246 | 504 | 6.61 | 184 | 167 | 51.0 |
| D | 15 | 46 | 472 | 5.98 | 184 | 167 | 51.0 |
| D | 7 | 5 | 467 | 5.88 | 184 | 167 | 51.0 |
Histogram calculated using DETX and DETY for each event in the final _common_clean file
| Quadrant A | 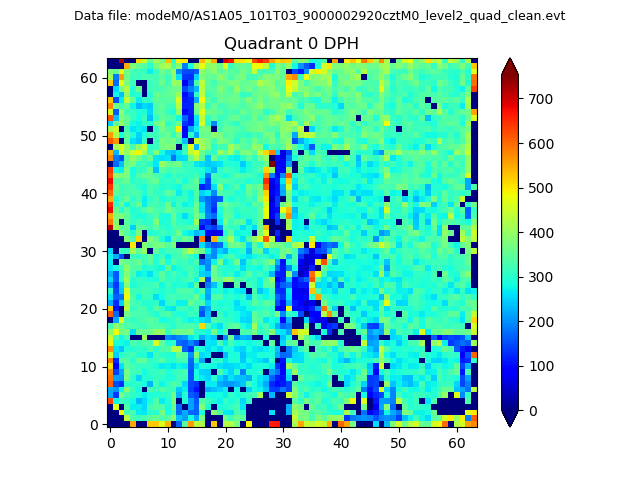 |
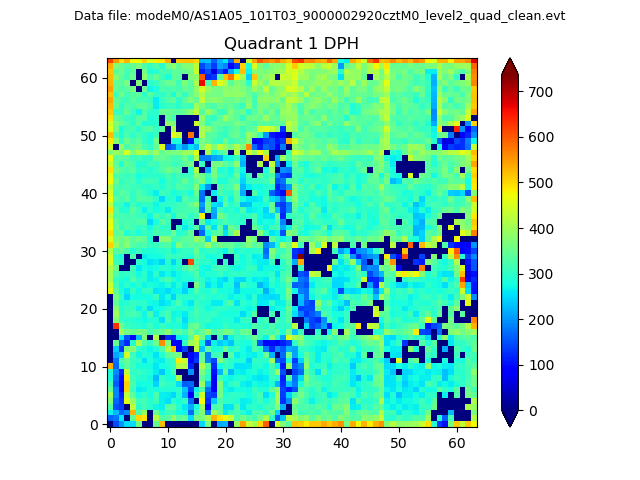 |
Quadrant B |
|---|---|---|---|
| Quadrant D |  |
 |
Quadrant C |
| Plot type | Count rate plots | Images |
|---|---|---|
| Comparison with Poisson distribution Blue bars denote a histogram of data divided into 1 sec bins. Red curve is a Poisson curve with rate = median count rate of data. |
 |
 |
| Quadrant-wise count rates Data is divided into 100 sec bins |
 |
|
| Module-wise count rates for Quadrant A Data is divided into 100 sec bins |
 |
 |
| Module-wise count rates for Quadrant B Data is divided into 100 sec bins |
 |
 |
| Module-wise count rates for Quadrant C Data is divided into 100 sec bins |
 |
 |
| Module-wise count rates for Quadrant D Data is divided into 100 sec bins |
 |
 |
| Parameter | Plot |
|---|---|
| CZT HV Monitor |  |
| D_VDD | 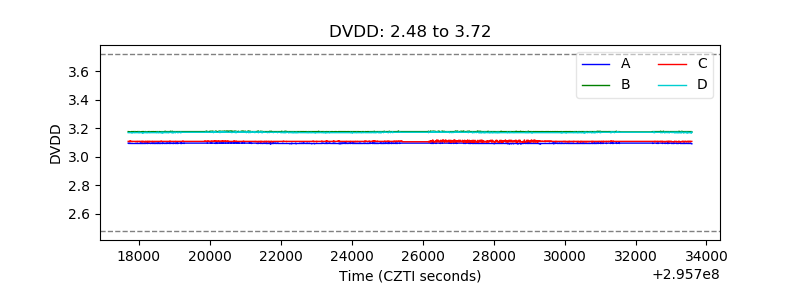 |
| Temperature 1 |  |
| Veto HV Monitor |  |
| Veto LLD |  |
| Alpha Counter |  |
| _CPM_Rate |  |
| CZT Counter |  |
| +2.5 Volts monitor |  |
| +5 Volts monitor |  |
| _ROLL_ROT |  |
| _Roll_DEC |  |
| _Roll_RA |  |
| Veto Counter |  |