| Param | Original file | Final file |
|---|---|---|
| Filename | modeM0/AS1A05_101T03_9000002920_19635cztM0_level2.evt | modeM0/AS1A05_101T03_9000002920_19635cztM0_level2_quad_clean.evt |
| Size (bytes) | 655,248,960 | 113,748,480 |
| Size | 624.9 MB | 108.5 MB |
| Events in quadrant A | 4,092,383 | 729,346 |
| Events in quadrant B | 4,437,190 | 729,221 |
| Events in quadrant C | 4,320,186 | 699,370 |
| Events in quadrant D | 6,397,668 | 675,547 |
| Mode SS | |||
|---|---|---|---|
| Quadrant | BADHDUFLAG | Total packets | Discarded packets |
| A | 0 | 180 | 0 |
| B | 0 | 180 | 0 |
| C | 0 | 180 | 0 |
| D | 0 | 180 | 0 |
| Mode M9 | |||
|---|---|---|---|
| Quadrant | BADHDUFLAG | Total packets | Discarded packets |
| A | 0 | 12 | 0 |
| B | 0 | 12 | 0 |
| C | 0 | 12 | 0 |
| D | 0 | 12 | 0 |
| Mode M0 | |||
|---|---|---|---|
| Quadrant | BADHDUFLAG | Total packets | Discarded packets |
| A | 0 | 17969 | 2 |
| B | 0 | 18884 | 2 |
| C | 0 | 18260 | 2 |
| D | 0 | 24922 | 2 |
| Quadrant | Total seconds | Saturated seconds | Saturation percentage |
|---|---|---|---|
| A | 8808 | 96 | 1.089918% |
| B | 8808 | 165 | 1.873297% |
| C | 8808 | 140 | 1.589464% |
| D | 8808 | 390 | 4.427793% |
Noise dominated data is calculated using 1-second bins in cleaned event files. If a bin has >2000 counts, and if more than 50% of those come from <1% of pixels, then it is considered to be noise-dominated and hence unusable.
| Quadrant | # 1 sec bins | Bins with >0 counts | Bins with >2000 counts | High rate bins dominated by noise | Noise dominated (total time) | Noise dominated (detector-on time) | Marked lightcurve |
|---|---|---|---|---|---|---|---|
| A | 10078 | 8808 | 0 | 0 | 0.00% | 0.00% | 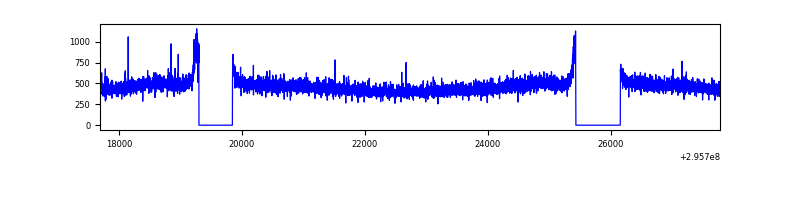 |
| B | 10078 | 8808 | 43 | 43 | 0.43% | 0.49% | 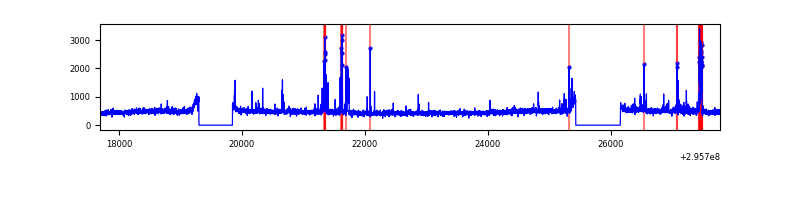 |
| C | 10078 | 8808 | 1 | 1 | 0.01% | 0.01% | 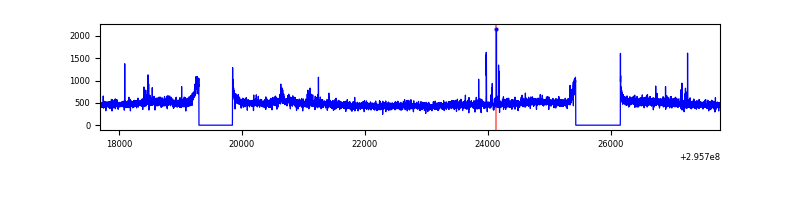 |
| D | 10078 | 8809 | 279 | 279 | 2.77% | 3.17% | 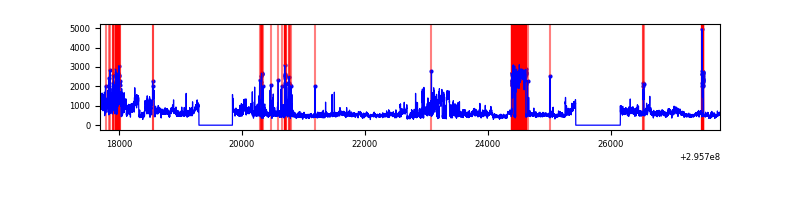 |
Top three noisy pixels from each quadrant. If the there are fewer than three noisy pixels in the level2.evt file, extra rows are filled as -1
| Pixel properties | Quadrant properties | ||||||
|---|---|---|---|---|---|---|---|
| Quadrant | DetID | PixID | Counts | Sigma | Mean | Median | Sigma |
| A | 11 | 29 | 12279 | 52.36 | 1058 | 1033 | 214.8 |
| A | 13 | 254 | 9631 | 40.03 | 1058 | 1033 | 214.8 |
| A | 0 | 226 | 9138 | 37.74 | 1058 | 1033 | 214.8 |
| B | 7 | 220 | 224546 | 1098.62 | 1048 | 1019 | 203.5 |
| B | 3 | 112 | 39749 | 190.36 | 1048 | 1019 | 203.5 |
| B | 4 | 216 | 30731 | 146.03 | 1048 | 1019 | 203.5 |
| C | 3 | 233 | 170283 | 714.82 | 1010 | 1015 | 236.8 |
| C | 14 | 238 | 154892 | 649.82 | 1010 | 1015 | 236.8 |
| C | 5 | 112 | 32621 | 133.47 | 1010 | 1015 | 236.8 |
| D | 1 | 52 | 1697050 | 6825.26 | 1015 | 985 | 248.5 |
| D | 7 | 238 | 434888 | 1746.1 | 1015 | 985 | 248.5 |
| D | 1 | 20 | 255097 | 1022.59 | 1015 | 985 | 248.5 |
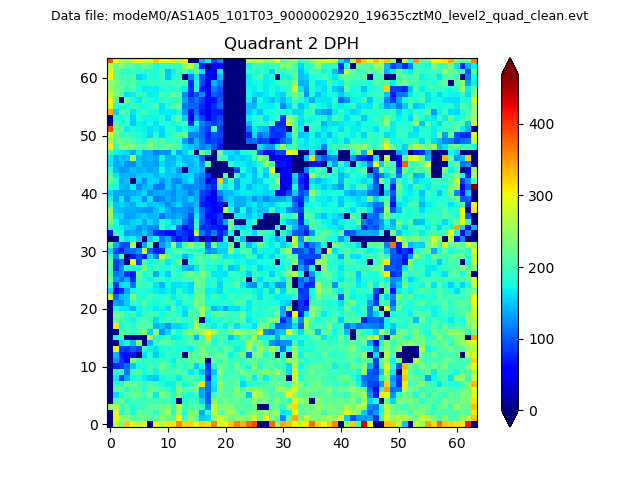
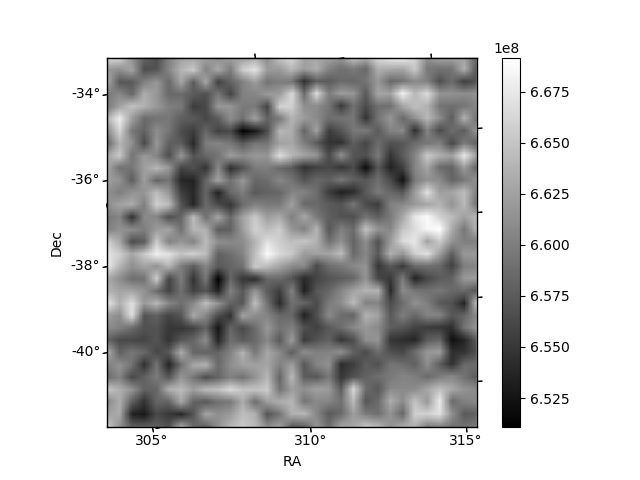
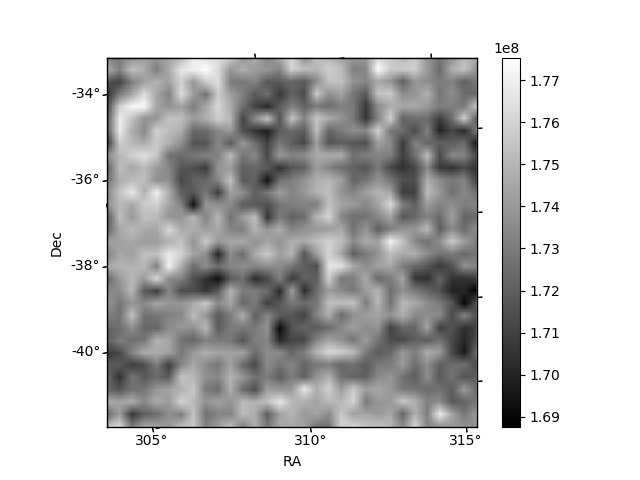
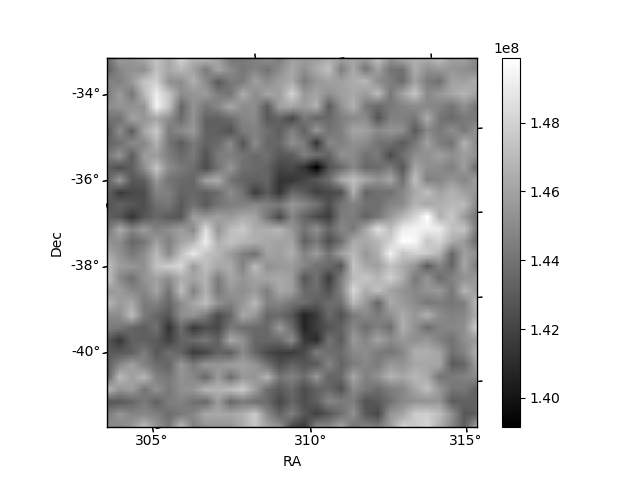
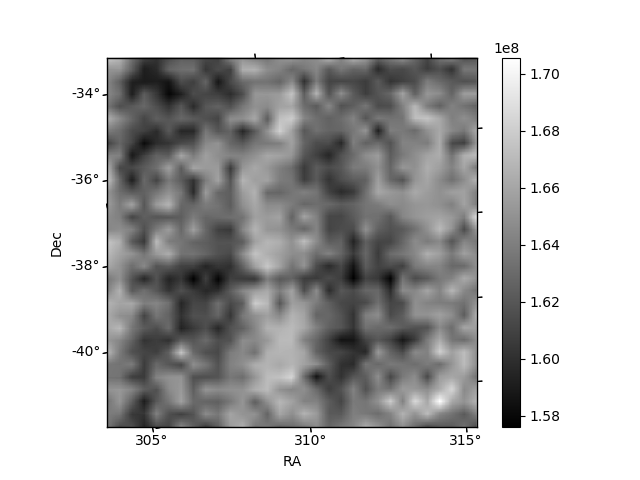
Histogram calculated using DETX and DETY for each event in the final _common_clean file
| Quadrant A | 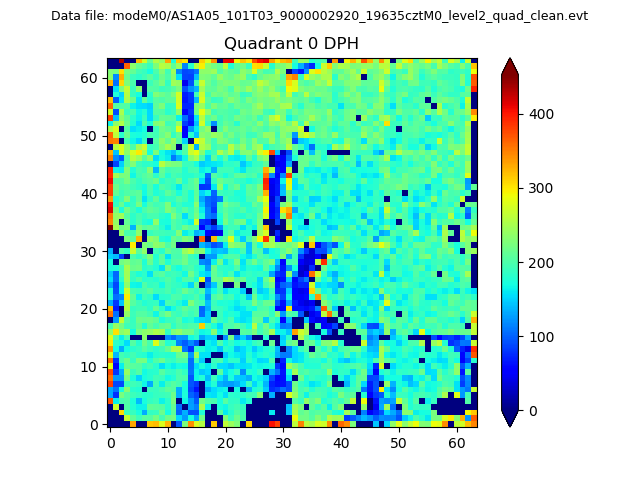 |
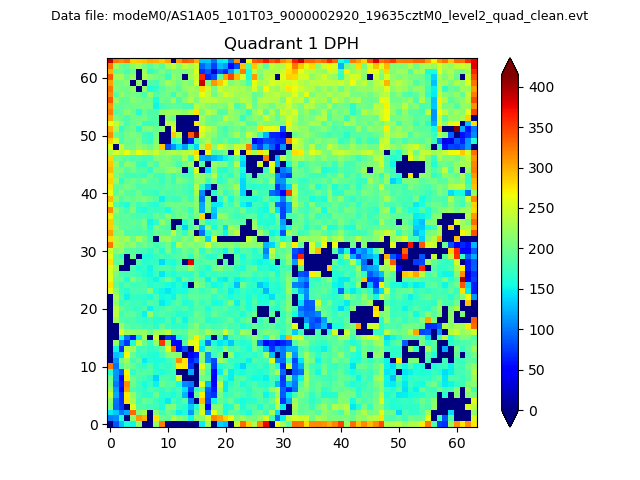 |
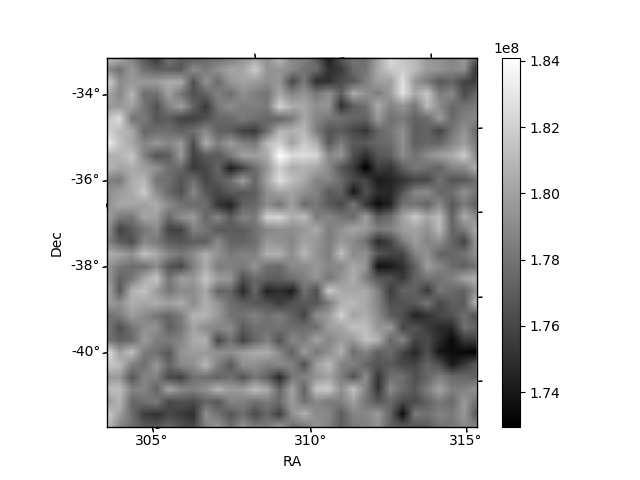
Quadrant B |
|---|---|---|---|
| Quadrant D | 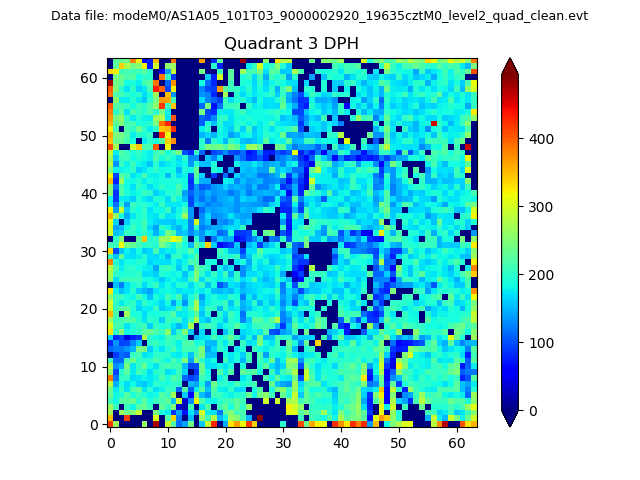 |
 |
Quadrant C |
| Plot type | Count rate plots | Images |
|---|---|---|
| Comparison with Poisson distribution Blue bars denote a histogram of data divided into 1 sec bins. Red curve is a Poisson curve with rate = median count rate of data. |
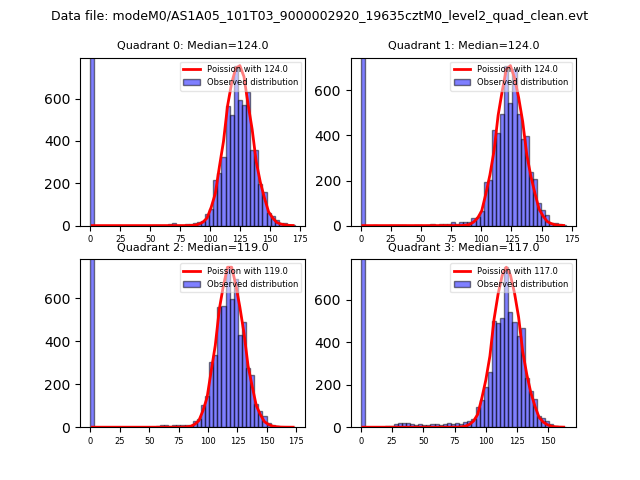 |
 |
| Quadrant-wise count rates Data is divided into 100 sec bins |
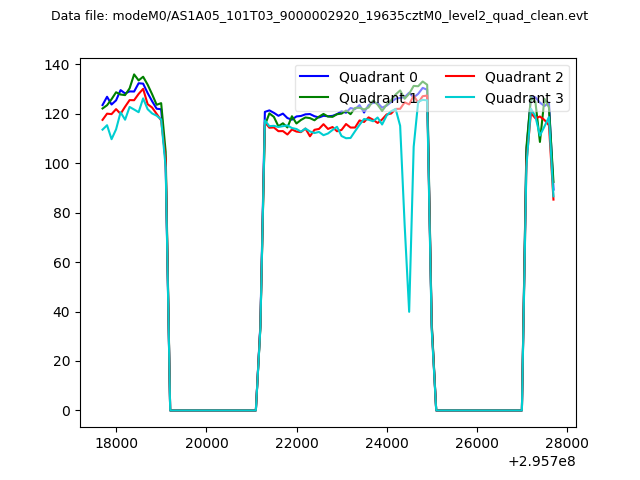 |
|
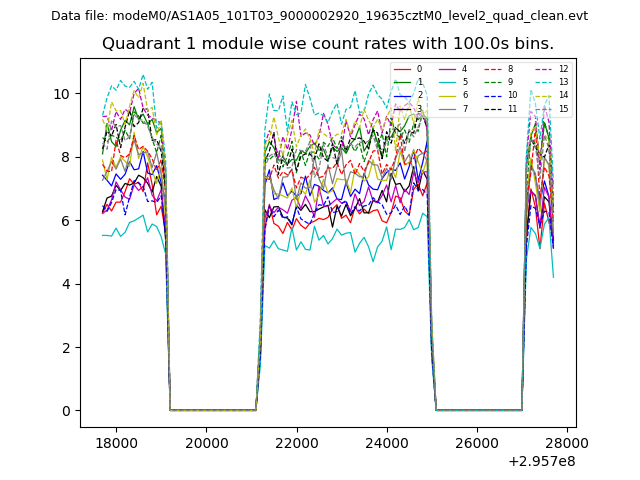
| Module-wise count rates for Quadrant A Data is divided into 100 sec bins |
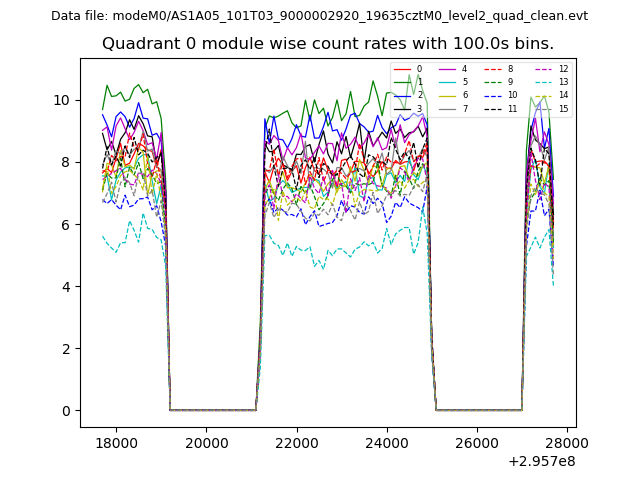 |
 |
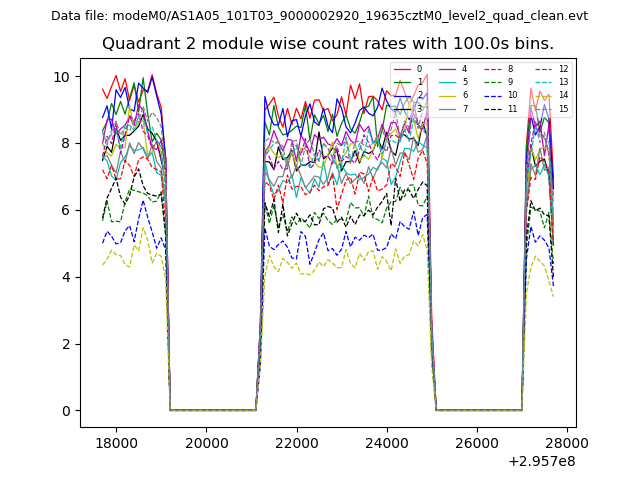
| Module-wise count rates for Quadrant B Data is divided into 100 sec bins |
 |
 |
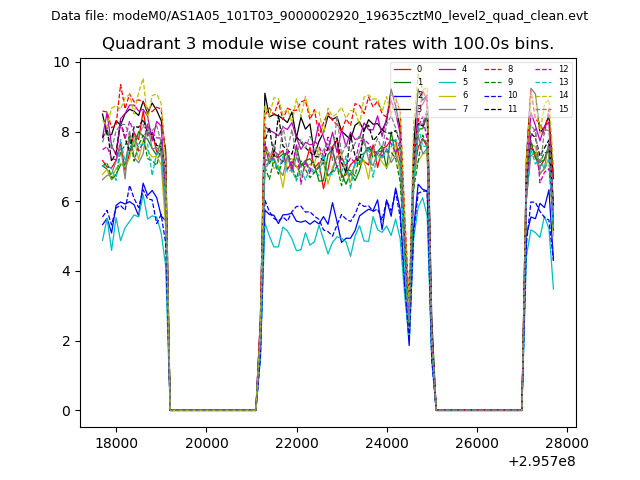
| Module-wise count rates for Quadrant C Data is divided into 100 sec bins |
 |
 |
| Module-wise count rates for Quadrant D Data is divided into 100 sec bins |
 |
 |
| Parameter | Plot |
|---|---|
| CZT HV Monitor | 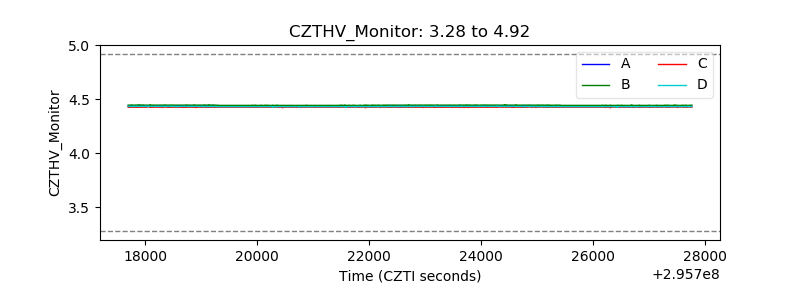 |
| D_VDD | 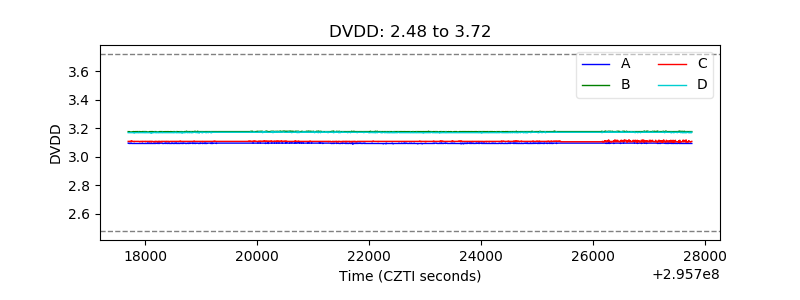 |
| Temperature 1 | 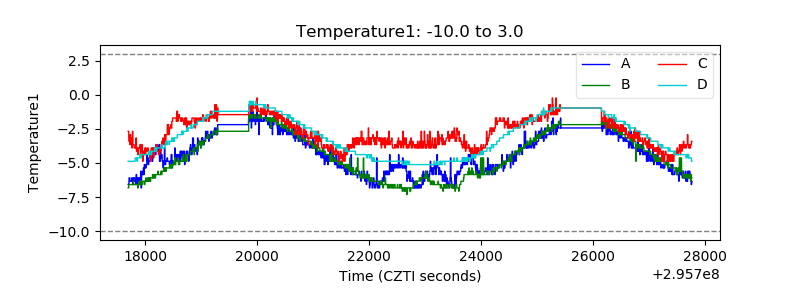 |
| Veto HV Monitor | 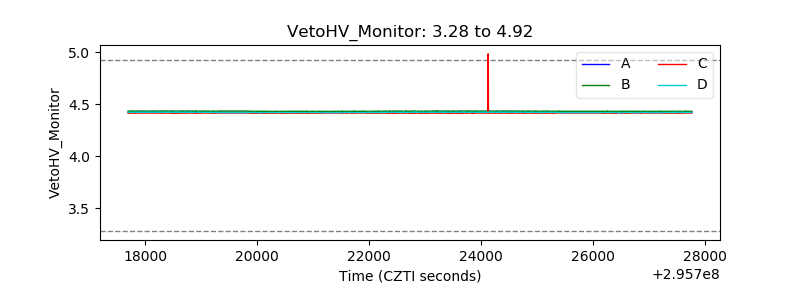 |
| Veto LLD |  |
| Alpha Counter | 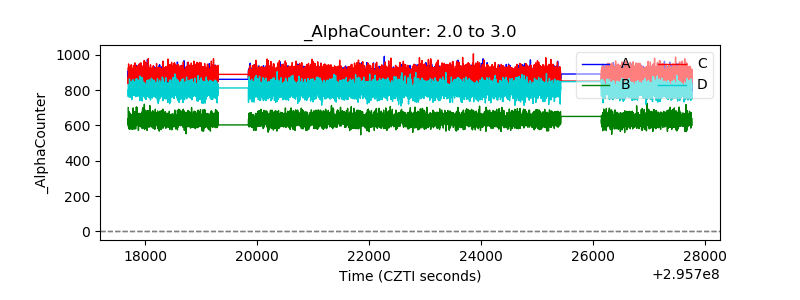 |
| _CPM_Rate | 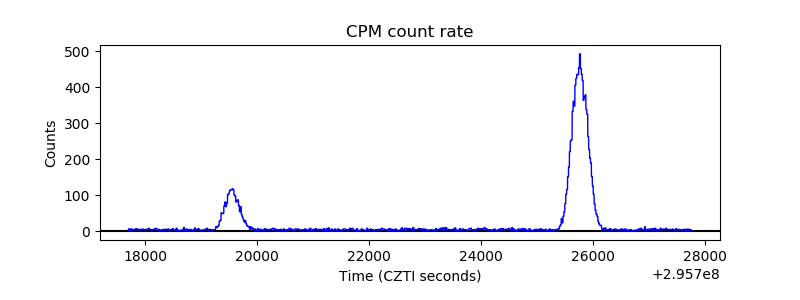 |
| CZT Counter | 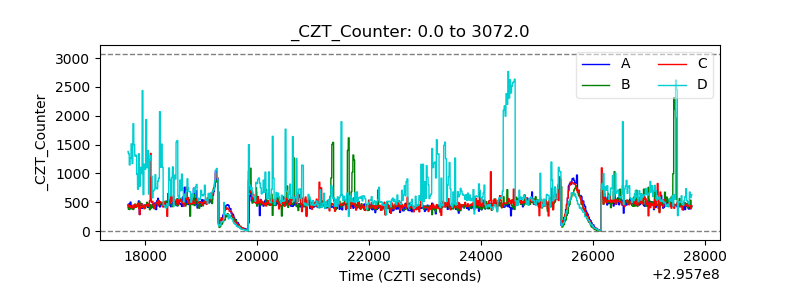 |
| +2.5 Volts monitor |  |
| +5 Volts monitor |  |
| _ROLL_ROT | 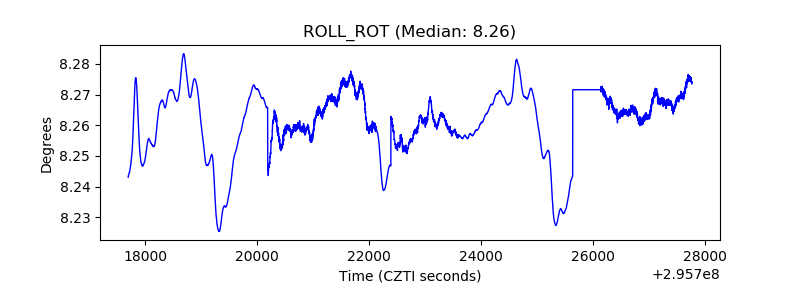 |
| _Roll_DEC | 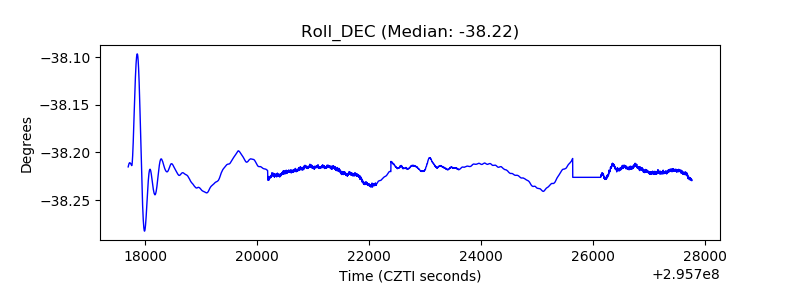 |
| _Roll_RA | 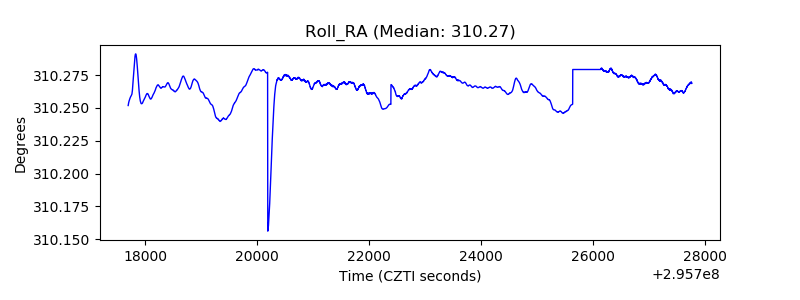 |
| Veto Counter |  |