| Param | Original file | Final file |
|---|---|---|
| Filename | modeM0/AS1A05_101T03_9000002920_19637cztM0_level2.evt | modeM0/AS1A05_101T03_9000002920_19637cztM0_level2_quad_clean.evt |
| Size (bytes) | 114,468,480 | 13,927,680 |
| Size | 109.2 MB | 13.3 MB |
| Events in quadrant A | 701,217 | 83,959 |
| Events in quadrant B | 838,831 | 84,806 |
| Events in quadrant C | 715,221 | 79,942 |
| Events in quadrant D | 1,115,853 | 70,330 |
| Mode SS | |||
|---|---|---|---|
| Quadrant | BADHDUFLAG | Total packets | Discarded packets |
| A | 0 | 28 | 0 |
| B | 0 | 28 | 0 |
| C | 0 | 28 | 0 |
| D | 0 | 28 | 0 |
| Mode M9 | |||
|---|---|---|---|
| Quadrant | BADHDUFLAG | Total packets | Discarded packets |
| A | 0 | 9 | 0 |
| B | 0 | 9 | 0 |
| C | 0 | 9 | 0 |
| D | 0 | 9 | 0 |
| Mode M0 | |||
|---|---|---|---|
| Quadrant | BADHDUFLAG | Total packets | Discarded packets |
| A | 0 | 2856 | 1 |
| B | 0 | 3320 | 1 |
| C | 0 | 2898 | 1 |
| D | 0 | 4263 | 1 |
| Quadrant | Total seconds | Saturated seconds | Saturation percentage |
|---|---|---|---|
| A | 1370 | 18 | 1.313869% |
| B | 1370 | 61 | 4.452555% |
| C | 1370 | 19 | 1.386861% |
| D | 1371 | 128 | 9.336251% |
Noise dominated data is calculated using 1-second bins in cleaned event files. If a bin has >2000 counts, and if more than 50% of those come from <1% of pixels, then it is considered to be noise-dominated and hence unusable.
| Quadrant | # 1 sec bins | Bins with >0 counts | Bins with >2000 counts | High rate bins dominated by noise | Noise dominated (total time) | Noise dominated (detector-on time) | Marked lightcurve |
|---|---|---|---|---|---|---|---|
| A | 2285 | 1371 | 0 | 0 | 0.00% | 0.00% | 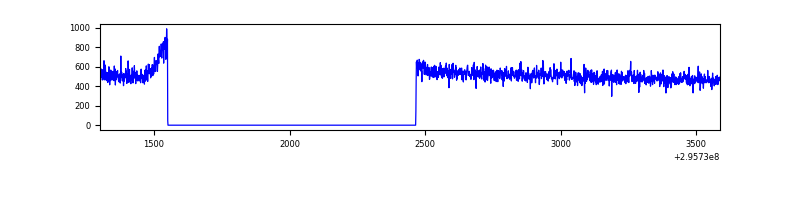 |
| B | 2285 | 1371 | 14 | 14 | 0.61% | 1.02% | 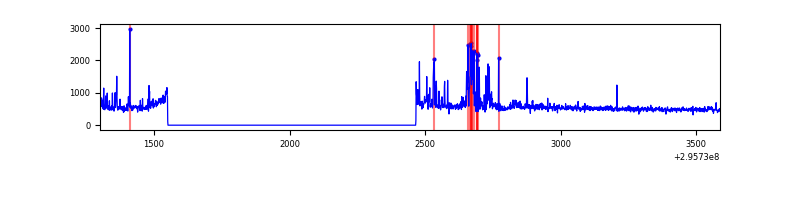 |
| C | 2285 | 1371 | 2 | 2 | 0.09% | 0.15% | 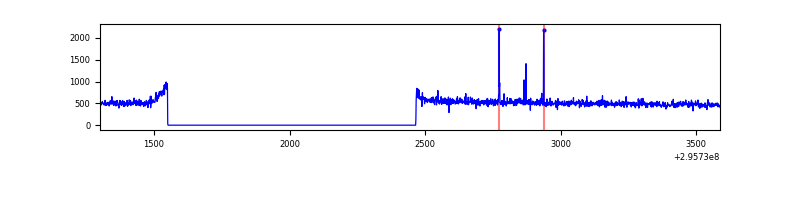 |
| D | 2286 | 1371 | 104 | 104 | 4.55% | 7.59% | 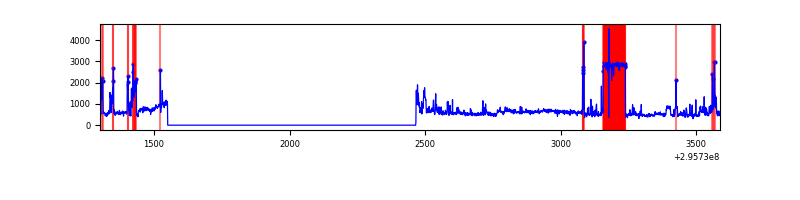 |
Top three noisy pixels from each quadrant. If the there are fewer than three noisy pixels in the level2.evt file, extra rows are filled as -1
| Pixel properties | Quadrant properties | ||||||
|---|---|---|---|---|---|---|---|
| Quadrant | DetID | PixID | Counts | Sigma | Mean | Median | Sigma |
| A | 0 | 226 | 1642 | 37.98 | 182 | 177 | 38.6 |
| A | 3 | 137 | 1536 | 35.23 | 182 | 177 | 38.6 |
| A | 13 | 254 | 1436 | 32.64 | 182 | 177 | 38.6 |
| B | 7 | 220 | 97092 | 2601.33 | 181 | 176 | 37.3 |
| B | 3 | 112 | 16417 | 435.93 | 181 | 176 | 37.3 |
| B | 0 | 198 | 6093 | 158.82 | 181 | 176 | 37.3 |
| C | 14 | 238 | 26795 | 633.08 | 171 | 172 | 42.1 |
| C | 5 | 112 | 10339 | 241.77 | 171 | 172 | 42.1 |
| C | 3 | 233 | 6162 | 142.44 | 171 | 172 | 42.1 |
| D | 1 | 52 | 337864 | 8010.78 | 166 | 161 | 42.2 |
| D | 7 | 238 | 110265 | 2611.82 | 166 | 161 | 42.2 |
| D | 1 | 20 | 36402 | 859.69 | 166 | 161 | 42.2 |
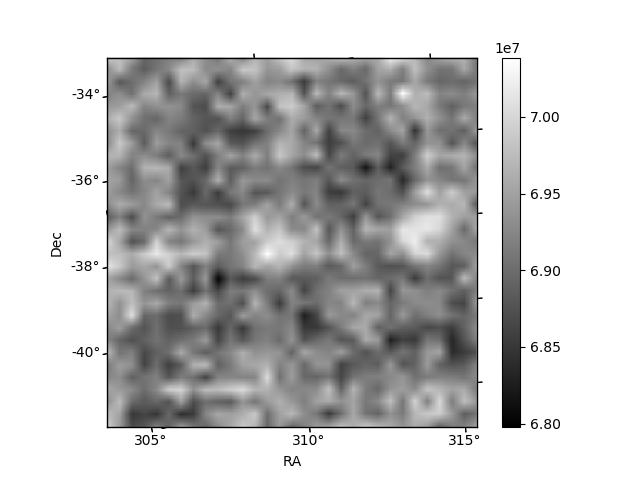
Histogram calculated using DETX and DETY for each event in the final _common_clean file
| Quadrant A | 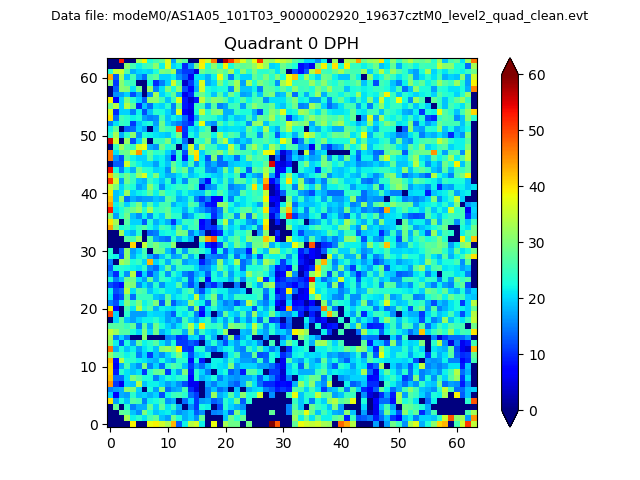 |
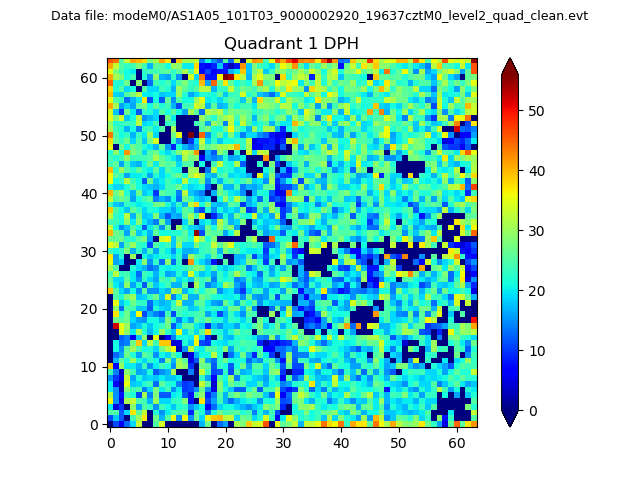 |
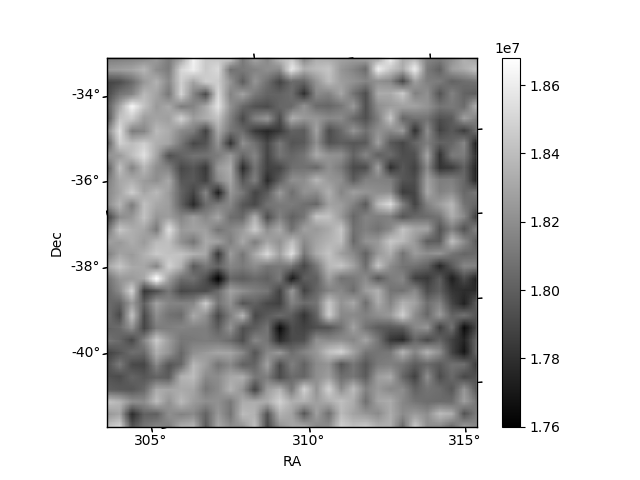
Quadrant B |
|---|---|---|---|
| Quadrant D |  |
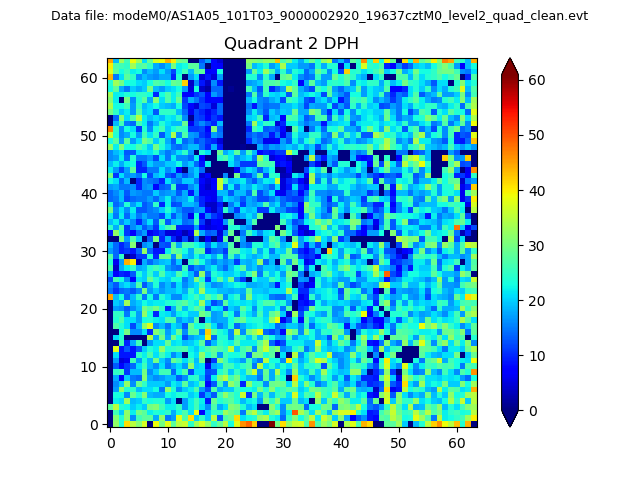 |
Quadrant C |
| Plot type | Count rate plots | Images |
|---|---|---|
| Comparison with Poisson distribution Blue bars denote a histogram of data divided into 1 sec bins. Red curve is a Poisson curve with rate = median count rate of data. |
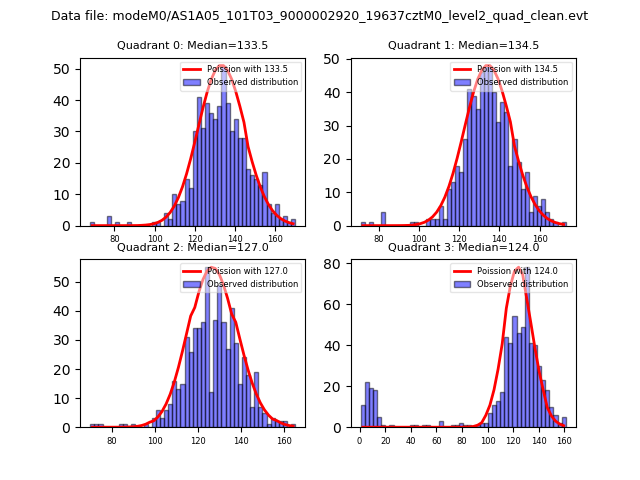 |
 |
| Quadrant-wise count rates Data is divided into 100 sec bins |
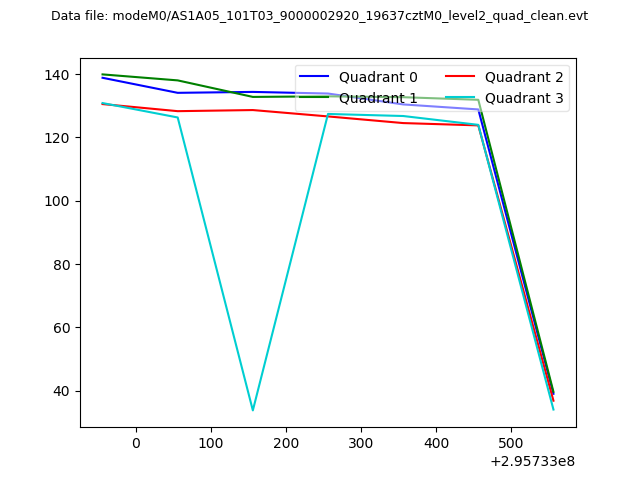 |
|
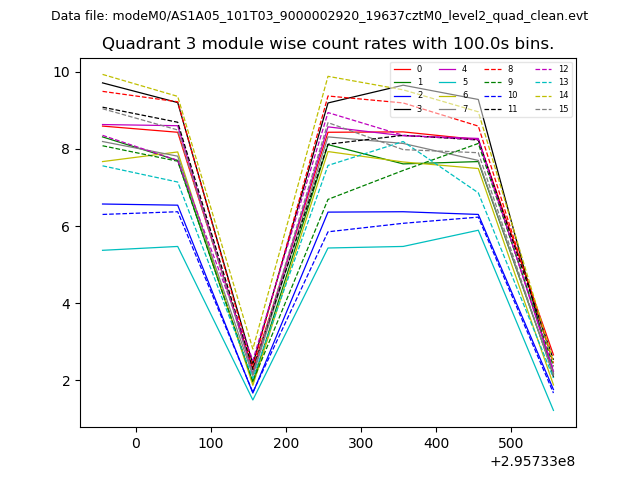
| Module-wise count rates for Quadrant A Data is divided into 100 sec bins |
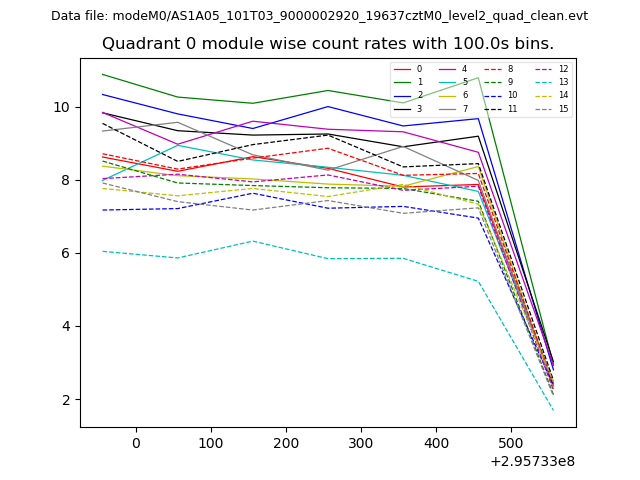 |
 |
| Module-wise count rates for Quadrant B Data is divided into 100 sec bins |
 |
 |
| Module-wise count rates for Quadrant C Data is divided into 100 sec bins |
 |
 |
| Module-wise count rates for Quadrant D Data is divided into 100 sec bins |
 |
 |
| Parameter | Plot |
|---|---|
| CZT HV Monitor |  |
| D_VDD | 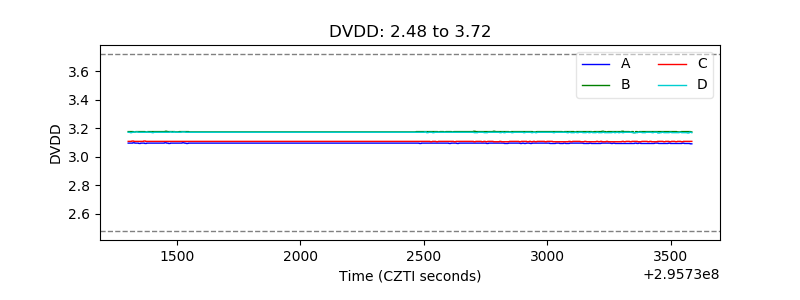 |
| Temperature 1 | 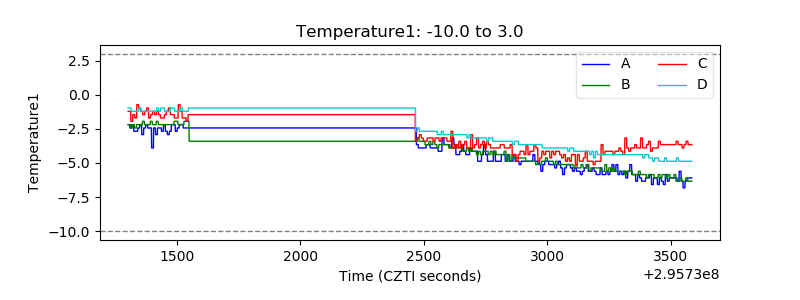 |
| Veto HV Monitor | 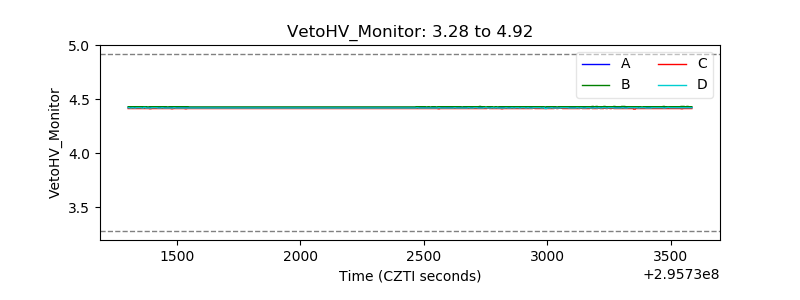 |
| Veto LLD | 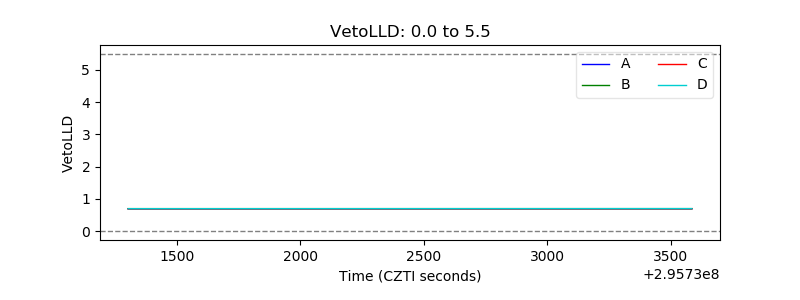 |
| Alpha Counter | 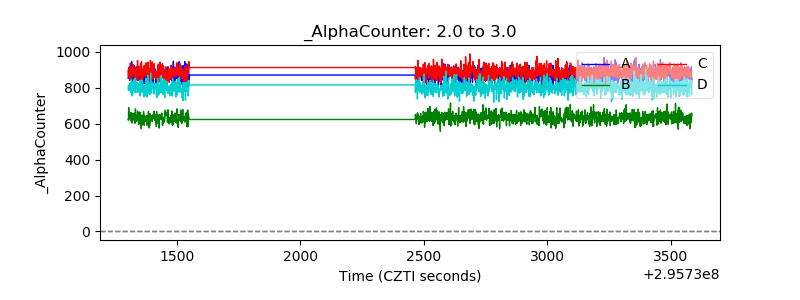 |
| _CPM_Rate | 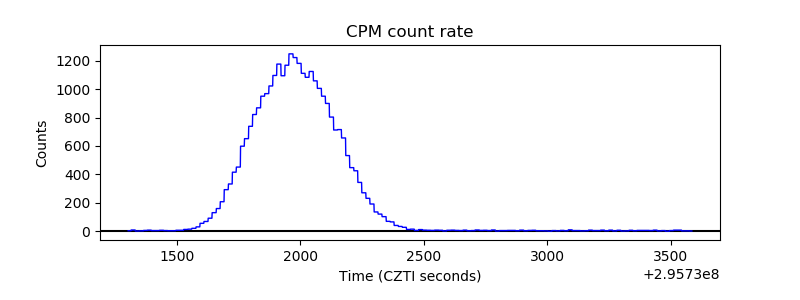 |
| CZT Counter | 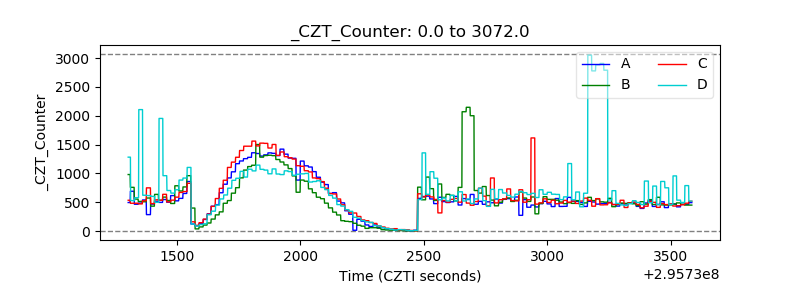 |
| +2.5 Volts monitor |  |
| +5 Volts monitor | 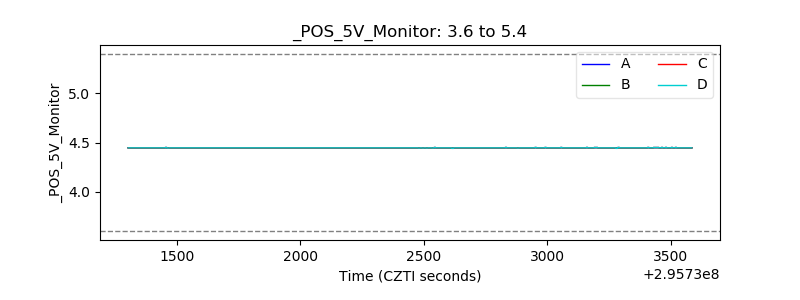 |
| _ROLL_ROT | 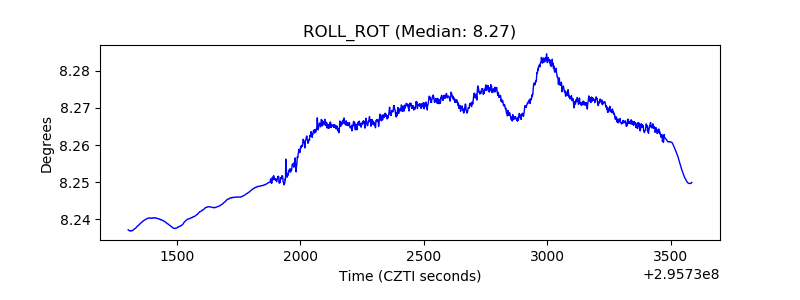 |
| _Roll_DEC | 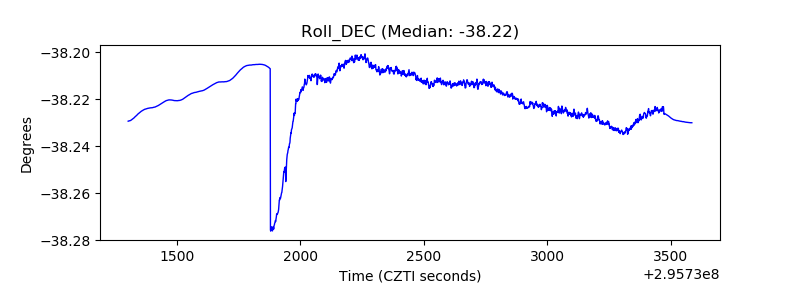 |
| _Roll_RA |  |
| Veto Counter | 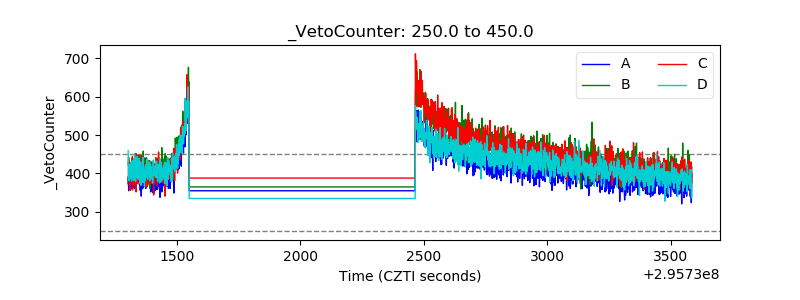 |