| Param | Original file | Final file |
|---|---|---|
| Filename | modeM0/AS1A05_101T08_9000002922cztM0_level2.fits | modeM0/AS1A05_101T08_9000002922cztM0_level2_quad_clean.evt |
| Size (bytes) | 335,108,160 | 176,169,600 |
| Size | 319.6 MB | 168.0 MB |
| Events in quadrant A | 2,092,446 | 820,807 |
| Events in quadrant B | 1,993,062 | 818,803 |
| Events in quadrant C | 2,071,750 | 791,101 |
| Events in quadrant D | 1,733,432 | 644,000 |
| Mode M9 | |||
|---|---|---|---|
| Quadrant | BADHDUFLAG | Total packets | Discarded packets |
| A | 0 | 74 | 0 |
| B | 0 | 74 | 0 |
| C | 0 | 74 | 0 |
| D | 0 | 74 | 0 |
| Mode M0 | |||
|---|---|---|---|
| Quadrant | BADHDUFLAG | Total packets | Discarded packets |
| A | 0 | 68066 | 0 |
| B | 0 | 73909 | 0 |
| C | 0 | 68688 | 0 |
| D | 0 | 108948 | 0 |
| Mode SS | |||
|---|---|---|---|
| Quadrant | BADHDUFLAG | Total packets | Discarded packets |
| A | 0 | 670 | 0 |
| B | 0 | 670 | 0 |
| C | 0 | 670 | 0 |
| D | 0 | 670 | 0 |
| Quadrant | Total seconds | Saturated seconds | Saturation percentage |
|---|---|---|---|
| A | 32853 | 209 | 0.636167% |
| B | 32853 | 540 | 1.643686% |
| C | 32853 | 344 | 1.047089% |
| D | 32853 | 3011 | 9.165069% |
Noise dominated data is calculated using 1-second bins in cleaned event files. If a bin has >2000 counts, and if more than 50% of those come from <1% of pixels, then it is considered to be noise-dominated and hence unusable.
| Quadrant | # 1 sec bins | Bins with >0 counts | Bins with >2000 counts | High rate bins dominated by noise | Noise dominated (total time) | Noise dominated (detector-on time) | Marked lightcurve |
|---|---|---|---|---|---|---|---|
| A | 40269 | 32851 | 0 | 0 | 0.00% | 0.00% | 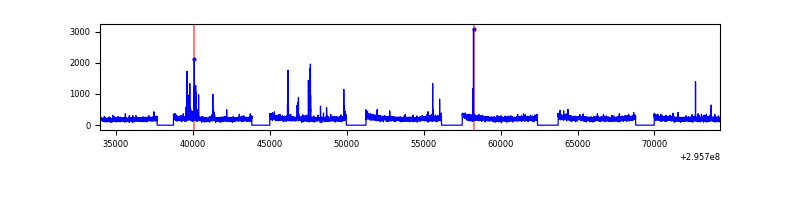 |
| B | 40269 | 32852 | 0 | 0 | 0.00% | 0.00% | 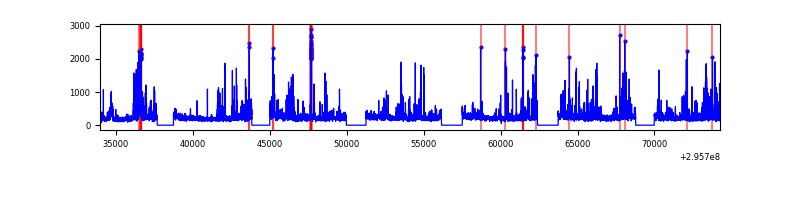 |
| C | 40269 | 32853 | 0 | 0 | 0.00% | 0.00% | 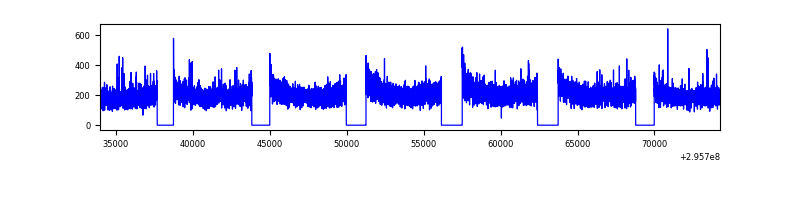 |
| D | 40269 | 32844 | 0 | 0 | 0.00% | 0.00% | 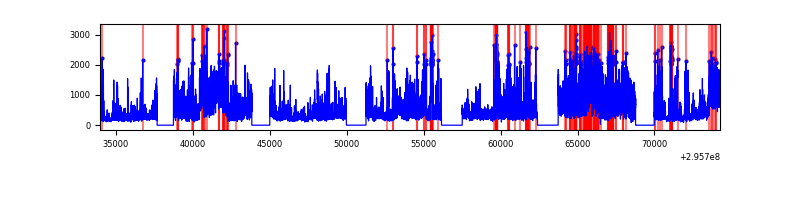 |
Top three noisy pixels from each quadrant. If the there are fewer than three noisy pixels in the level2.evt file, extra rows are filled as -1
| Pixel properties | Quadrant properties | ||||||
|---|---|---|---|---|---|---|---|
| Quadrant | DetID | PixID | Counts | Sigma | Mean | Median | Sigma |
| A | 0 | 29 | 1926 | 10.5 | 545 | 513 | 134.5 |
| A | 7 | 110 | 1620 | 8.23 | 545 | 513 | 134.5 |
| A | 9 | 19 | 1522 | 7.5 | 545 | 513 | 134.5 |
| B | 2 | 9 | 1690 | 11.46 | 526 | 504 | 103.5 |
| B | 2 | 8 | 1411 | 8.76 | 526 | 504 | 103.5 |
| B | 5 | 225 | 1284 | 7.54 | 526 | 504 | 103.5 |
| C | 1 | 80 | 1575 | 7.61 | 547 | 517 | 139.1 |
| C | 1 | 81 | 1568 | 7.56 | 547 | 517 | 139.1 |
| C | 12 | 241 | 1387 | 6.26 | 547 | 517 | 139.1 |
| D | 6 | 231 | 1266 | 6.28 | 495 | 454 | 129.3 |
| D | 10 | 189 | 1263 | 6.26 | 495 | 454 | 129.3 |
| D | 15 | 46 | 1259 | 6.22 | 495 | 454 | 129.3 |
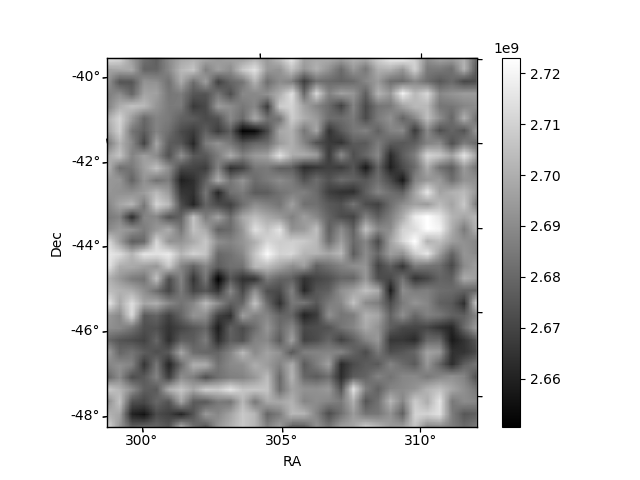
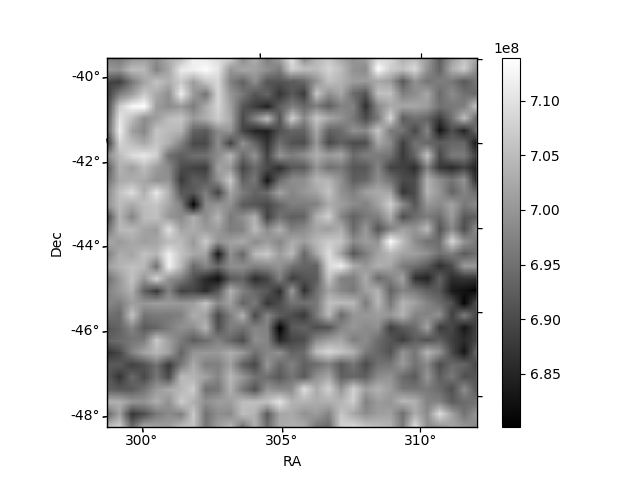
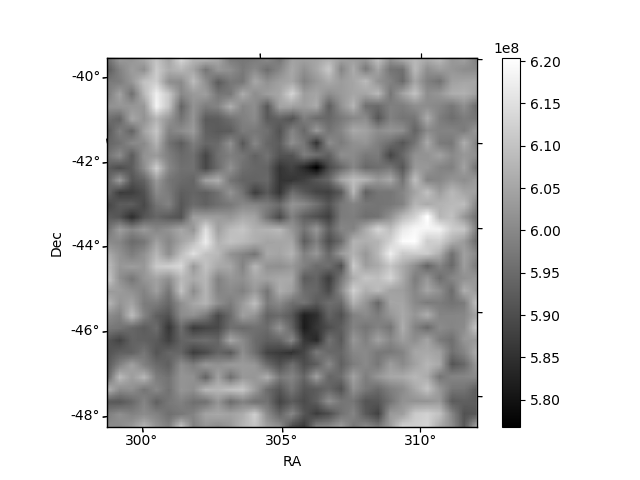
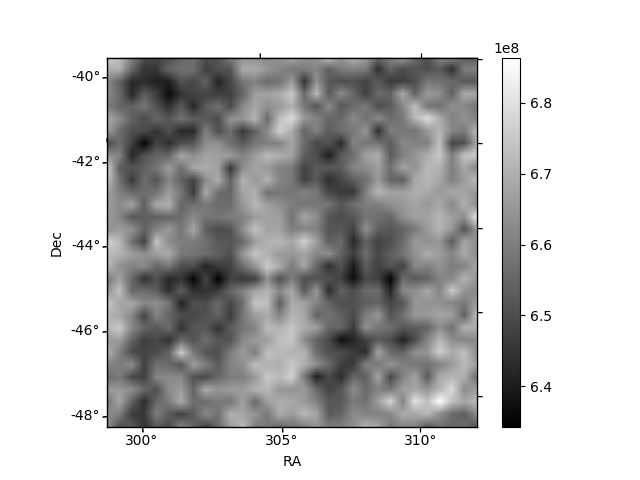
Histogram calculated using DETX and DETY for each event in the final _common_clean file
| Quadrant A | 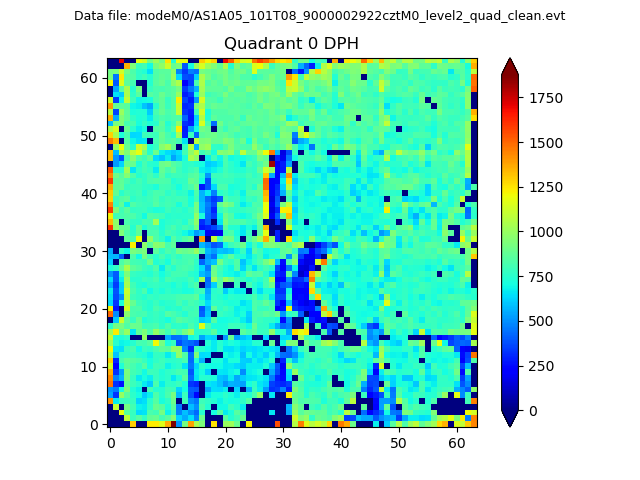 |
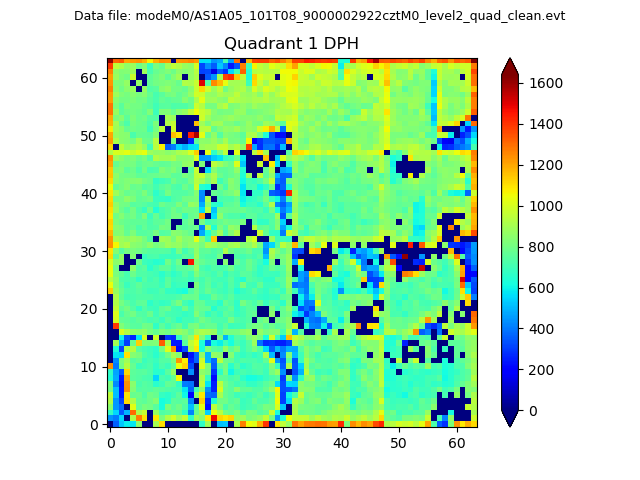 |
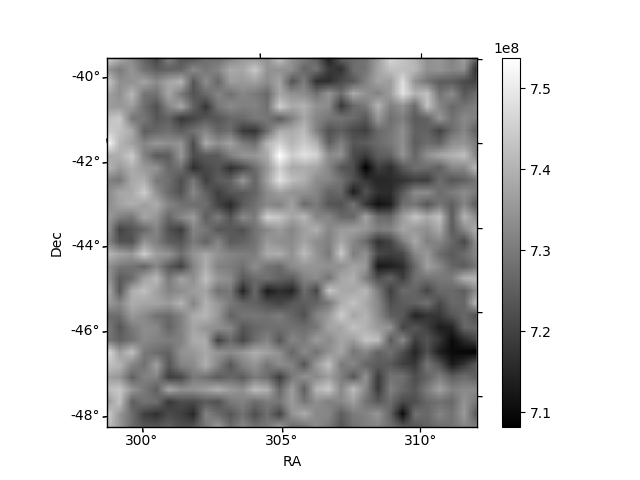
Quadrant B |
|---|---|---|---|
| Quadrant D | 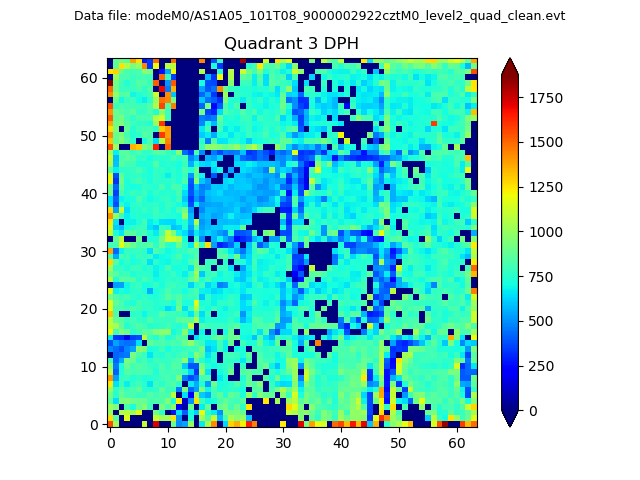 |
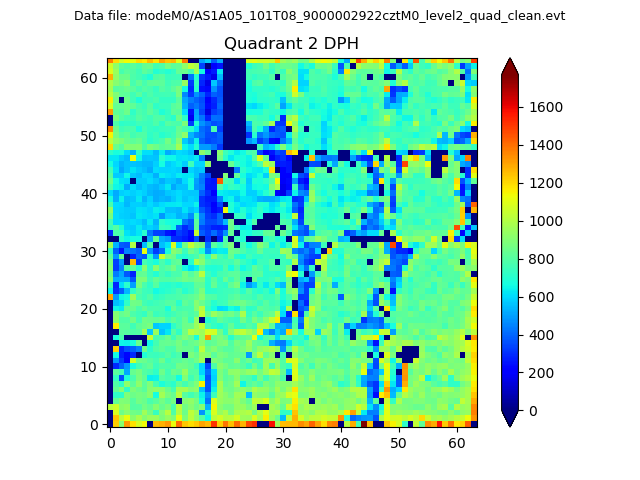 |
Quadrant C |
| Plot type | Count rate plots | Images |
|---|---|---|
| Comparison with Poisson distribution Blue bars denote a histogram of data divided into 1 sec bins. Red curve is a Poisson curve with rate = median count rate of data. |
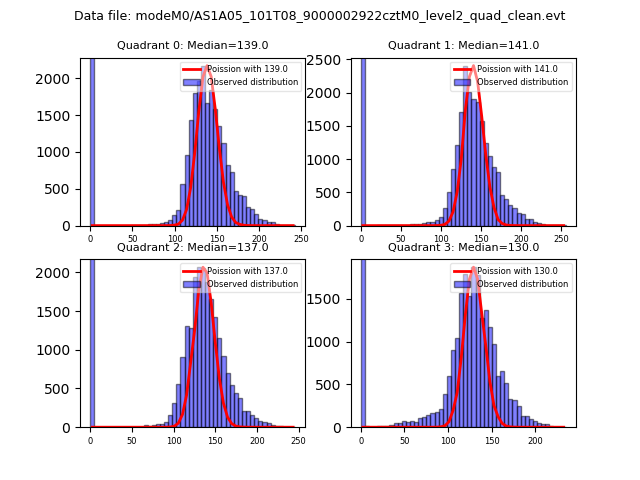 |
 |
| Quadrant-wise count rates Data is divided into 100 sec bins |
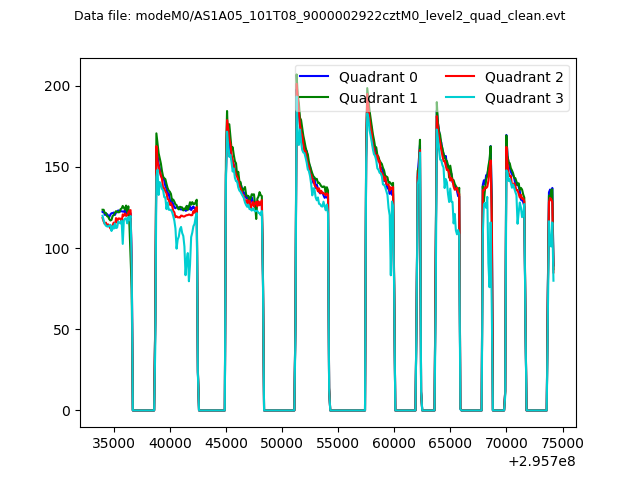 |
|
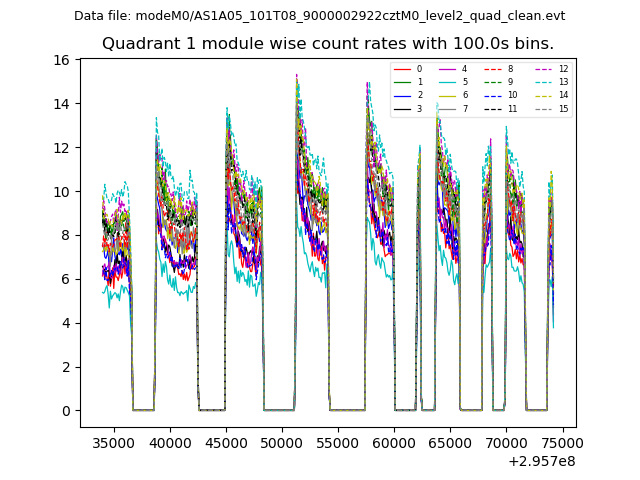
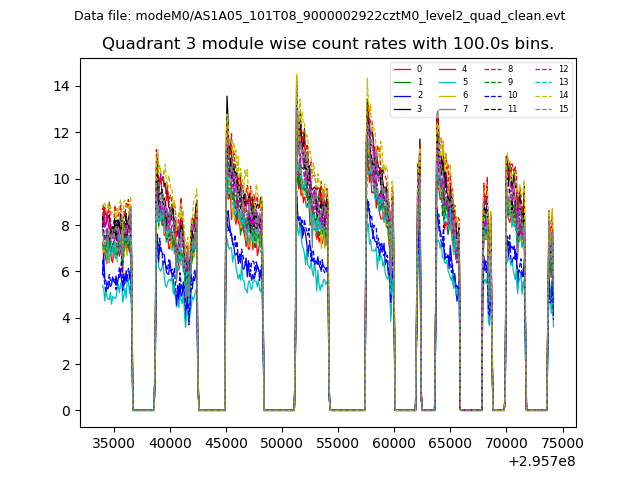
| Module-wise count rates for Quadrant A Data is divided into 100 sec bins |
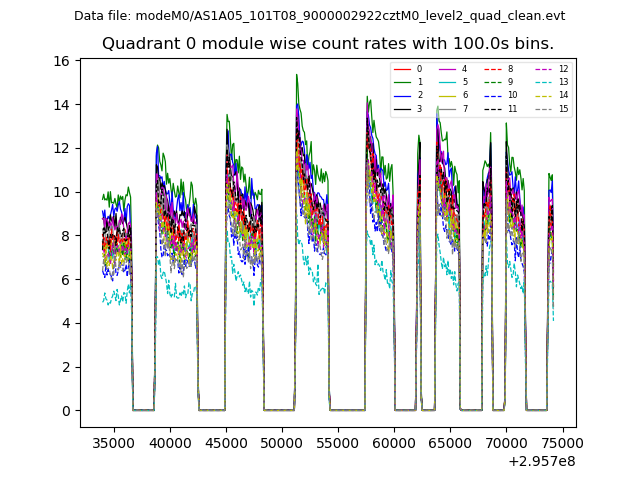 |
 |
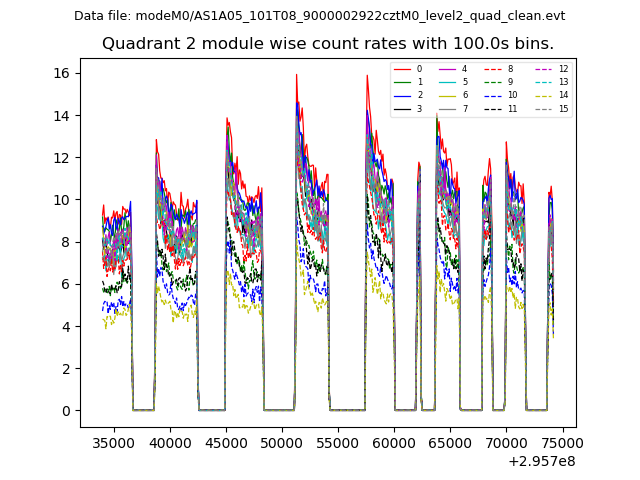
| Module-wise count rates for Quadrant B Data is divided into 100 sec bins |
 |
 |
| Module-wise count rates for Quadrant C Data is divided into 100 sec bins |
 |
 |
| Module-wise count rates for Quadrant D Data is divided into 100 sec bins |
 |
 |
| Parameter | Plot |
|---|---|
| CZT HV Monitor | 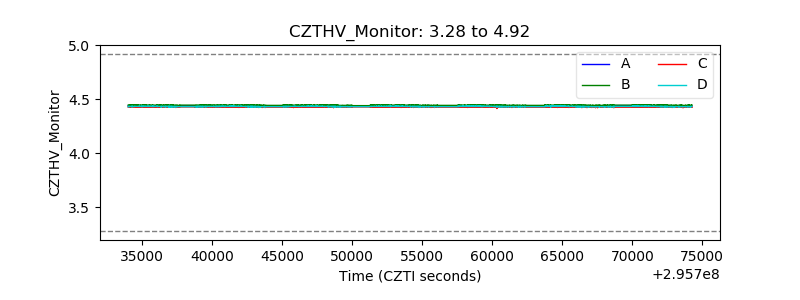 |
| D_VDD | 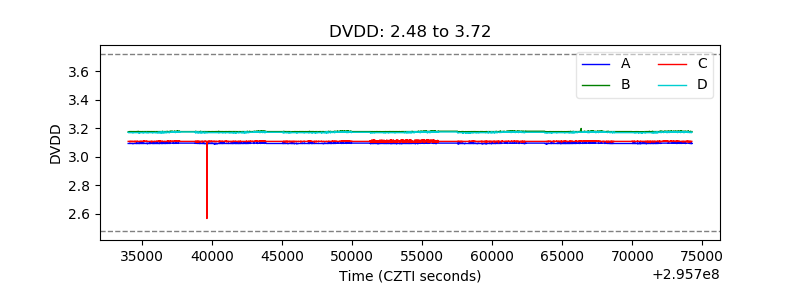 |
| Temperature 1 | 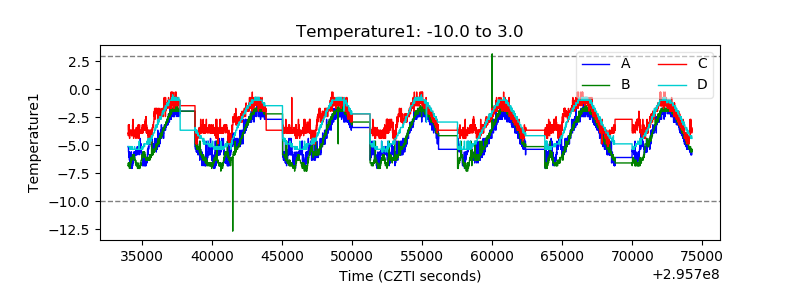 |
| Veto HV Monitor | 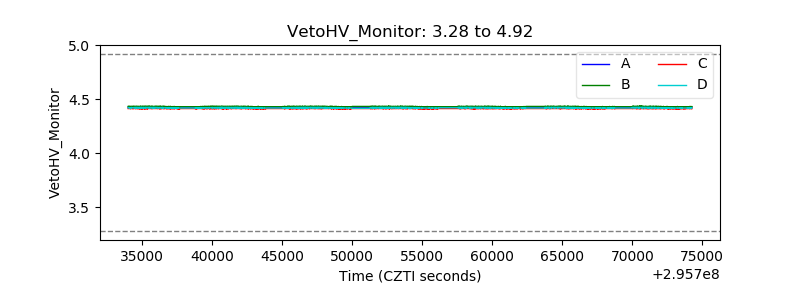 |
| Veto LLD | 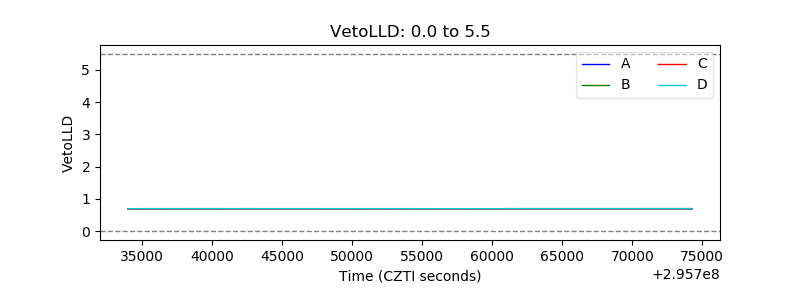 |
| Alpha Counter | 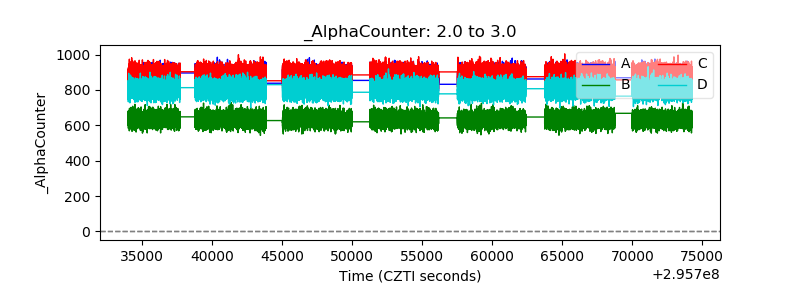 |
| _CPM_Rate | 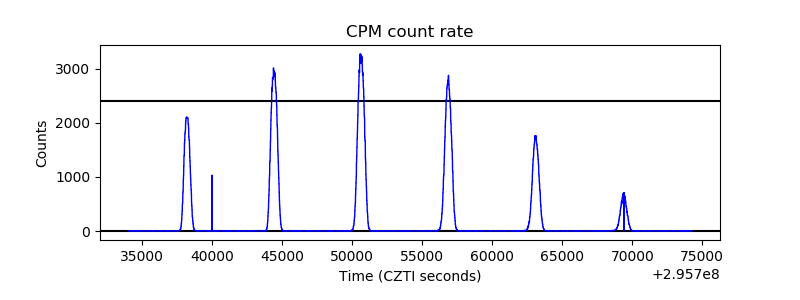 |
| CZT Counter | 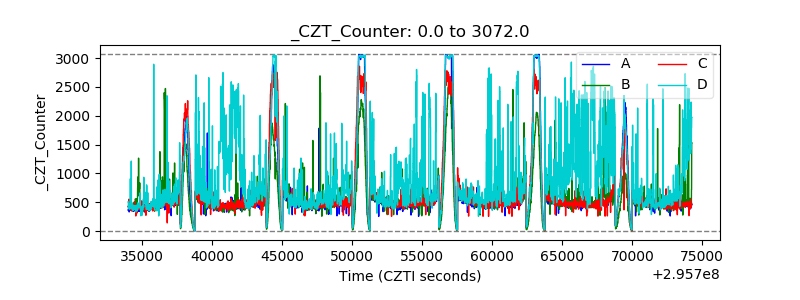 |
| +2.5 Volts monitor | 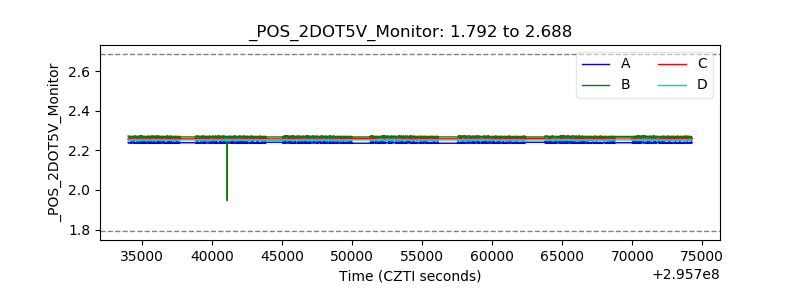 |
| +5 Volts monitor | 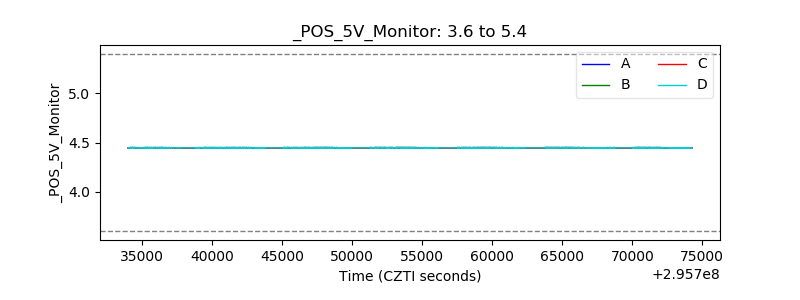 |
| _ROLL_ROT | 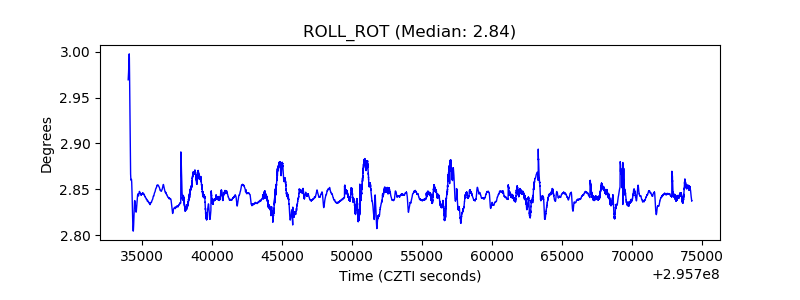 |
| _Roll_DEC | 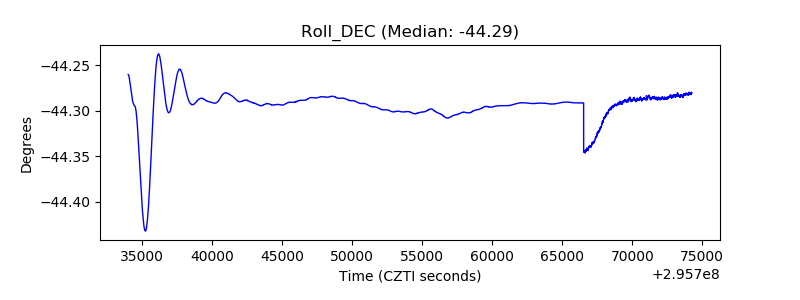 |
| _Roll_RA | 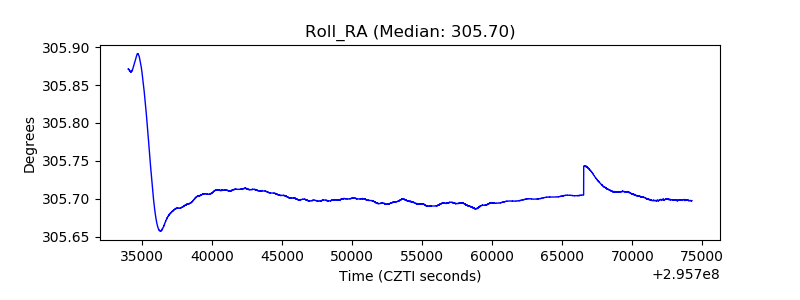 |
| Veto Counter | 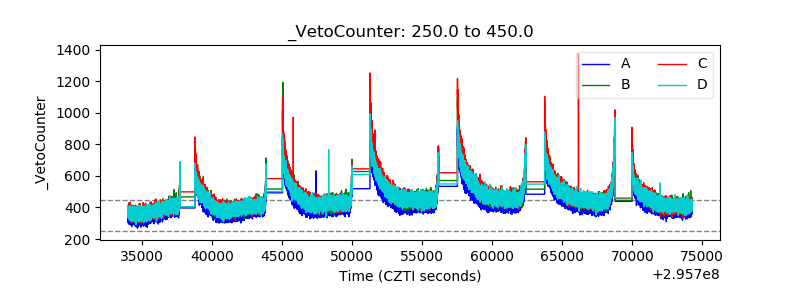 |