| Param | Original file | Final file |
|---|---|---|
| Filename | modeM0/AS1A05_101T08_9000002922_19637cztM0_level2.evt | modeM0/AS1A05_101T08_9000002922_19637cztM0_level2_quad_clean.evt |
| Size (bytes) | 368,501,760 | 79,436,160 |
| Size | 351.4 MB | 75.8 MB |
| Events in quadrant A | 2,367,910 | 522,857 |
| Events in quadrant B | 2,833,219 | 525,584 |
| Events in quadrant C | 2,414,528 | 508,474 |
| Events in quadrant D | 3,197,654 | 491,595 |
| Mode M9 | |||
|---|---|---|---|
| Quadrant | BADHDUFLAG | Total packets | Discarded packets |
| A | 0 | 10 | 0 |
| B | 0 | 10 | 0 |
| C | 0 | 10 | 0 |
| D | 0 | 10 | 0 |
| Mode M0 | |||
|---|---|---|---|
| Quadrant | BADHDUFLAG | Total packets | Discarded packets |
| A | 0 | 10486 | 1 |
| B | 0 | 11807 | 1 |
| C | 0 | 10420 | 1 |
| D | 0 | 12979 | 1 |
| Mode SS | |||
|---|---|---|---|
| Quadrant | BADHDUFLAG | Total packets | Discarded packets |
| A | 0 | 106 | 0 |
| B | 0 | 106 | 0 |
| C | 0 | 106 | 0 |
| D | 0 | 106 | 0 |
| Quadrant | Total seconds | Saturated seconds | Saturation percentage |
|---|---|---|---|
| A | 5085 | 32 | 0.629302% |
| B | 5085 | 134 | 2.635202% |
| C | 5085 | 38 | 0.747296% |
| D | 5085 | 131 | 2.576205% |
Noise dominated data is calculated using 1-second bins in cleaned event files. If a bin has >2000 counts, and if more than 50% of those come from <1% of pixels, then it is considered to be noise-dominated and hence unusable.
| Quadrant | # 1 sec bins | Bins with >0 counts | Bins with >2000 counts | High rate bins dominated by noise | Noise dominated (total time) | Noise dominated (detector-on time) | Marked lightcurve |
|---|---|---|---|---|---|---|---|
| A | 6145 | 5086 | 7 | 7 | 0.11% | 0.14% | 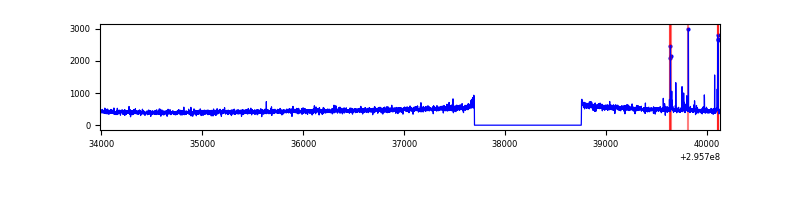 |
| B | 6145 | 5086 | 101 | 101 | 1.64% | 1.99% | 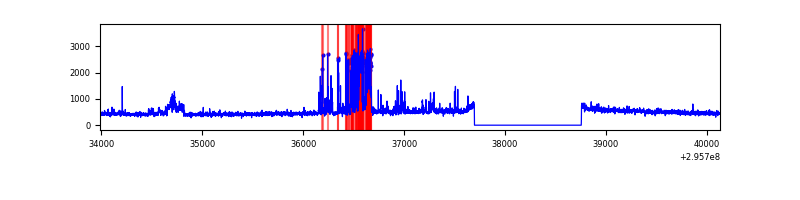 |
| C | 6145 | 5086 | 0 | 0 | 0.00% | 0.00% | 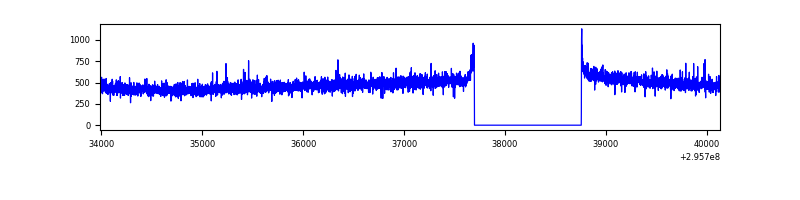 |
| D | 6145 | 5086 | 100 | 100 | 1.63% | 1.97% | 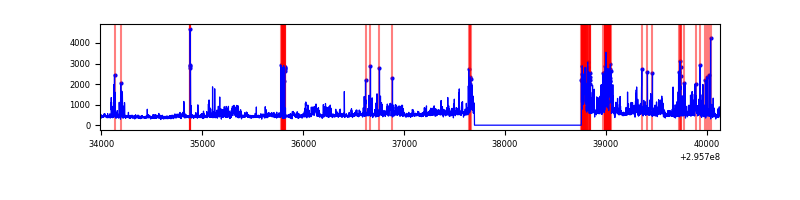 |
Top three noisy pixels from each quadrant. If the there are fewer than three noisy pixels in the level2.evt file, extra rows are filled as -1
| Pixel properties | Quadrant properties | ||||||
|---|---|---|---|---|---|---|---|
| Quadrant | DetID | PixID | Counts | Sigma | Mean | Median | Sigma |
| A | 5 | 16 | 38097 | 305.38 | 605 | 590 | 122.8 |
| A | 13 | 254 | 5384 | 39.03 | 605 | 590 | 122.8 |
| A | 0 | 226 | 5032 | 36.17 | 605 | 590 | 122.8 |
| B | 3 | 112 | 458142 | 4036.39 | 599 | 585 | 113.4 |
| B | 12 | 111 | 13904 | 117.49 | 599 | 585 | 113.4 |
| B | 11 | 111 | 11867 | 99.53 | 599 | 585 | 113.4 |
| C | 14 | 238 | 91438 | 663.52 | 587 | 592 | 136.9 |
| C | 3 | 233 | 19917 | 141.15 | 587 | 592 | 136.9 |
| C | 8 | 208 | 8211 | 55.65 | 587 | 592 | 136.9 |
| D | 1 | 52 | 378664 | 2686.06 | 587 | 571 | 140.8 |
| D | 12 | 218 | 342044 | 2425.9 | 587 | 571 | 140.8 |
| D | 7 | 238 | 160525 | 1136.35 | 587 | 571 | 140.8 |
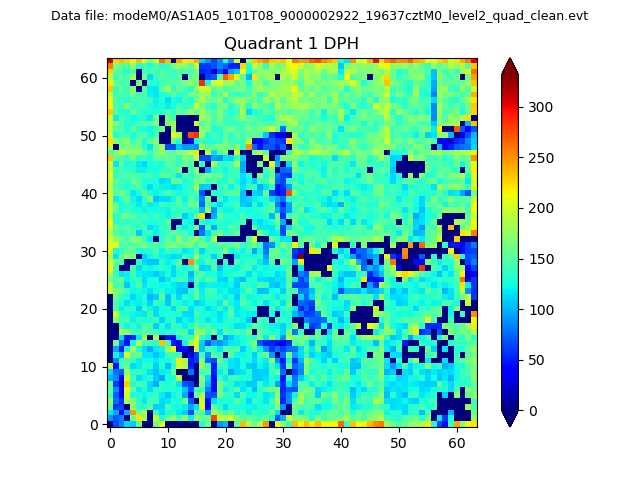
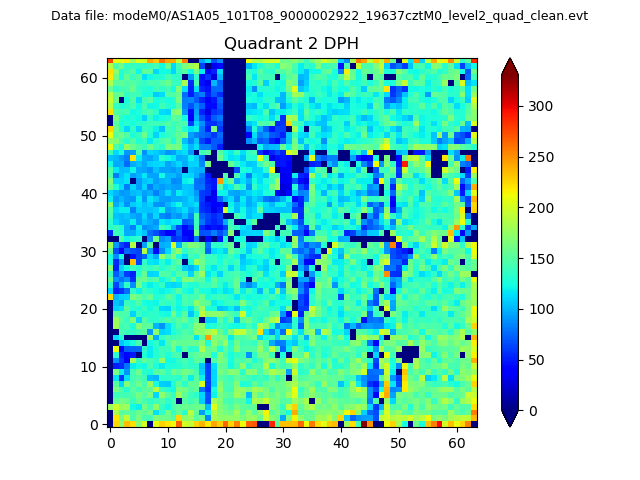
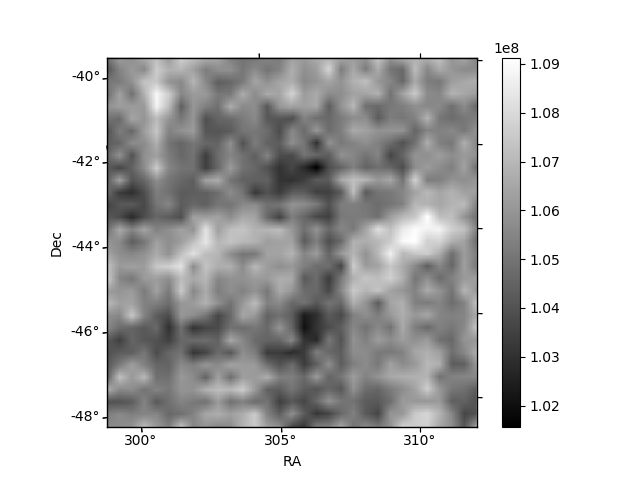
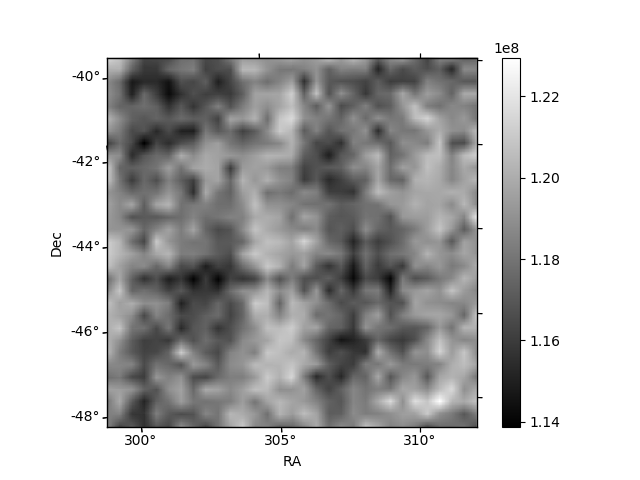
Histogram calculated using DETX and DETY for each event in the final _common_clean file
| Quadrant A |  |
 |
Quadrant B |
|---|---|---|---|
| Quadrant D |  |
 |
Quadrant C |
| Plot type | Count rate plots | Images |
|---|---|---|
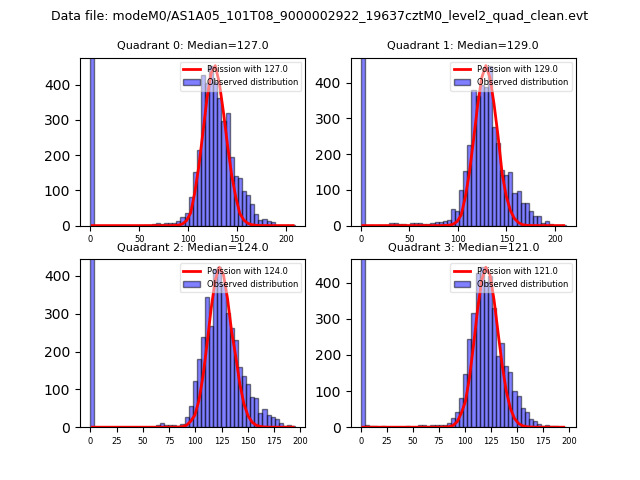
| Comparison with Poisson distribution Blue bars denote a histogram of data divided into 1 sec bins. Red curve is a Poisson curve with rate = median count rate of data. |
 |
 |
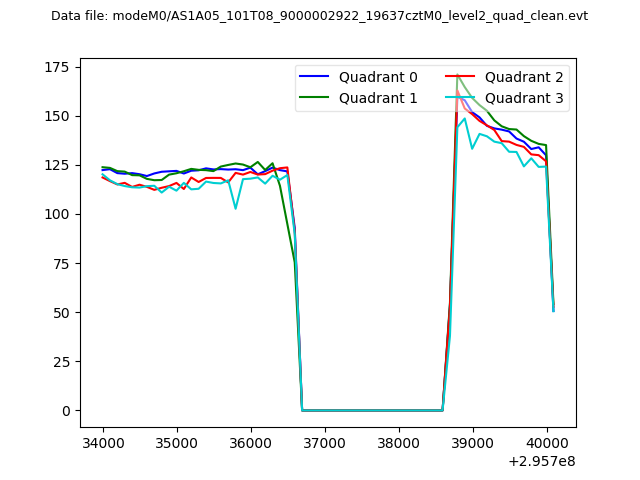
| Quadrant-wise count rates Data is divided into 100 sec bins |
 |
|
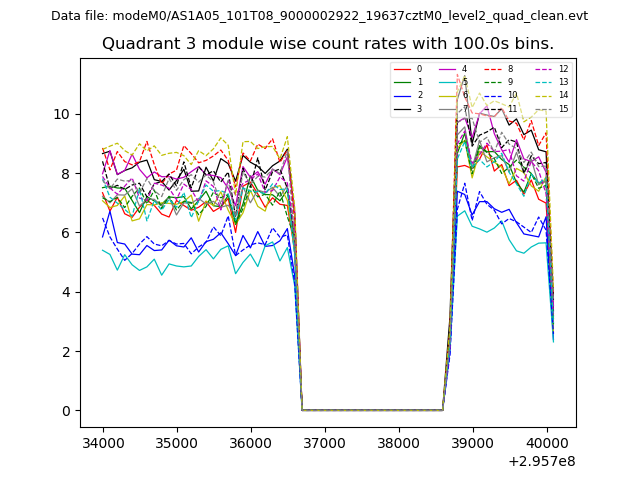
| Module-wise count rates for Quadrant A Data is divided into 100 sec bins |
 |
 |
| Module-wise count rates for Quadrant B Data is divided into 100 sec bins |
 |
 |
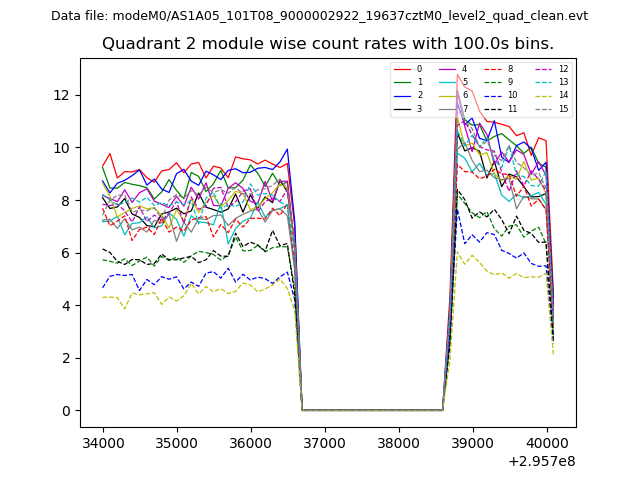
| Module-wise count rates for Quadrant C Data is divided into 100 sec bins |
 |
 |
| Module-wise count rates for Quadrant D Data is divided into 100 sec bins |
 |
 |
| Parameter | Plot |
|---|---|
| CZT HV Monitor |  |
| D_VDD | 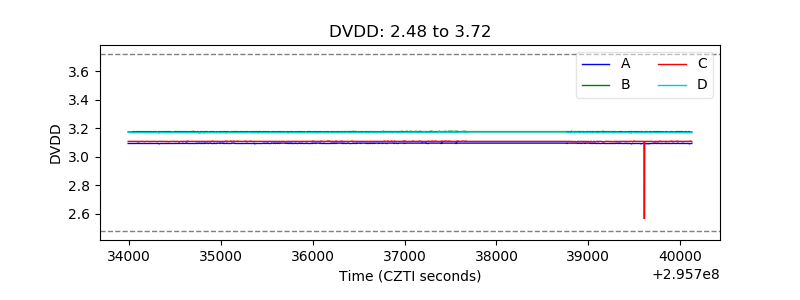 |
| Temperature 1 | 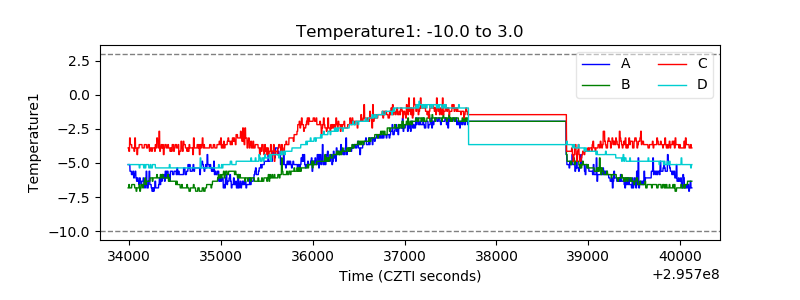 |
| Veto HV Monitor | 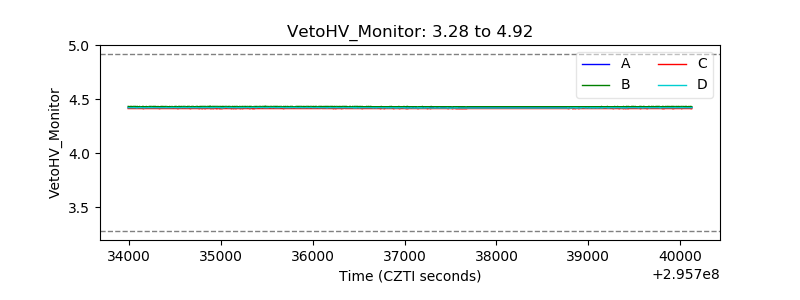 |
| Veto LLD | 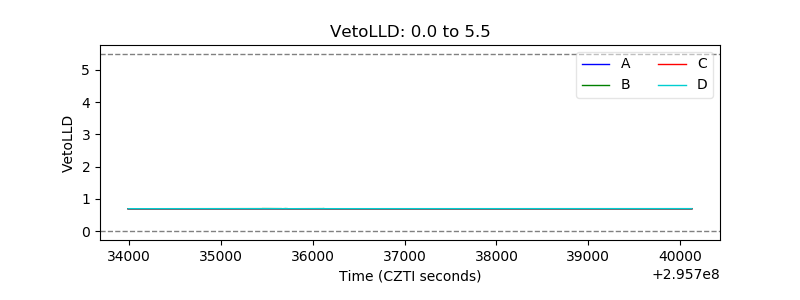 |
| Alpha Counter | 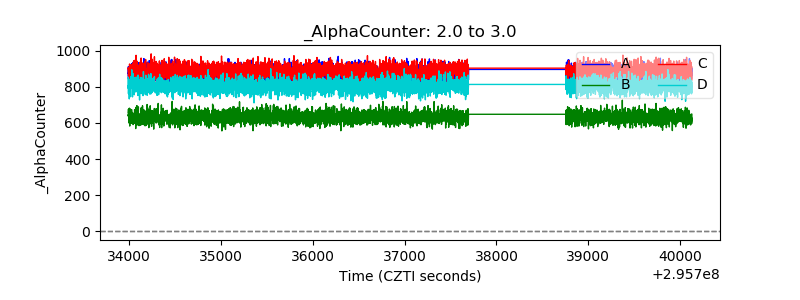 |
| _CPM_Rate | 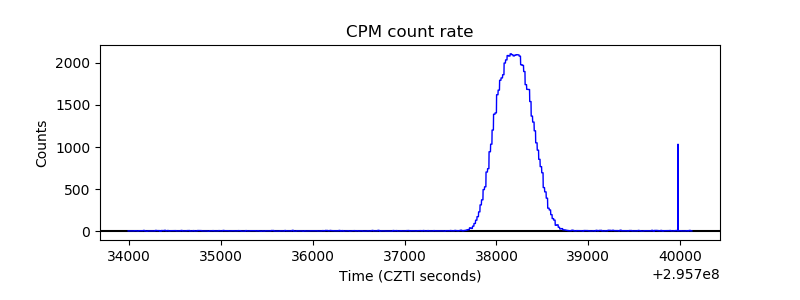 |
| CZT Counter | 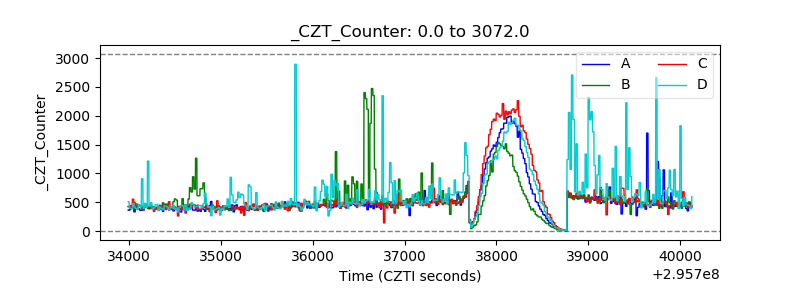 |
| +2.5 Volts monitor |  |
| +5 Volts monitor |  |
| _ROLL_ROT | 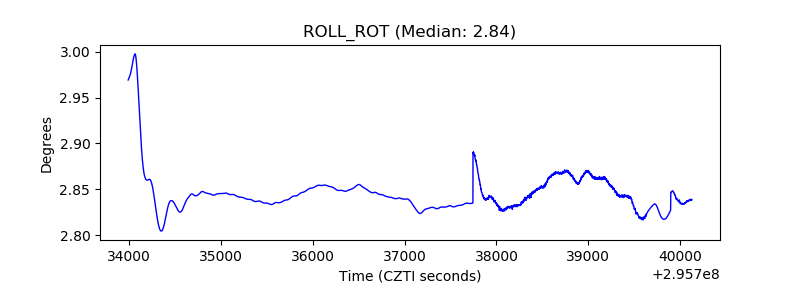 |
| _Roll_DEC | 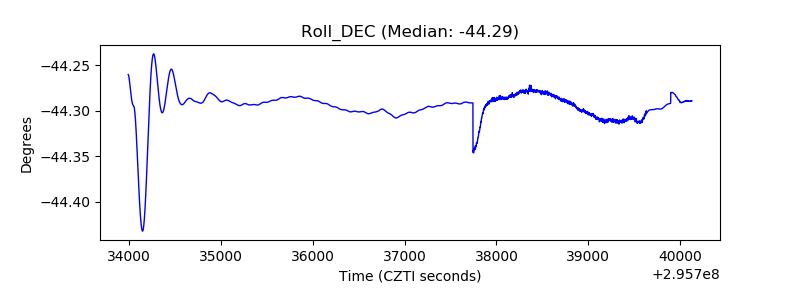 |
| _Roll_RA | 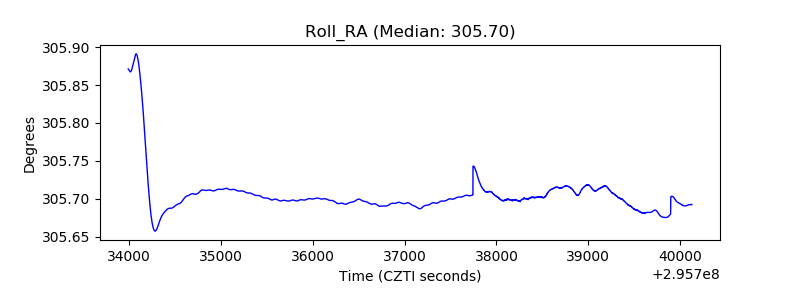 |
| Veto Counter | 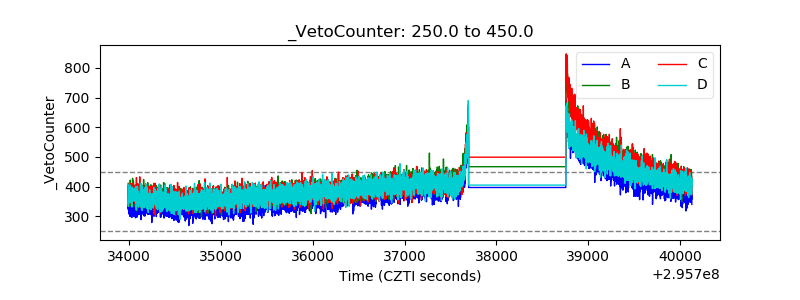 |