| Param | Original file | Final file |
|---|---|---|
| Filename | modeM0/AS1A05_101T08_9000002922_19639cztM0_level2.evt | modeM0/AS1A05_101T08_9000002922_19639cztM0_level2_quad_clean.evt |
| Size (bytes) | 566,176,320 | 104,356,800 |
| Size | 539.9 MB | 99.5 MB |
| Events in quadrant A | 3,275,146 | 686,482 |
| Events in quadrant B | 3,540,931 | 705,254 |
| Events in quadrant C | 3,335,898 | 676,855 |
| Events in quadrant D | 6,542,382 | 626,226 |
| Mode M9 | |||
|---|---|---|---|
| Quadrant | BADHDUFLAG | Total packets | Discarded packets |
| A | 0 | 22 | 0 |
| B | 0 | 22 | 0 |
| C | 0 | 22 | 0 |
| D | 0 | 22 | 0 |
| Mode M0 | |||
|---|---|---|---|
| Quadrant | BADHDUFLAG | Total packets | Discarded packets |
| A | 0 | 14019 | 2 |
| B | 0 | 14834 | 2 |
| C | 0 | 13998 | 2 |
| D | 0 | 24000 | 2 |
| Mode SS | |||
|---|---|---|---|
| Quadrant | BADHDUFLAG | Total packets | Discarded packets |
| A | 0 | 138 | 0 |
| B | 0 | 138 | 0 |
| C | 0 | 138 | 0 |
| D | 0 | 138 | 0 |
| Quadrant | Total seconds | Saturated seconds | Saturation percentage |
|---|---|---|---|
| A | 6675 | 49 | 0.734082% |
| B | 6675 | 78 | 1.168539% |
| C | 6676 | 72 | 1.078490% |
| D | 6676 | 726 | 10.874775% |
Noise dominated data is calculated using 1-second bins in cleaned event files. If a bin has >2000 counts, and if more than 50% of those come from <1% of pixels, then it is considered to be noise-dominated and hence unusable.
| Quadrant | # 1 sec bins | Bins with >0 counts | Bins with >2000 counts | High rate bins dominated by noise | Noise dominated (total time) | Noise dominated (detector-on time) | Marked lightcurve |
|---|---|---|---|---|---|---|---|
| A | 8905 | 6677 | 9 | 9 | 0.10% | 0.13% | 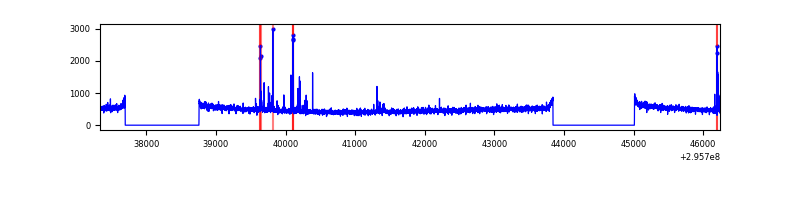 |
| B | 8905 | 6677 | 24 | 24 | 0.27% | 0.36% | 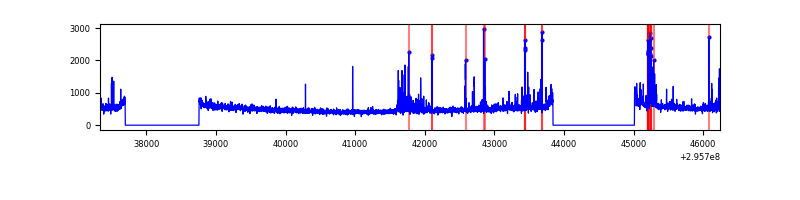 |
| C | 8906 | 6678 | 0 | 0 | 0.00% | 0.00% | 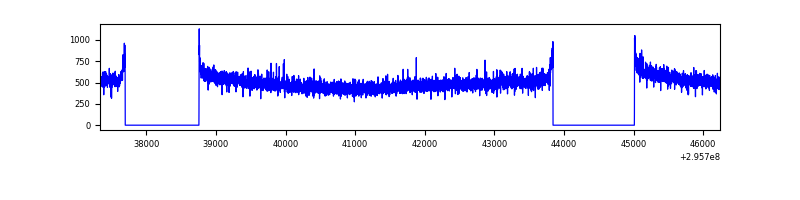 |
| D | 8906 | 6678 | 663 | 663 | 7.44% | 9.93% | 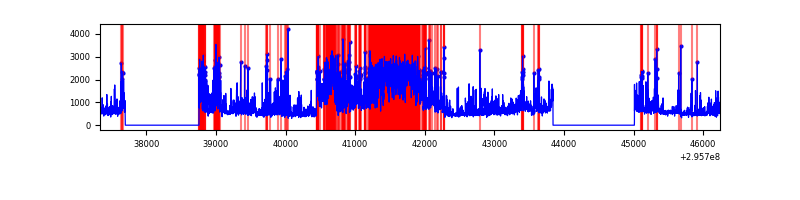 |
Top three noisy pixels from each quadrant. If the there are fewer than three noisy pixels in the level2.evt file, extra rows are filled as -1
| Pixel properties | Quadrant properties | ||||||
|---|---|---|---|---|---|---|---|
| Quadrant | DetID | PixID | Counts | Sigma | Mean | Median | Sigma |
| A | 5 | 16 | 76028 | 448.79 | 831 | 815 | 167.6 |
| A | 13 | 254 | 7098 | 37.49 | 831 | 815 | 167.6 |
| A | 0 | 226 | 6981 | 36.79 | 831 | 815 | 167.6 |
| B | 3 | 112 | 248695 | 1581.38 | 831 | 809 | 156.8 |
| B | 12 | 111 | 18818 | 114.89 | 831 | 809 | 156.8 |
| B | 11 | 111 | 15997 | 96.89 | 831 | 809 | 156.8 |
| C | 14 | 238 | 126346 | 661.09 | 811 | 819 | 189.9 |
| C | 3 | 233 | 40293 | 207.89 | 811 | 819 | 189.9 |
| C | 13 | 61 | 5651 | 25.45 | 811 | 819 | 189.9 |
| D | 7 | 238 | 2299134 | 12060.38 | 791 | 770 | 190.6 |
| D | 1 | 52 | 537105 | 2814.35 | 791 | 770 | 190.6 |
| D | 12 | 218 | 499411 | 2616.56 | 791 | 770 | 190.6 |
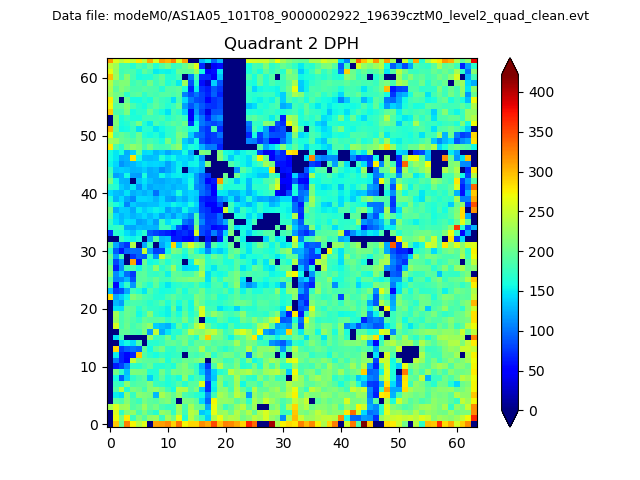
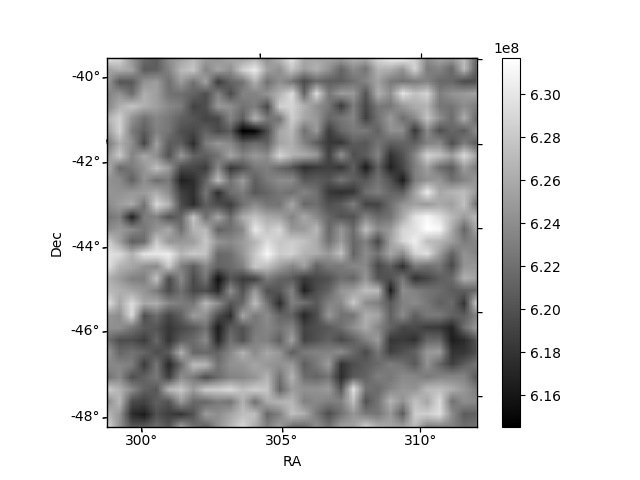
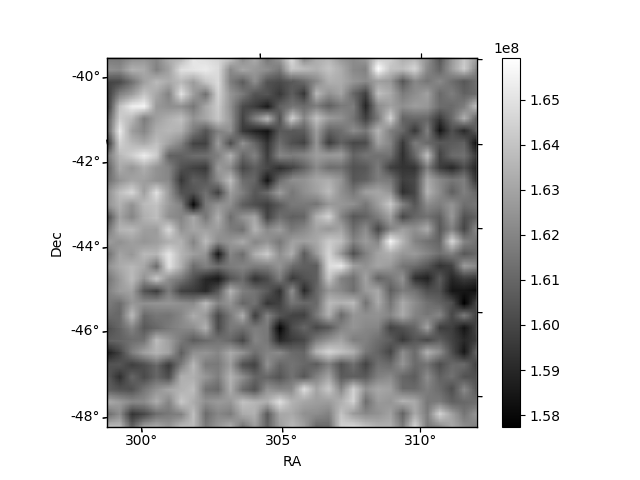
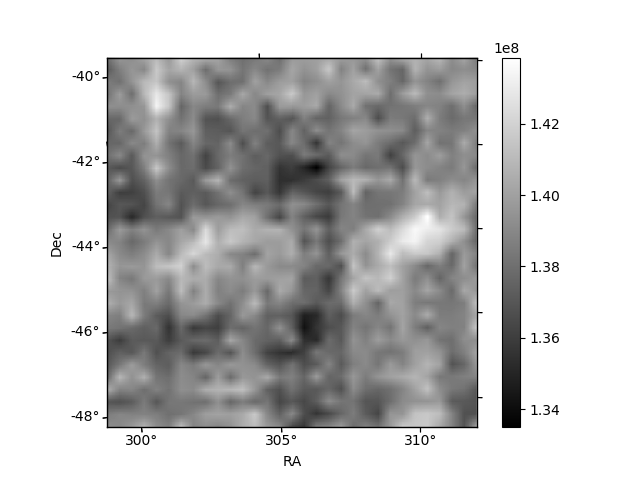
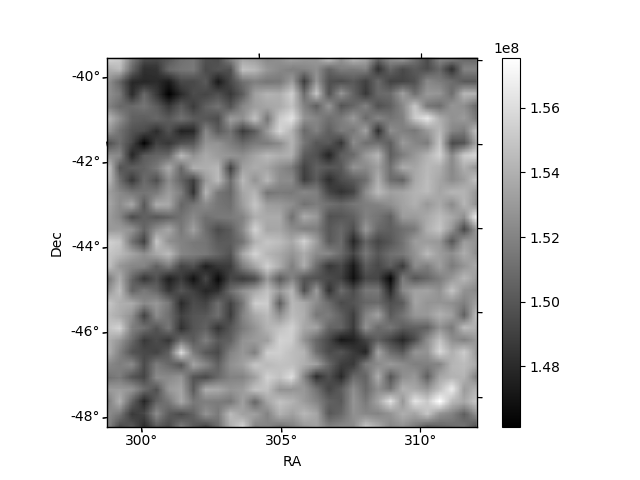
Histogram calculated using DETX and DETY for each event in the final _common_clean file
| Quadrant A | 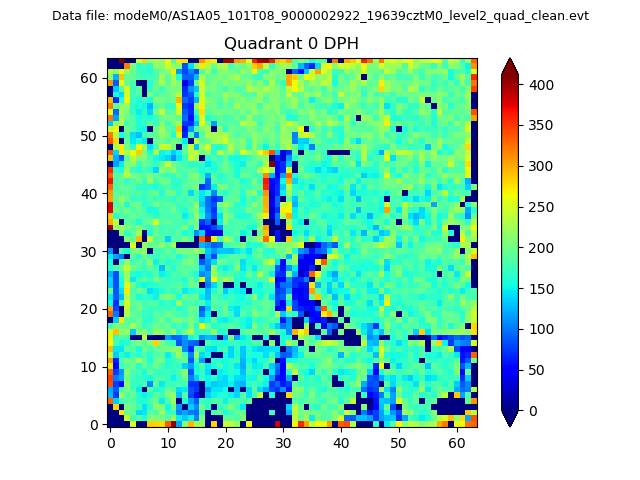 |
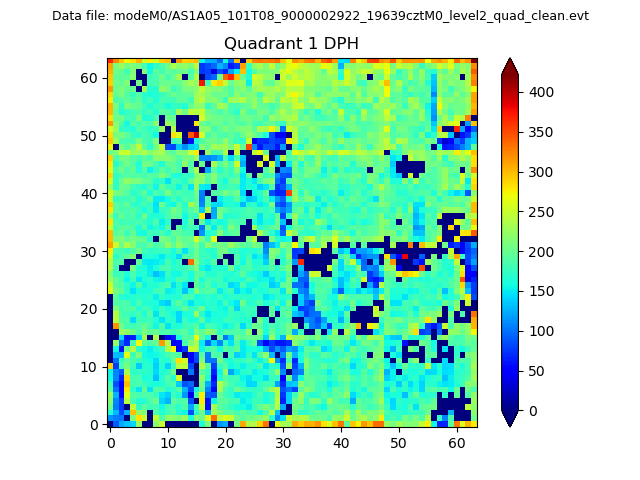 |
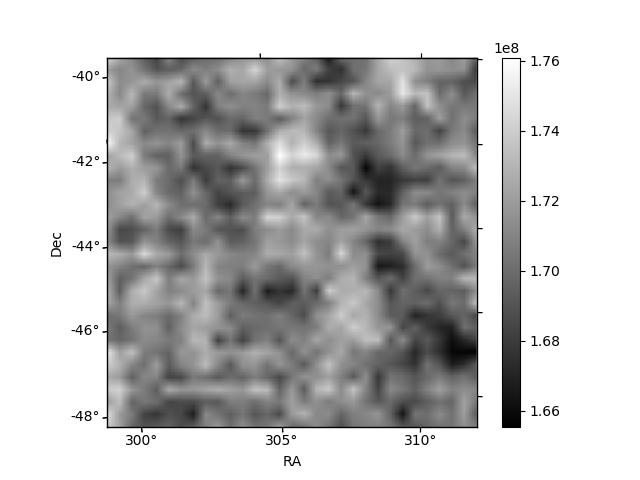
Quadrant B |
|---|---|---|---|
| Quadrant D | 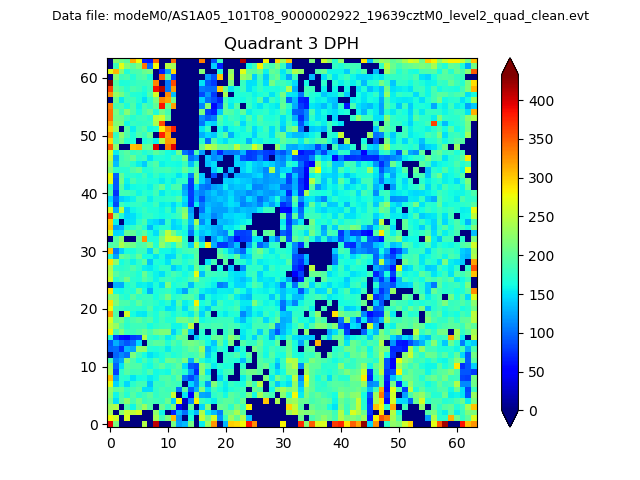 |
 |
Quadrant C |
| Plot type | Count rate plots | Images |
|---|---|---|
| Comparison with Poisson distribution Blue bars denote a histogram of data divided into 1 sec bins. Red curve is a Poisson curve with rate = median count rate of data. |
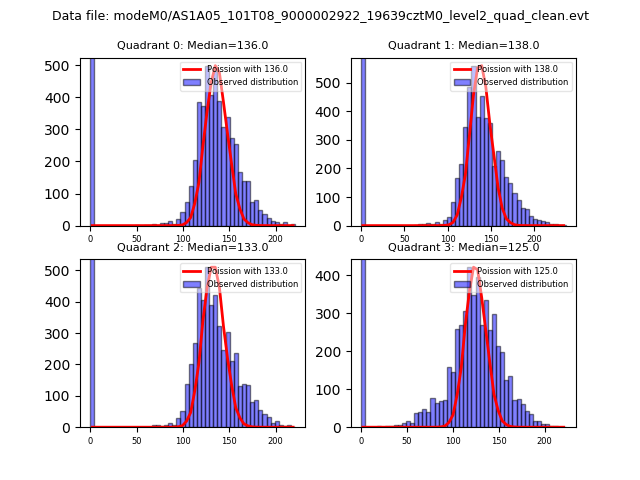 |
 |
| Quadrant-wise count rates Data is divided into 100 sec bins |
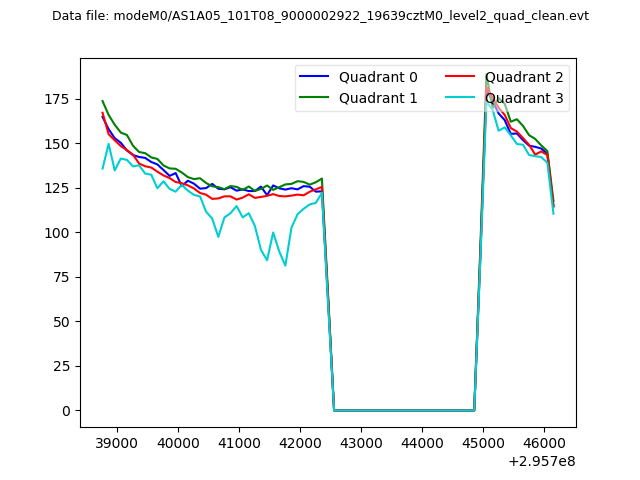 |
|
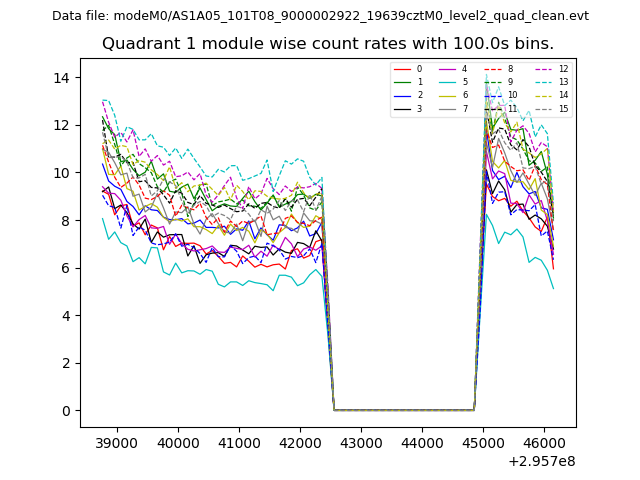
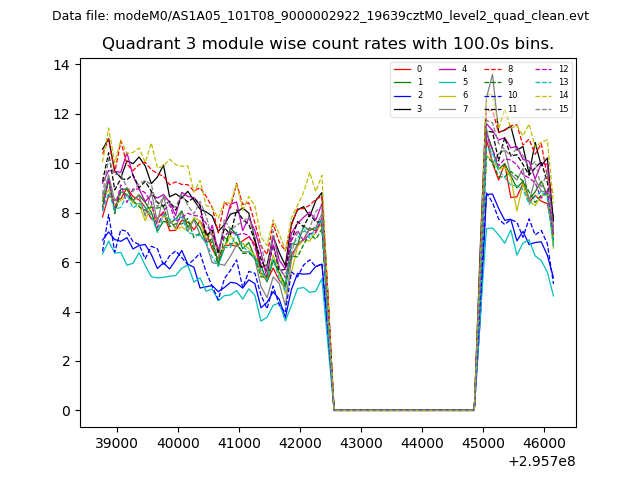
| Module-wise count rates for Quadrant A Data is divided into 100 sec bins |
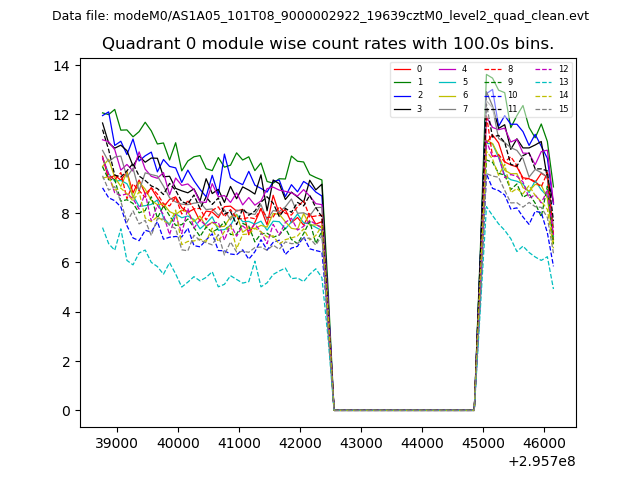 |
 |
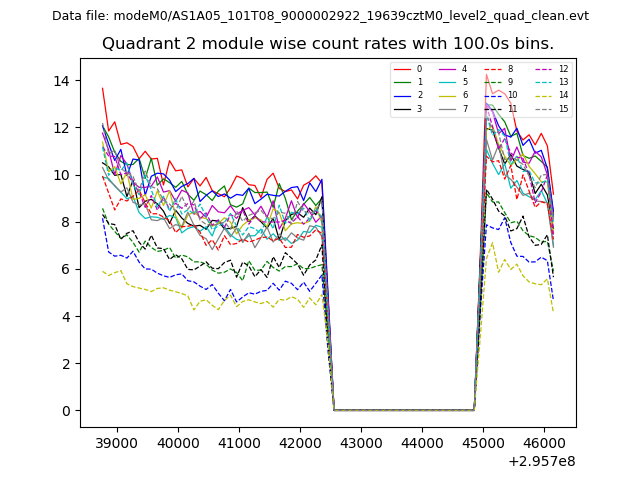
| Module-wise count rates for Quadrant B Data is divided into 100 sec bins |
 |
 |
| Module-wise count rates for Quadrant C Data is divided into 100 sec bins |
 |
 |
| Module-wise count rates for Quadrant D Data is divided into 100 sec bins |
 |
 |
| Parameter | Plot |
|---|---|
| CZT HV Monitor |  |
| D_VDD | 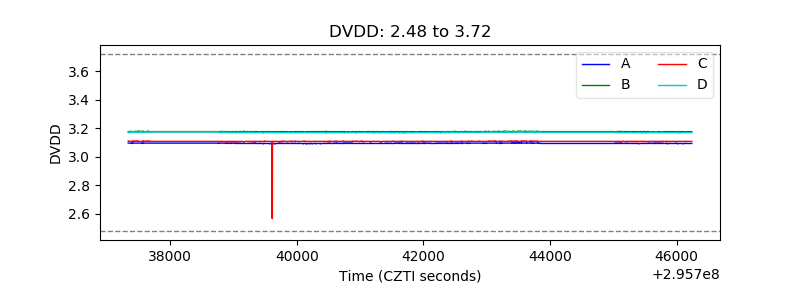 |
| Temperature 1 | 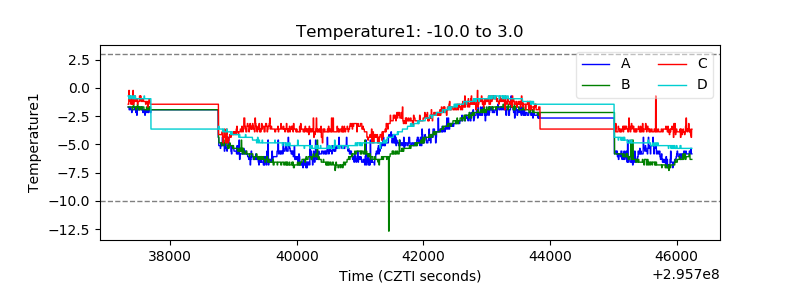 |
| Veto HV Monitor | 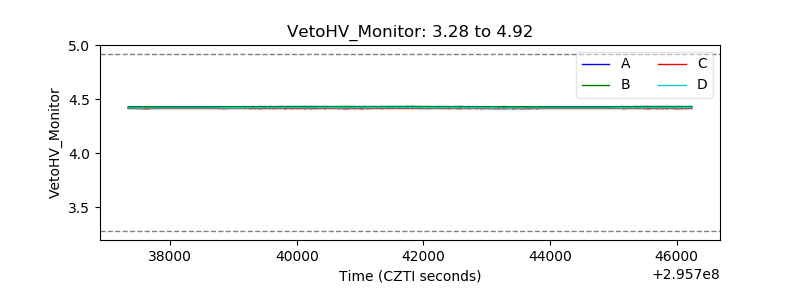 |
| Veto LLD | 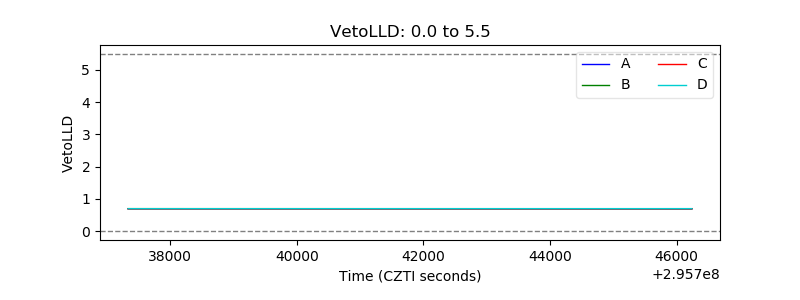 |
| Alpha Counter | 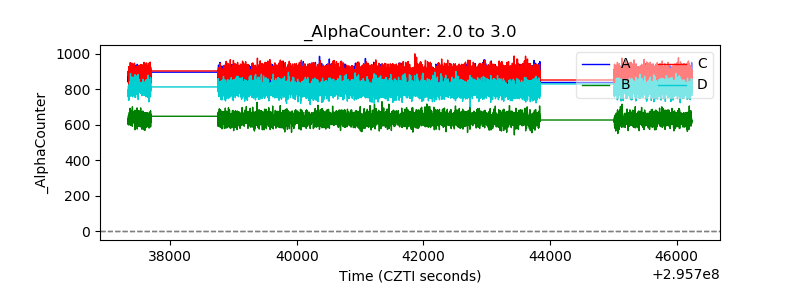 |
| _CPM_Rate | 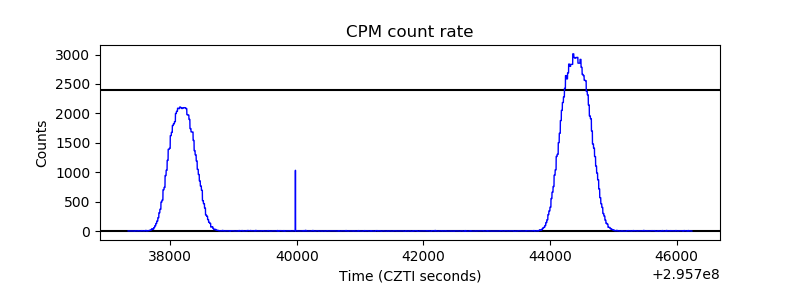 |
| CZT Counter | 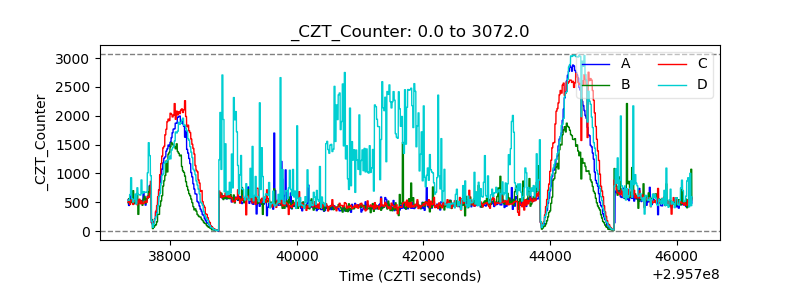 |
| +2.5 Volts monitor |  |
| +5 Volts monitor |  |
| _ROLL_ROT | 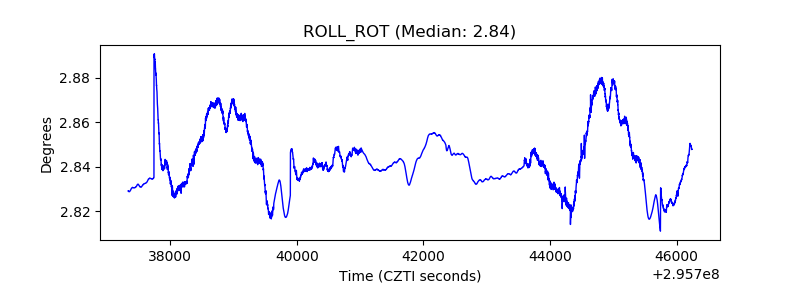 |
| _Roll_DEC | 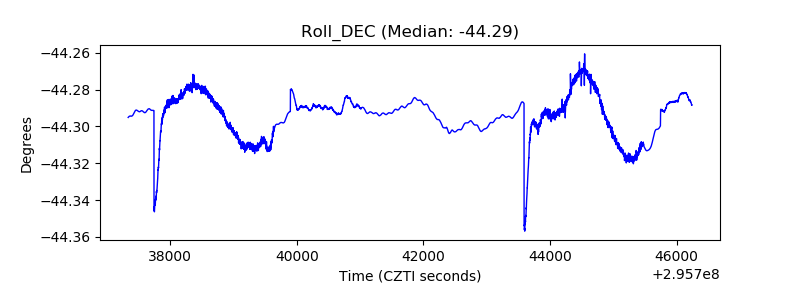 |
| _Roll_RA | 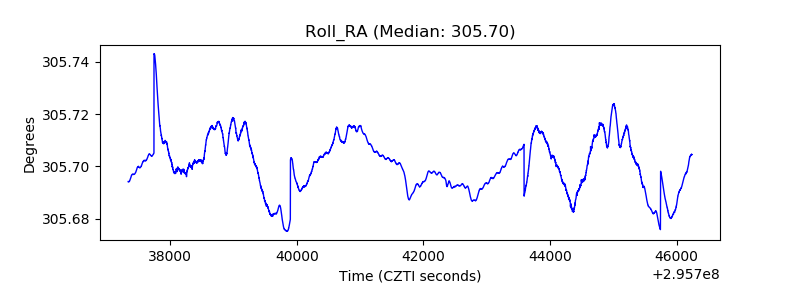 |
| Veto Counter | 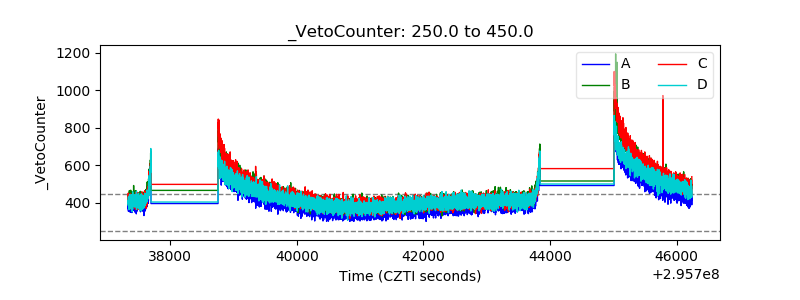 |