| Param | Original file | Final file |
|---|---|---|
| Filename | modeM0/AS1A05_101T08_9000002922_19640cztM0_level2.evt | modeM0/AS1A05_101T08_9000002922_19640cztM0_level2_quad_clean.evt |
| Size (bytes) | 478,388,160 | 105,808,320 |
| Size | 456.2 MB | 100.9 MB |
| Events in quadrant A | 3,133,849 | 694,653 |
| Events in quadrant B | 3,547,689 | 710,844 |
| Events in quadrant C | 3,243,481 | 691,379 |
| Events in quadrant D | 4,135,782 | 668,171 |
| Mode M9 | |||
|---|---|---|---|
| Quadrant | BADHDUFLAG | Total packets | Discarded packets |
| A | 0 | 19 | 0 |
| B | 0 | 20 | 0 |
| C | 0 | 20 | 0 |
| D | 0 | 20 | 0 |
| Mode M0 | |||
|---|---|---|---|
| Quadrant | BADHDUFLAG | Total packets | Discarded packets |
| A | 0 | 13276 | 2 |
| B | 0 | 14489 | 2 |
| C | 0 | 13491 | 2 |
| D | 0 | 16529 | 2 |
| Mode SS | |||
|---|---|---|---|
| Quadrant | BADHDUFLAG | Total packets | Discarded packets |
| A | 0 | 128 | 0 |
| B | 0 | 128 | 0 |
| C | 0 | 128 | 0 |
| D | 0 | 126 | 0 |
| Quadrant | Total seconds | Saturated seconds | Saturation percentage |
|---|---|---|---|
| A | 6298 | 18 | 0.285805% |
| B | 6298 | 86 | 1.365513% |
| C | 6298 | 58 | 0.920927% |
| D | 6298 | 109 | 1.730708% |
Noise dominated data is calculated using 1-second bins in cleaned event files. If a bin has >2000 counts, and if more than 50% of those come from <1% of pixels, then it is considered to be noise-dominated and hence unusable.
| Quadrant | # 1 sec bins | Bins with >0 counts | Bins with >2000 counts | High rate bins dominated by noise | Noise dominated (total time) | Noise dominated (detector-on time) | Marked lightcurve |
|---|---|---|---|---|---|---|---|
| A | 7578 | 6299 | 7 | 7 | 0.09% | 0.11% | 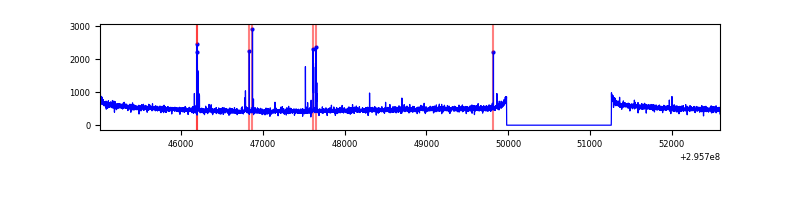 |
| B | 7578 | 6299 | 53 | 53 | 0.70% | 0.84% | 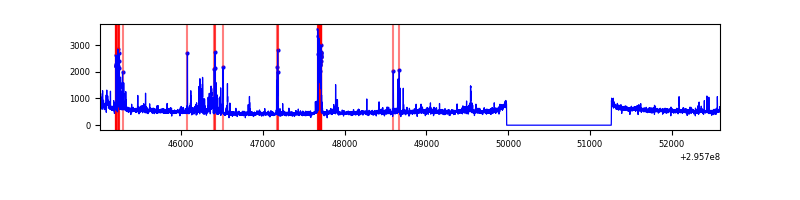 |
| C | 7578 | 6299 | 0 | 0 | 0.00% | 0.00% | 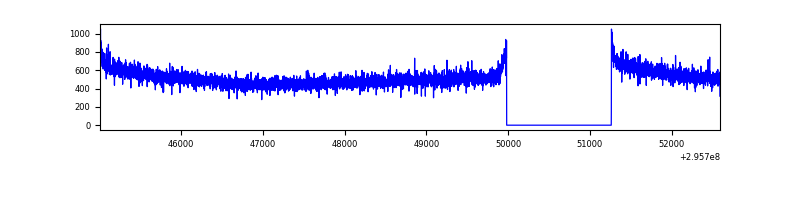 |
| D | 7578 | 6299 | 56 | 56 | 0.74% | 0.89% | 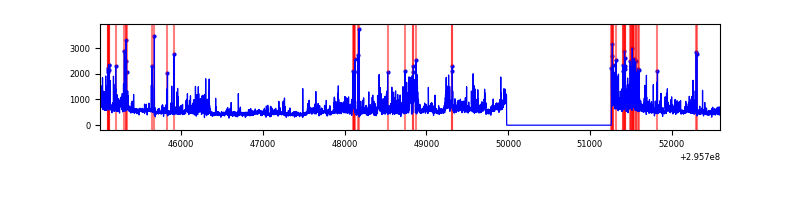 |
Top three noisy pixels from each quadrant. If the there are fewer than three noisy pixels in the level2.evt file, extra rows are filled as -1
| Pixel properties | Quadrant properties | ||||||
|---|---|---|---|---|---|---|---|
| Quadrant | DetID | PixID | Counts | Sigma | Mean | Median | Sigma |
| A | 5 | 16 | 57030 | 350.24 | 799 | 782 | 160.6 |
| A | 0 | 226 | 6812 | 37.55 | 799 | 782 | 160.6 |
| A | 13 | 254 | 6073 | 32.95 | 799 | 782 | 160.6 |
| B | 3 | 112 | 367450 | 2458.41 | 804 | 784 | 149.1 |
| B | 12 | 111 | 17627 | 112.93 | 804 | 784 | 149.1 |
| B | 4 | 216 | 16209 | 103.42 | 804 | 784 | 149.1 |
| C | 14 | 238 | 123853 | 668.1 | 793 | 801 | 184.2 |
| C | 3 | 233 | 17212 | 89.1 | 793 | 801 | 184.2 |
| C | 13 | 61 | 5499 | 25.51 | 793 | 801 | 184.2 |
| D | 1 | 52 | 693605 | 3620.56 | 792 | 773 | 191.4 |
| D | 7 | 238 | 317787 | 1656.63 | 792 | 773 | 191.4 |
| D | 12 | 218 | 113464 | 588.89 | 792 | 773 | 191.4 |
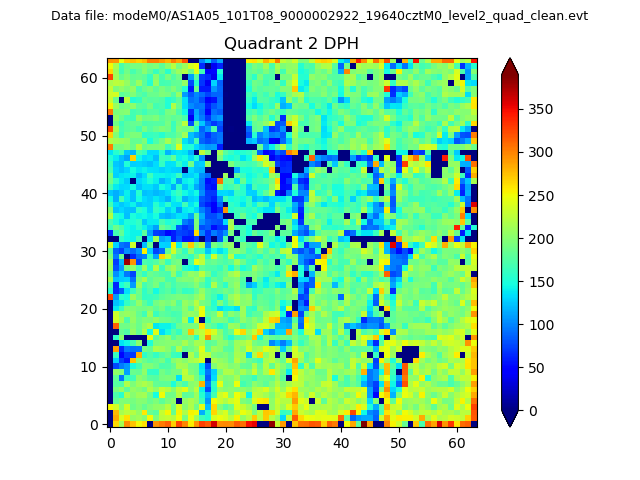
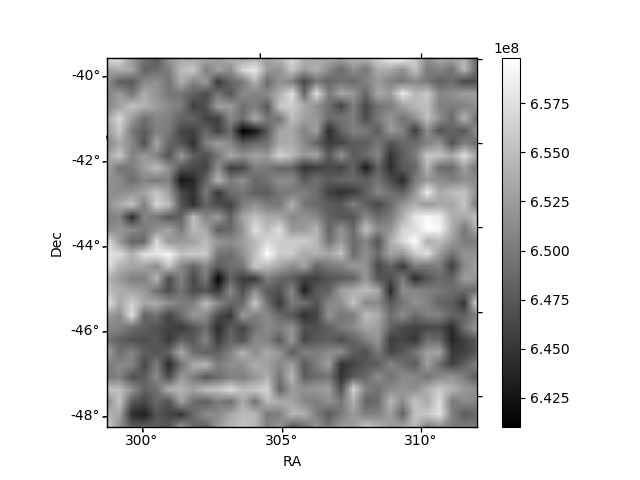
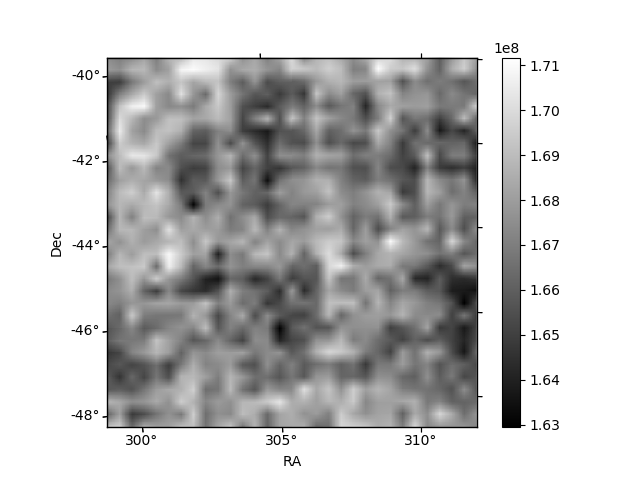
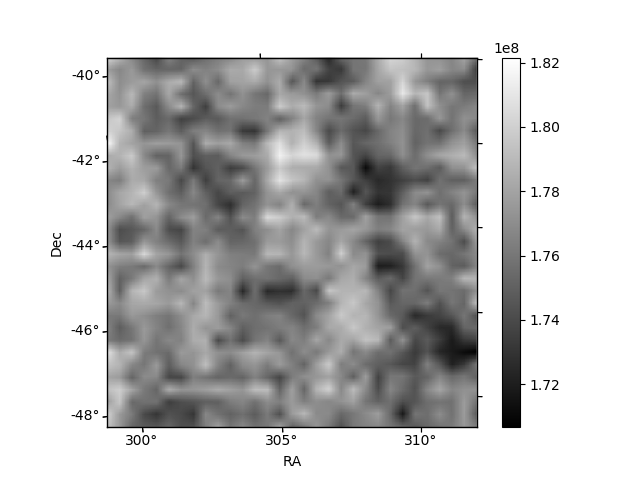
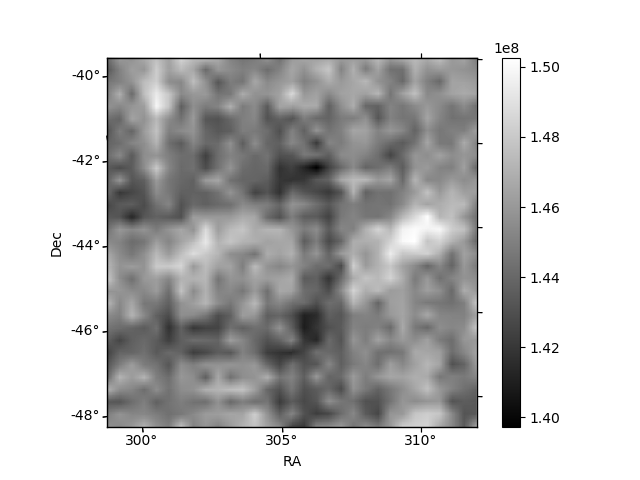
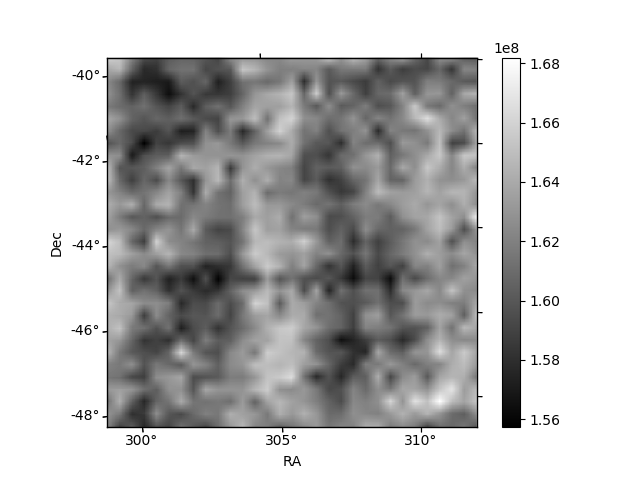
Histogram calculated using DETX and DETY for each event in the final _common_clean file
| Quadrant A | 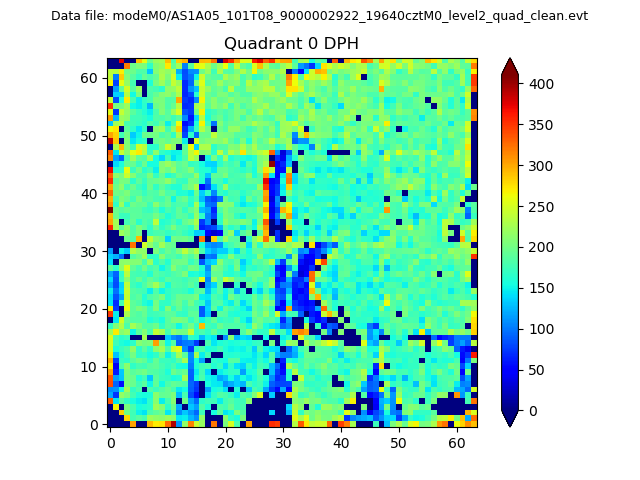 |
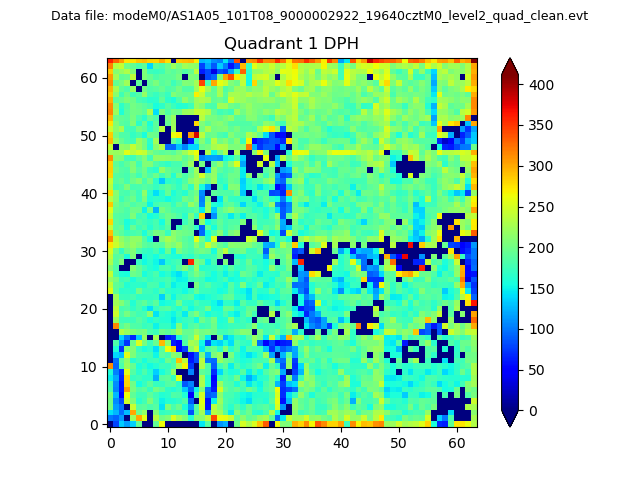 |
Quadrant B |
|---|---|---|---|
| Quadrant D | 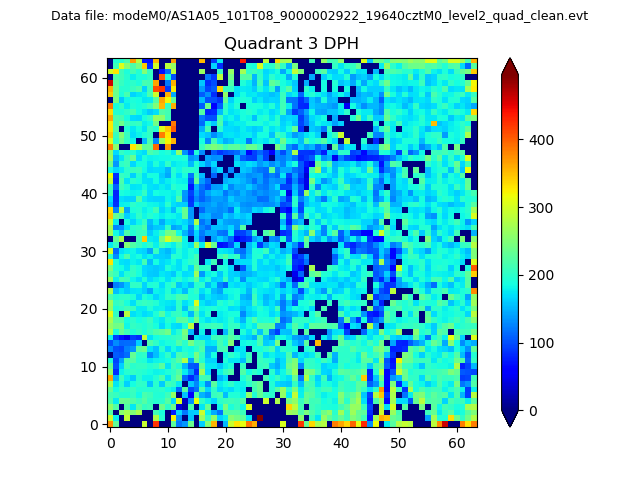 |
 |
Quadrant C |
| Plot type | Count rate plots | Images |
|---|---|---|
| Comparison with Poisson distribution Blue bars denote a histogram of data divided into 1 sec bins. Red curve is a Poisson curve with rate = median count rate of data. |
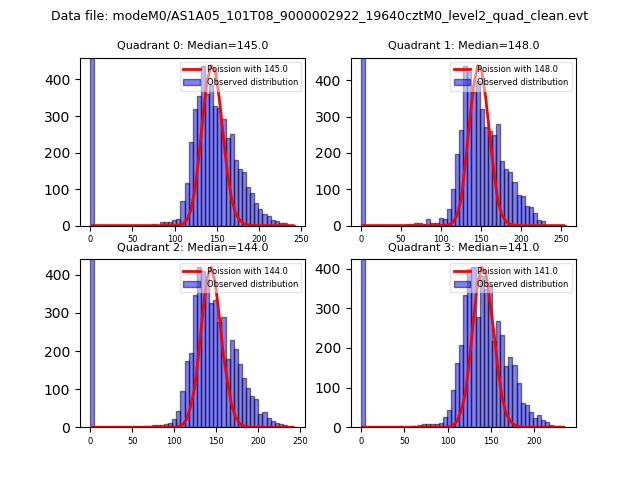 |
 |
| Quadrant-wise count rates Data is divided into 100 sec bins |
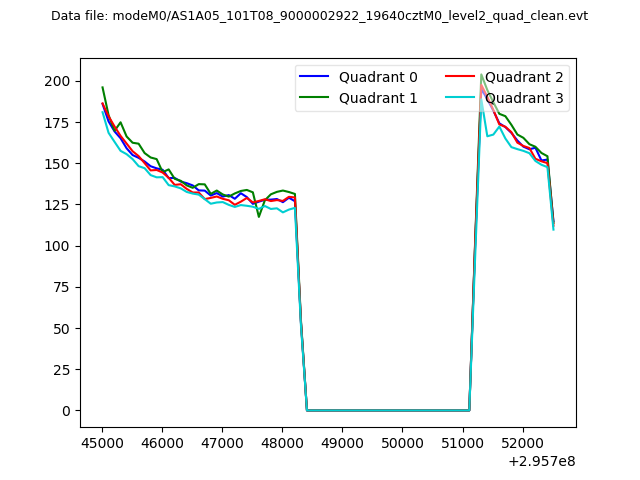 |
|
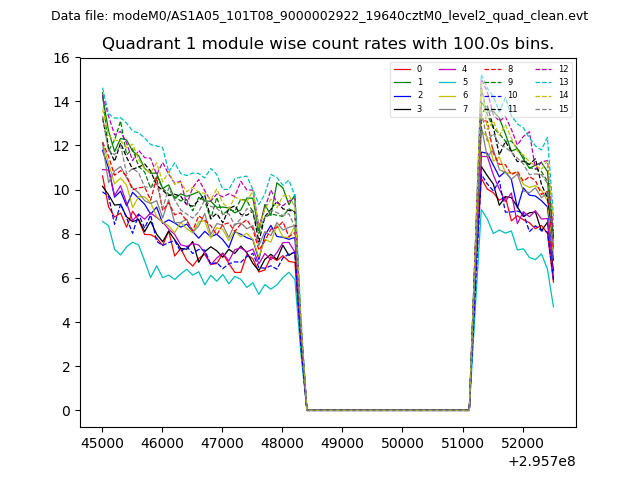
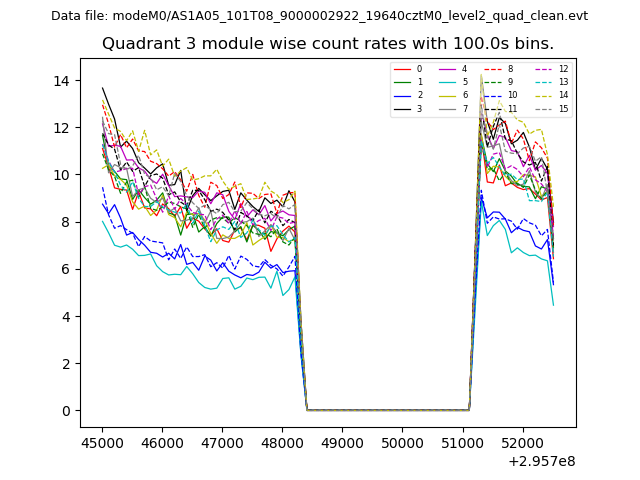
| Module-wise count rates for Quadrant A Data is divided into 100 sec bins |
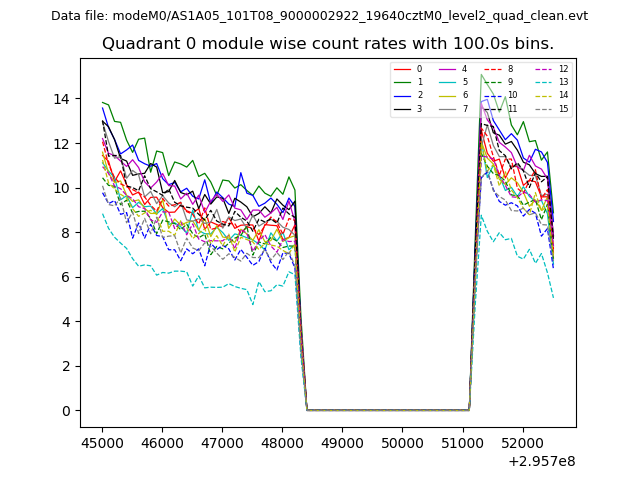 |
 |
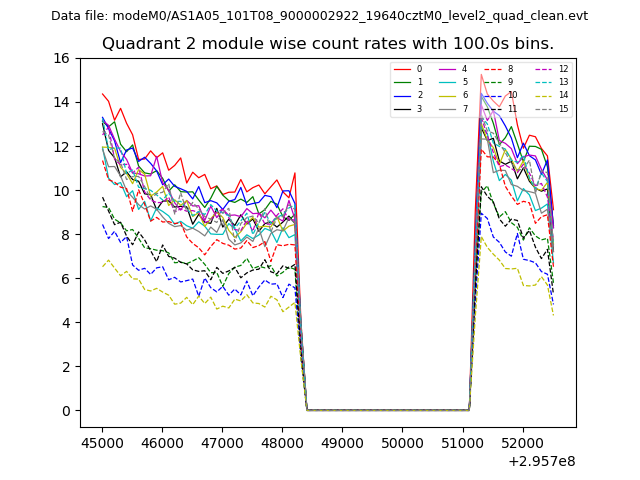
| Module-wise count rates for Quadrant B Data is divided into 100 sec bins |
 |
 |
| Module-wise count rates for Quadrant C Data is divided into 100 sec bins |
 |
 |
| Module-wise count rates for Quadrant D Data is divided into 100 sec bins |
 |
 |
| Parameter | Plot |
|---|---|
| CZT HV Monitor | 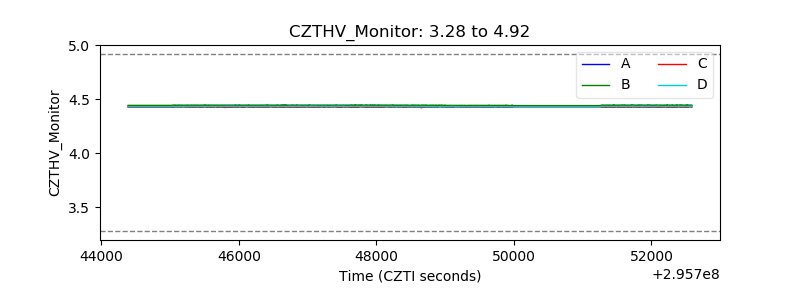 |
| D_VDD | 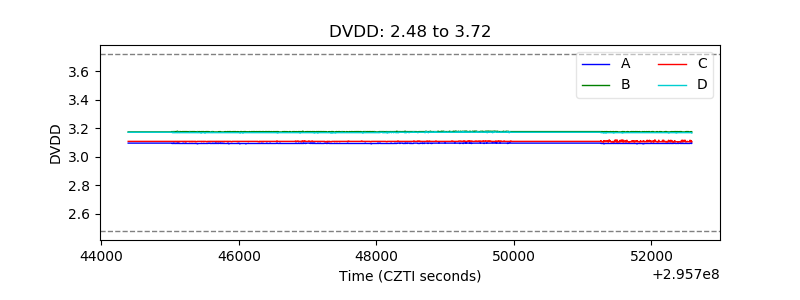 |
| Temperature 1 | 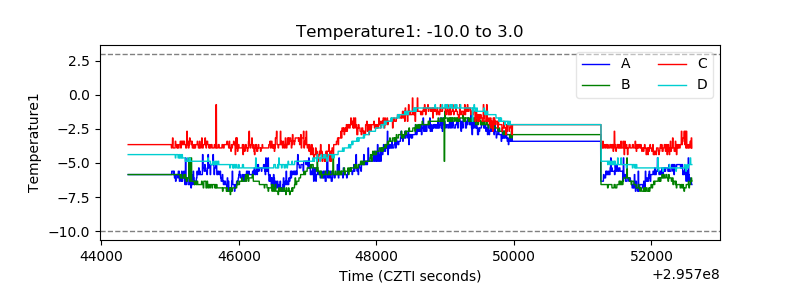 |
| Veto HV Monitor | 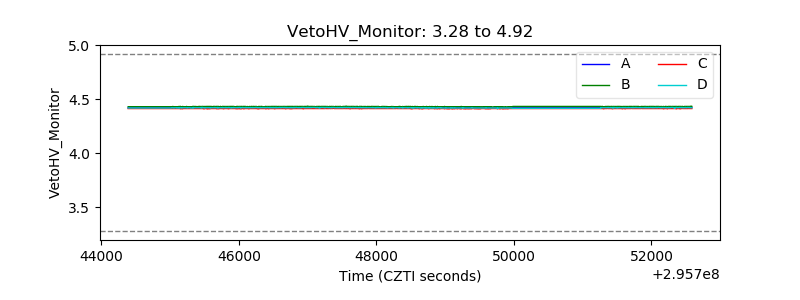 |
| Veto LLD | 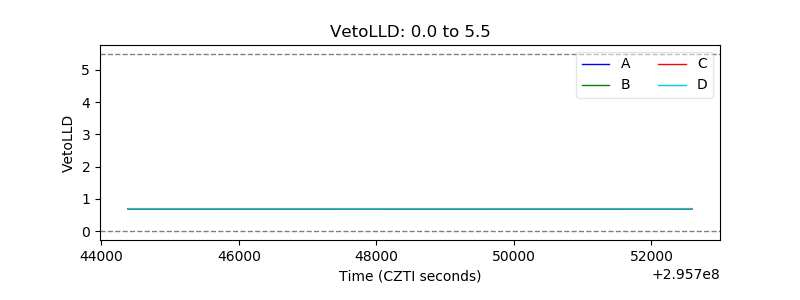 |
| Alpha Counter | 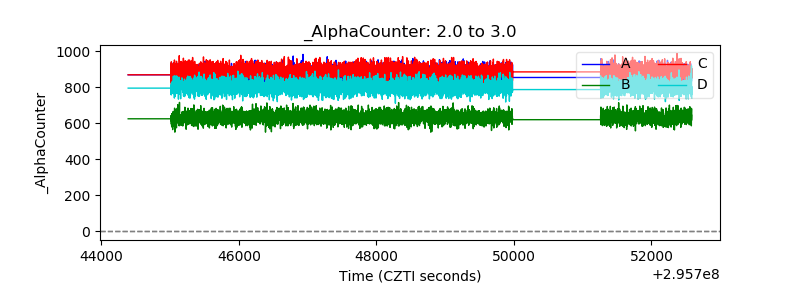 |
| _CPM_Rate | 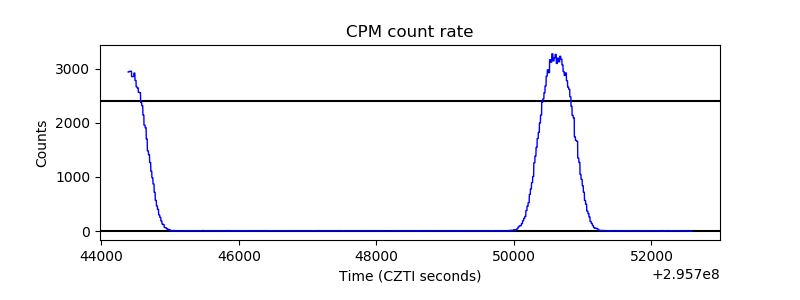 |
| CZT Counter | 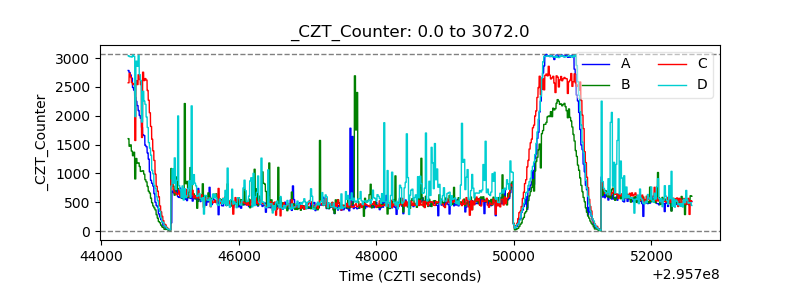 |
| +2.5 Volts monitor |  |
| +5 Volts monitor |  |
| _ROLL_ROT | 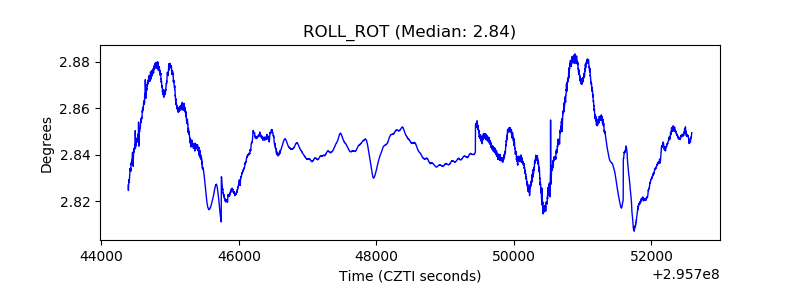 |
| _Roll_DEC | 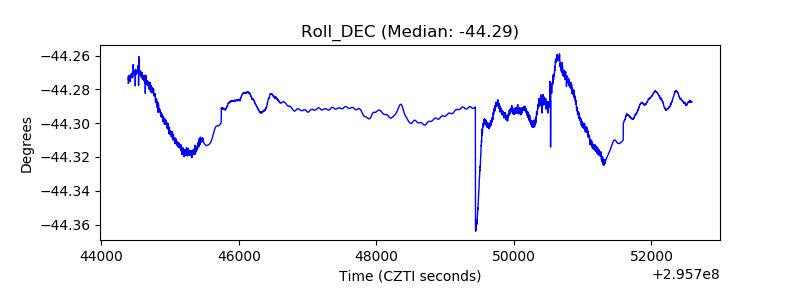 |
| _Roll_RA | 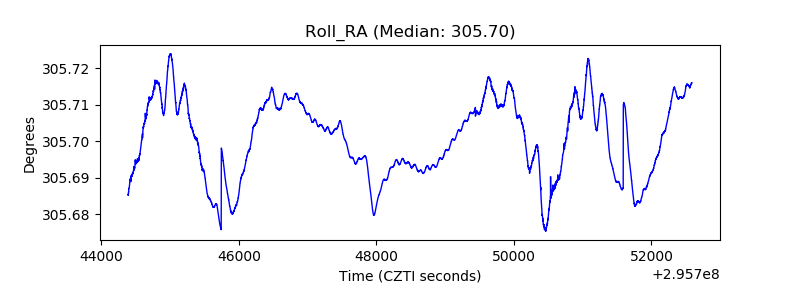 |
| Veto Counter | 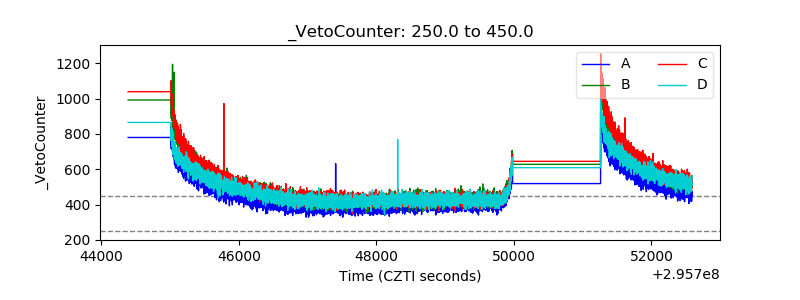 |