| Param | Original file | Final file |
|---|---|---|
| Filename | modeM0/AS1A05_101T08_9000002922_19641cztM0_level2.evt | modeM0/AS1A05_101T08_9000002922_19641cztM0_level2_quad_clean.evt |
| Size (bytes) | 500,083,200 | 102,147,840 |
| Size | 476.9 MB | 97.4 MB |
| Events in quadrant A | 3,144,229 | 668,641 |
| Events in quadrant B | 3,354,279 | 685,923 |
| Events in quadrant C | 3,317,020 | 666,980 |
| Events in quadrant D | 4,907,587 | 637,744 |
| Mode M9 | |||
|---|---|---|---|
| Quadrant | BADHDUFLAG | Total packets | Discarded packets |
| A | 0 | 25 | 0 |
| B | 0 | 26 | 0 |
| C | 0 | 26 | 0 |
| D | 0 | 26 | 0 |
| Mode M0 | |||
|---|---|---|---|
| Quadrant | BADHDUFLAG | Total packets | Discarded packets |
| A | 0 | 13115 | 2 |
| B | 0 | 13735 | 2 |
| C | 0 | 13569 | 2 |
| D | 0 | 18813 | 2 |
| Mode SS | |||
|---|---|---|---|
| Quadrant | BADHDUFLAG | Total packets | Discarded packets |
| A | 0 | 126 | 0 |
| B | 0 | 126 | 0 |
| C | 0 | 126 | 0 |
| D | 0 | 126 | 0 |
| Quadrant | Total seconds | Saturated seconds | Saturation percentage |
|---|---|---|---|
| A | 6226 | 28 | 0.449727% |
| B | 6225 | 38 | 0.610442% |
| C | 6225 | 59 | 0.947791% |
| D | 6225 | 296 | 4.755020% |
Noise dominated data is calculated using 1-second bins in cleaned event files. If a bin has >2000 counts, and if more than 50% of those come from <1% of pixels, then it is considered to be noise-dominated and hence unusable.
| Quadrant | # 1 sec bins | Bins with >0 counts | Bins with >2000 counts | High rate bins dominated by noise | Noise dominated (total time) | Noise dominated (detector-on time) | Marked lightcurve |
|---|---|---|---|---|---|---|---|
| A | 7576 | 6227 | 1 | 1 | 0.01% | 0.02% | 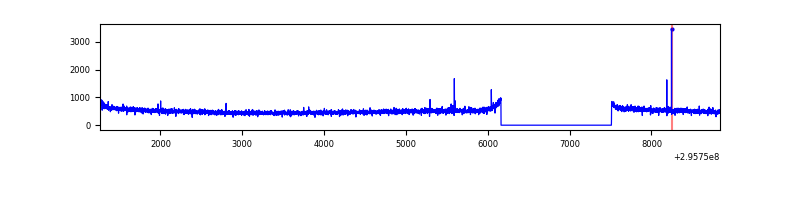 |
| B | 7575 | 6226 | 6 | 6 | 0.08% | 0.10% | 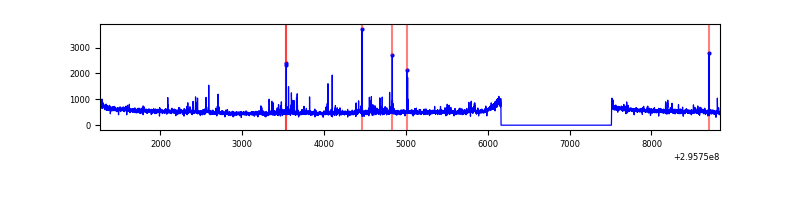 |
| C | 7575 | 6226 | 0 | 0 | 0.00% | 0.00% | 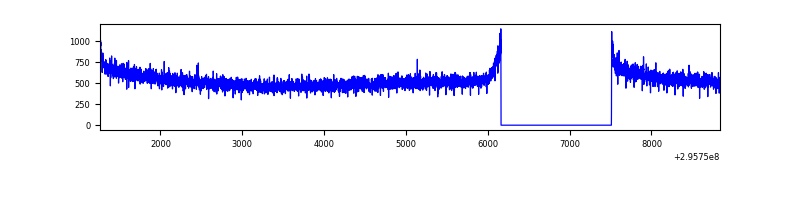 |
| D | 7575 | 6226 | 225 | 225 | 2.97% | 3.61% | 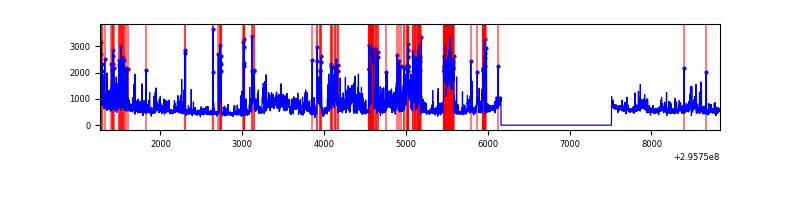 |
Top three noisy pixels from each quadrant. If the there are fewer than three noisy pixels in the level2.evt file, extra rows are filled as -1
| Pixel properties | Quadrant properties | ||||||
|---|---|---|---|---|---|---|---|
| Quadrant | DetID | PixID | Counts | Sigma | Mean | Median | Sigma |
| A | 5 | 16 | 14936 | 87.56 | 812 | 797 | 161.5 |
| A | 0 | 226 | 7107 | 39.08 | 812 | 797 | 161.5 |
| A | 13 | 254 | 6177 | 33.32 | 812 | 797 | 161.5 |
| B | 3 | 112 | 105037 | 698.57 | 816 | 798 | 149.2 |
| B | 0 | 198 | 18169 | 116.41 | 816 | 798 | 149.2 |
| B | 4 | 216 | 17797 | 113.92 | 816 | 798 | 149.2 |
| C | 14 | 238 | 126499 | 673.7 | 808 | 814 | 186.6 |
| C | 3 | 233 | 19243 | 98.78 | 808 | 814 | 186.6 |
| C | 8 | 128 | 11672 | 58.2 | 808 | 814 | 186.6 |
| D | 7 | 238 | 977917 | 5063.8 | 799 | 778 | 193.0 |
| D | 1 | 52 | 677577 | 3507.36 | 799 | 778 | 193.0 |
| D | 12 | 218 | 96009 | 493.51 | 799 | 778 | 193.0 |
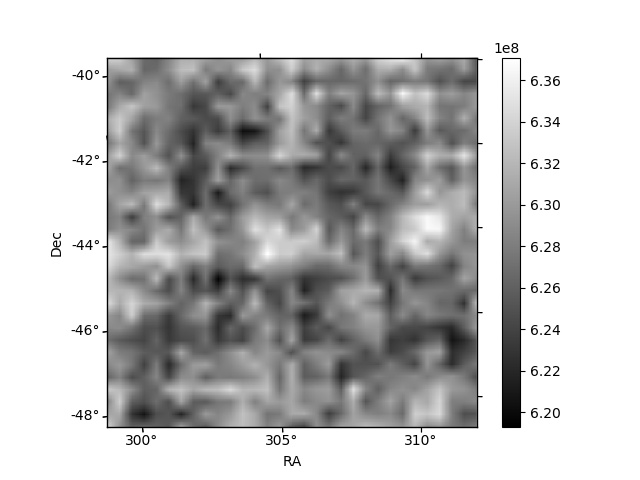
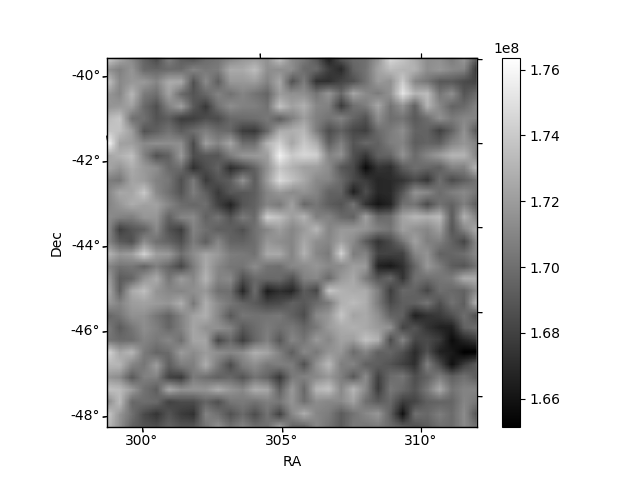
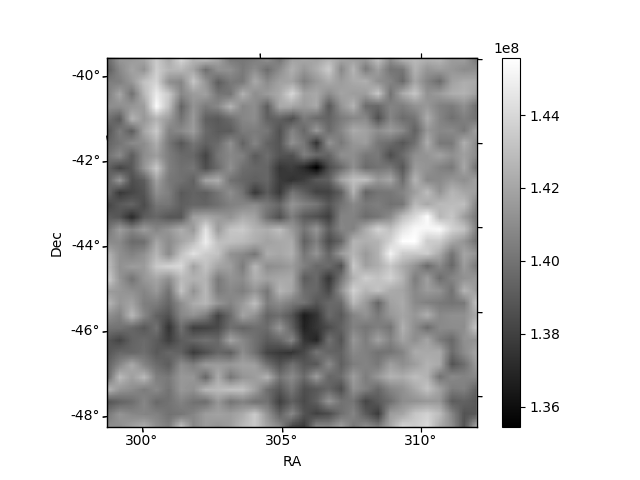
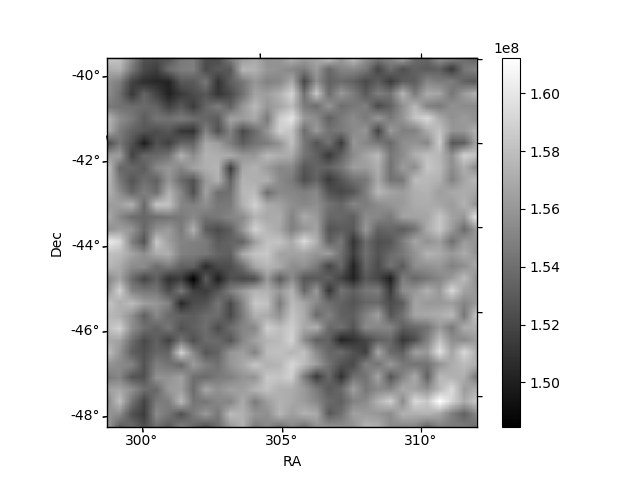
Histogram calculated using DETX and DETY for each event in the final _common_clean file
| Quadrant A | 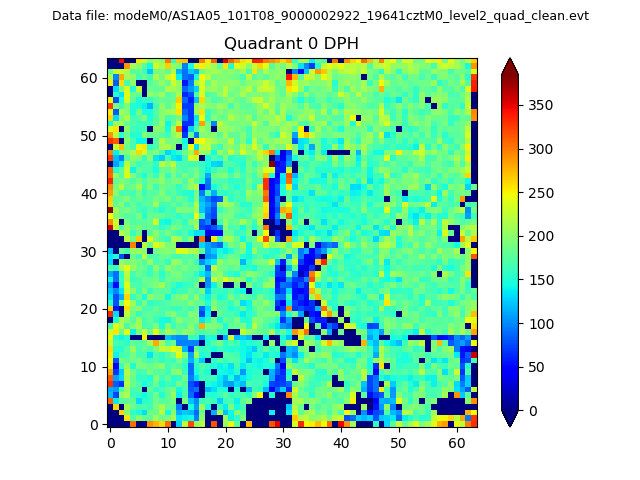 |
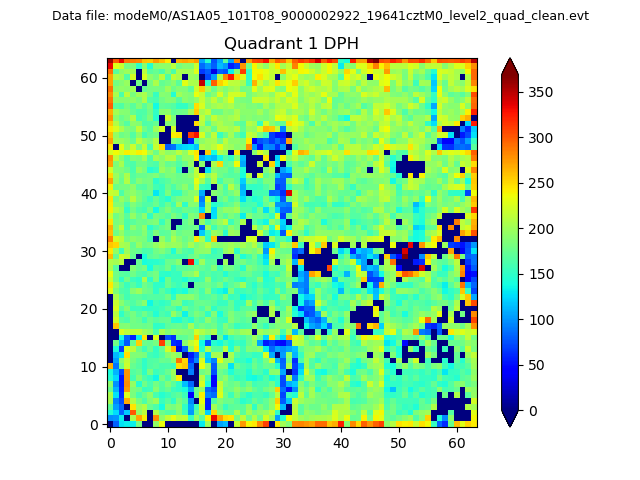 |
Quadrant B |
|---|---|---|---|
| Quadrant D | 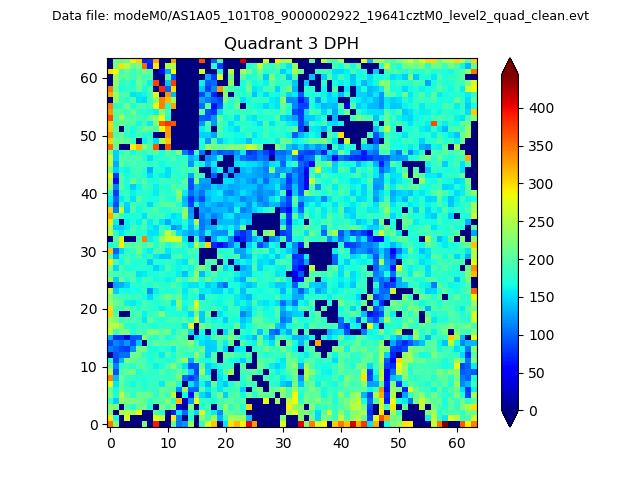 |
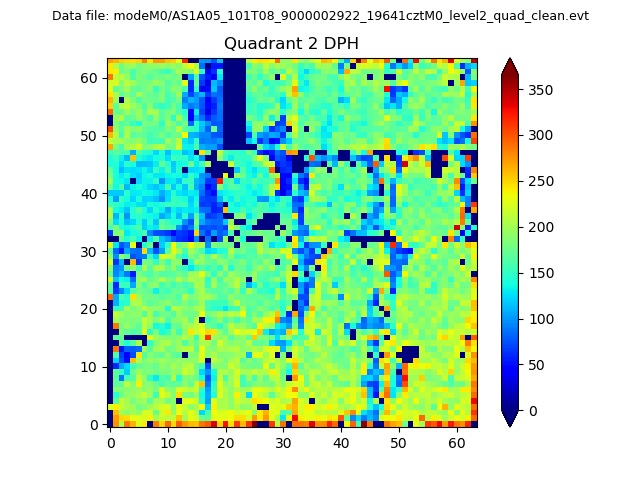 |
Quadrant C |
| Plot type | Count rate plots | Images |
|---|---|---|
| Comparison with Poisson distribution Blue bars denote a histogram of data divided into 1 sec bins. Red curve is a Poisson curve with rate = median count rate of data. |
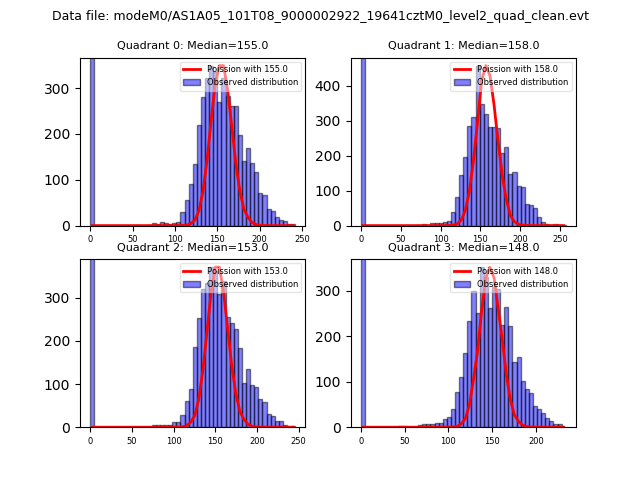 |
 |
| Quadrant-wise count rates Data is divided into 100 sec bins |
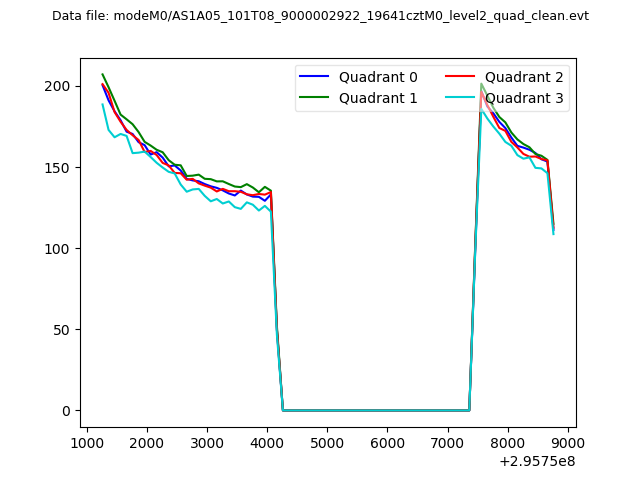 |
|
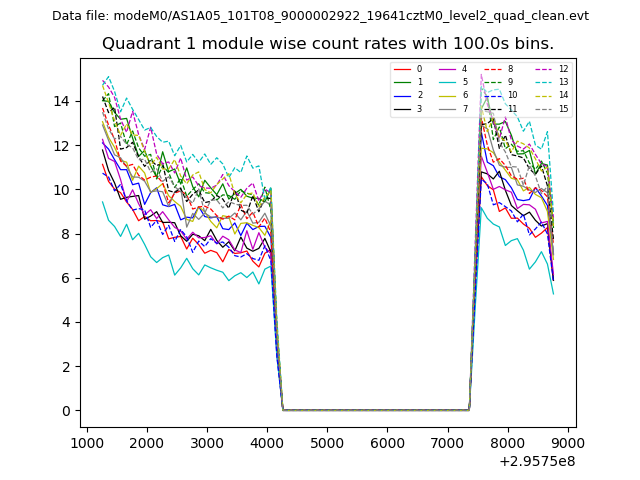
| Module-wise count rates for Quadrant A Data is divided into 100 sec bins |
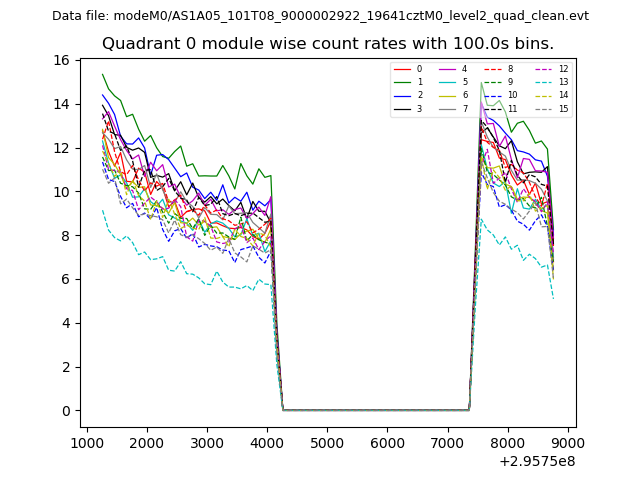 |
 |
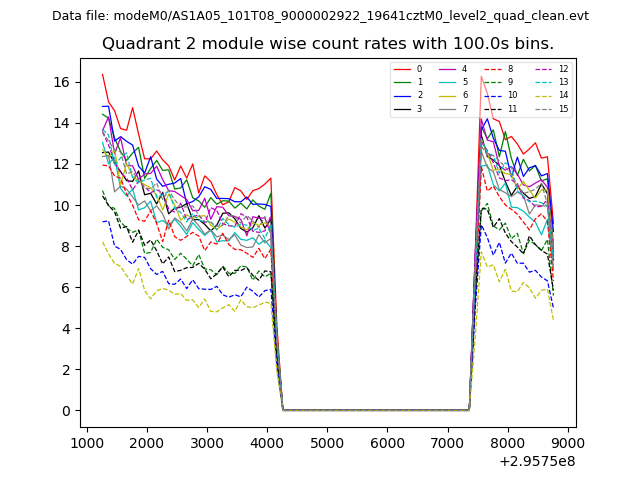
| Module-wise count rates for Quadrant B Data is divided into 100 sec bins |
 |
 |
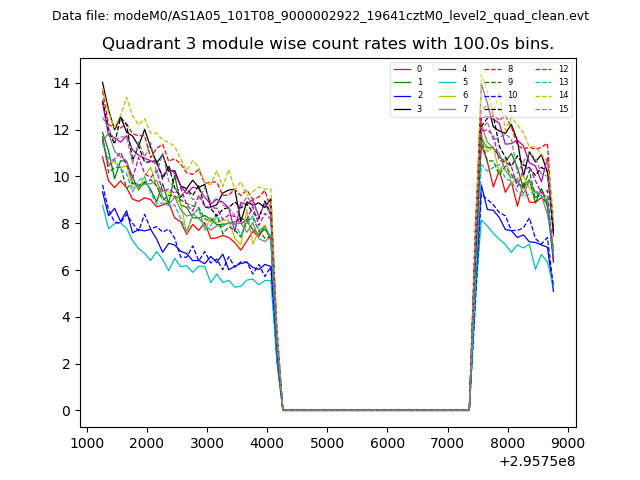
| Module-wise count rates for Quadrant C Data is divided into 100 sec bins |
 |
 |
| Module-wise count rates for Quadrant D Data is divided into 100 sec bins |
 |
 |
| Parameter | Plot |
|---|---|
| CZT HV Monitor | 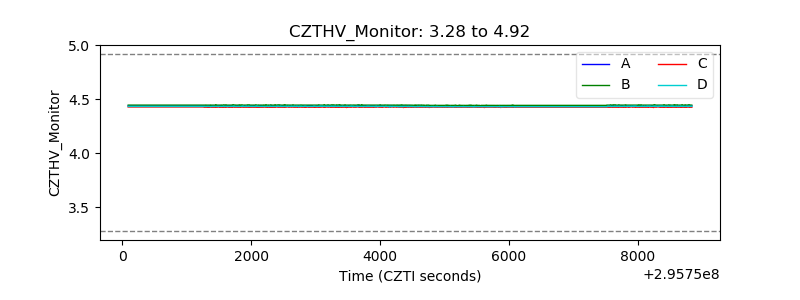 |
| D_VDD | 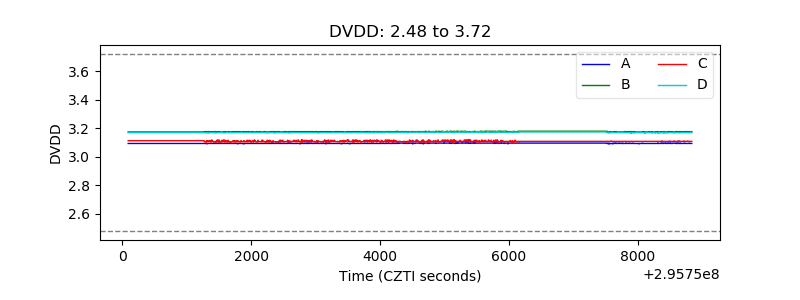 |
| Temperature 1 | 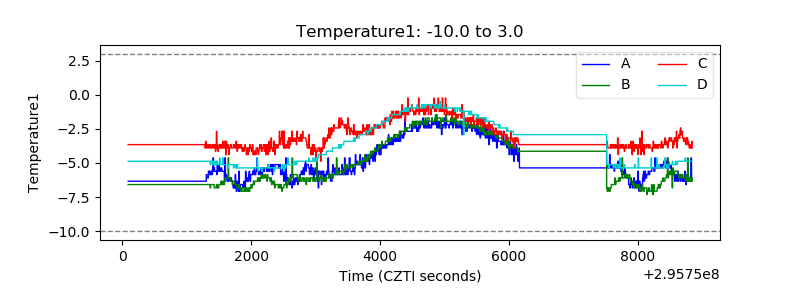 |
| Veto HV Monitor | 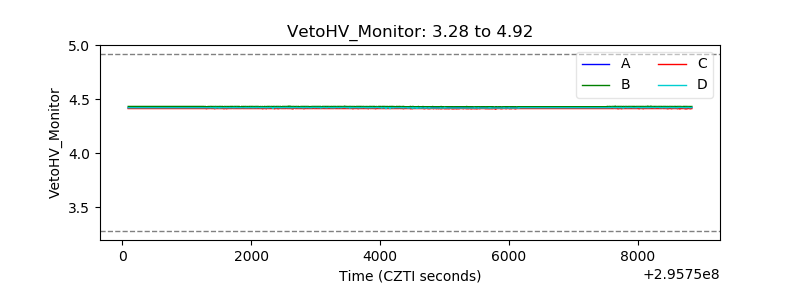 |
| Veto LLD |  |
| Alpha Counter | 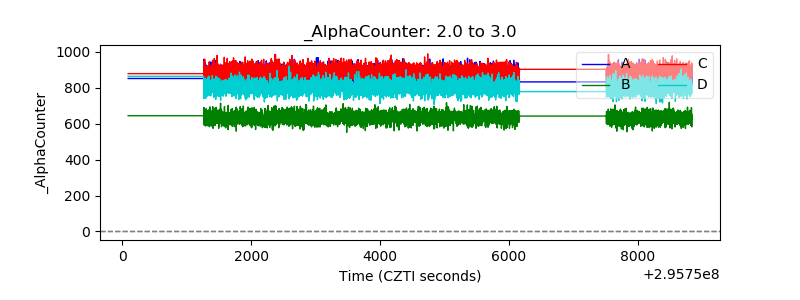 |
| _CPM_Rate | 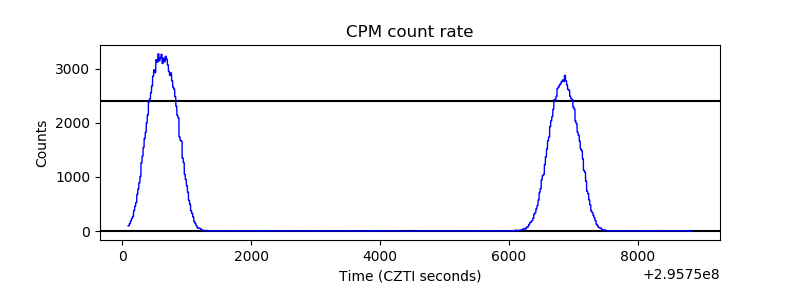 |
| CZT Counter | 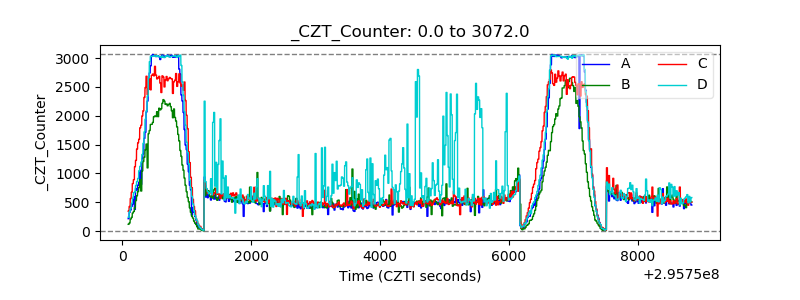 |
| +2.5 Volts monitor |  |
| +5 Volts monitor |  |
| _ROLL_ROT | 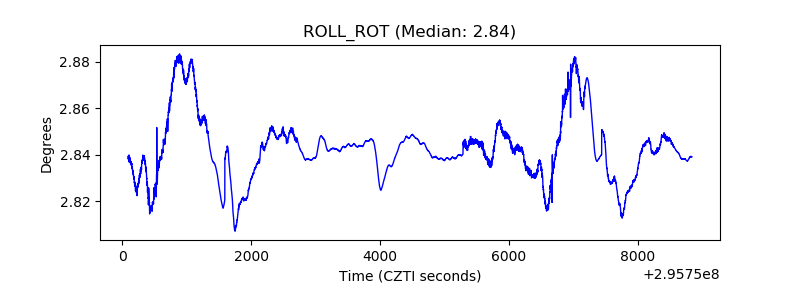 |
| _Roll_DEC | 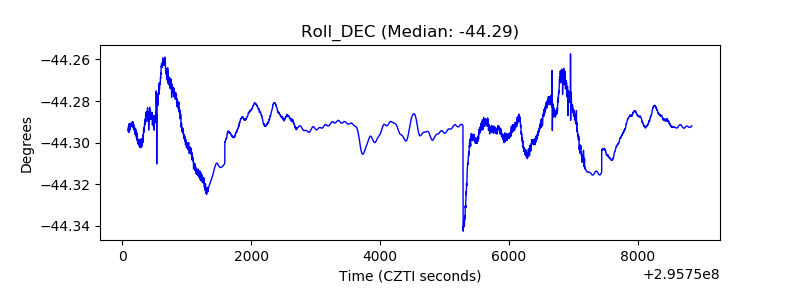 |
| _Roll_RA | 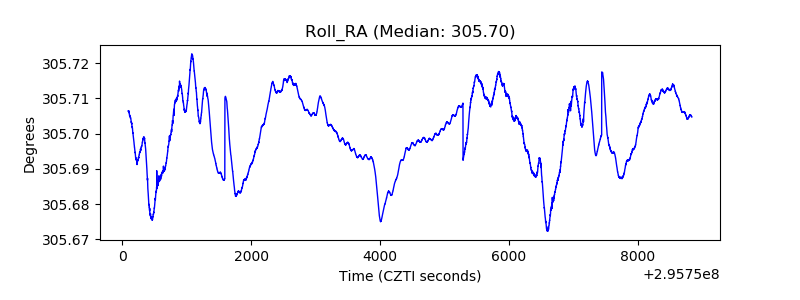 |
| Veto Counter | 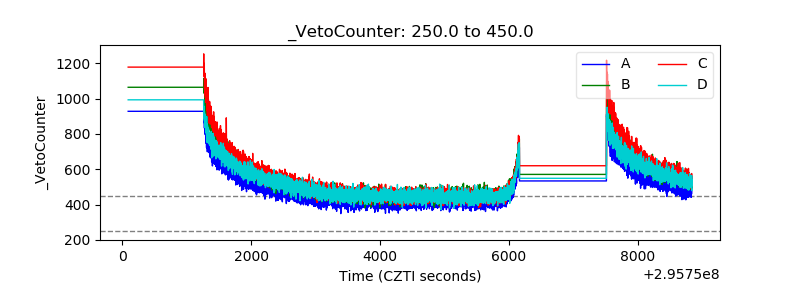 |