| Param | Original file | Final file |
|---|---|---|
| Filename | modeM0/AS1A05_101T08_9000002922_19642cztM0_level2.evt | modeM0/AS1A05_101T08_9000002922_19642cztM0_level2_quad_clean.evt |
| Size (bytes) | 517,631,040 | 100,313,280 |
| Size | 493.7 MB | 95.7 MB |
| Events in quadrant A | 3,139,982 | 660,516 |
| Events in quadrant B | 3,421,298 | 671,507 |
| Events in quadrant C | 3,293,310 | 654,724 |
| Events in quadrant D | 5,402,050 | 618,786 |
| Mode M9 | |||
|---|---|---|---|
| Quadrant | BADHDUFLAG | Total packets | Discarded packets |
| A | 0 | 21 | 0 |
| B | 0 | 22 | 0 |
| C | 0 | 22 | 0 |
| D | 0 | 22 | 0 |
| Mode M0 | |||
|---|---|---|---|
| Quadrant | BADHDUFLAG | Total packets | Discarded packets |
| A | 0 | 13009 | 2 |
| B | 0 | 13941 | 2 |
| C | 0 | 13421 | 2 |
| D | 0 | 20220 | 2 |
| Mode SS | |||
|---|---|---|---|
| Quadrant | BADHDUFLAG | Total packets | Discarded packets |
| A | 0 | 126 | 0 |
| B | 0 | 126 | 0 |
| C | 0 | 126 | 0 |
| D | 0 | 126 | 0 |
| Quadrant | Total seconds | Saturated seconds | Saturation percentage |
|---|---|---|---|
| A | 6193 | 35 | 0.565154% |
| B | 6193 | 88 | 1.420959% |
| C | 6193 | 73 | 1.178750% |
| D | 6193 | 500 | 8.073632% |
Noise dominated data is calculated using 1-second bins in cleaned event files. If a bin has >2000 counts, and if more than 50% of those come from <1% of pixels, then it is considered to be noise-dominated and hence unusable.
| Quadrant | # 1 sec bins | Bins with >0 counts | Bins with >2000 counts | High rate bins dominated by noise | Noise dominated (total time) | Noise dominated (detector-on time) | Marked lightcurve |
|---|---|---|---|---|---|---|---|
| A | 7539 | 6195 | 1 | 1 | 0.01% | 0.02% | 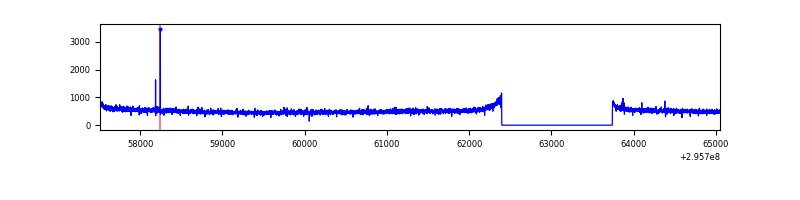 |
| B | 7539 | 6195 | 27 | 27 | 0.36% | 0.44% | 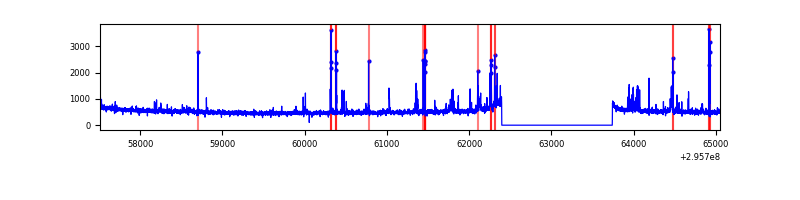 |
| C | 7539 | 6195 | 0 | 0 | 0.00% | 0.00% | 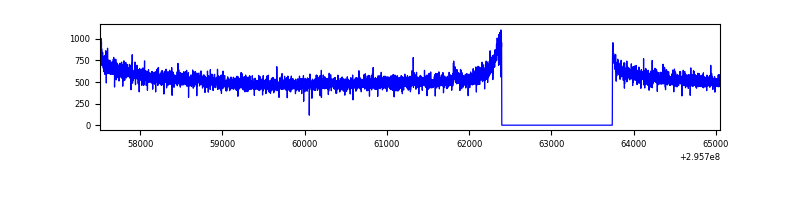 |
| D | 7539 | 6195 | 405 | 405 | 5.37% | 6.54% | 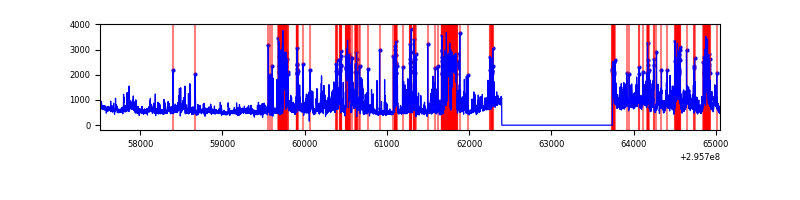 |
Top three noisy pixels from each quadrant. If the there are fewer than three noisy pixels in the level2.evt file, extra rows are filled as -1
| Pixel properties | Quadrant properties | ||||||
|---|---|---|---|---|---|---|---|
| Quadrant | DetID | PixID | Counts | Sigma | Mean | Median | Sigma |
| A | 5 | 16 | 7252 | 39.92 | 813 | 794 | 161.8 |
| A | 0 | 226 | 7038 | 38.6 | 813 | 794 | 161.8 |
| A | 12 | 194 | 5911 | 31.63 | 813 | 794 | 161.8 |
| B | 3 | 112 | 157361 | 1047.28 | 808 | 790 | 149.5 |
| B | 7 | 220 | 53500 | 352.57 | 808 | 790 | 149.5 |
| B | 3 | 64 | 29708 | 193.43 | 808 | 790 | 149.5 |
| C | 14 | 238 | 126131 | 676.28 | 803 | 811 | 185.3 |
| C | 3 | 233 | 24053 | 125.42 | 803 | 811 | 185.3 |
| C | 9 | 221 | 6255 | 29.38 | 803 | 811 | 185.3 |
| D | 12 | 218 | 1175312 | 6225.83 | 786 | 765 | 188.7 |
| D | 1 | 52 | 686043 | 3632.4 | 786 | 765 | 188.7 |
| D | 7 | 238 | 523728 | 2772.03 | 786 | 765 | 188.7 |
Histogram calculated using DETX and DETY for each event in the final _common_clean file
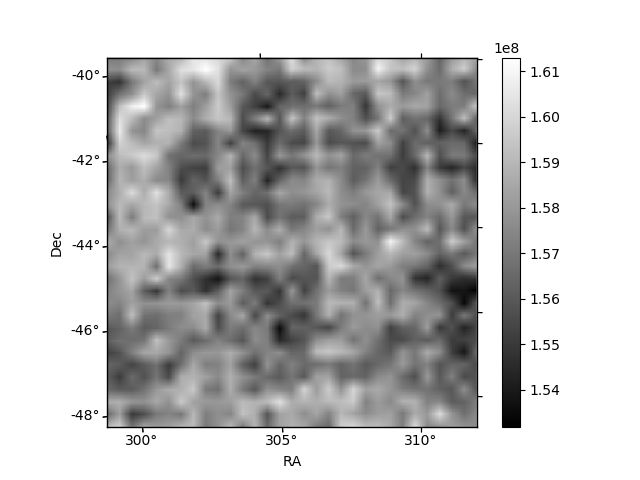
| Quadrant A | 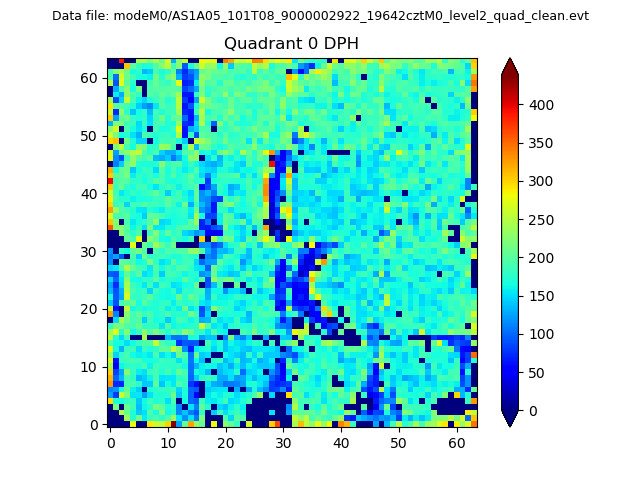 |
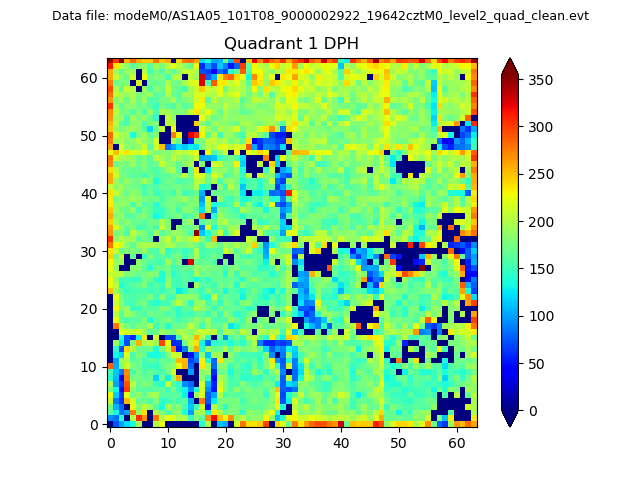 |
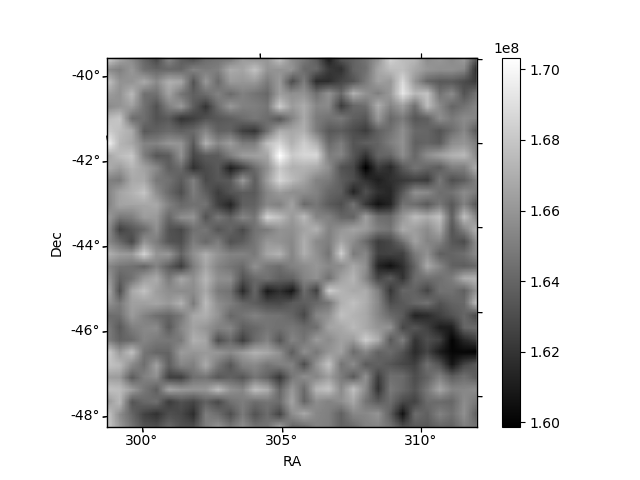
Quadrant B |
|---|---|---|---|
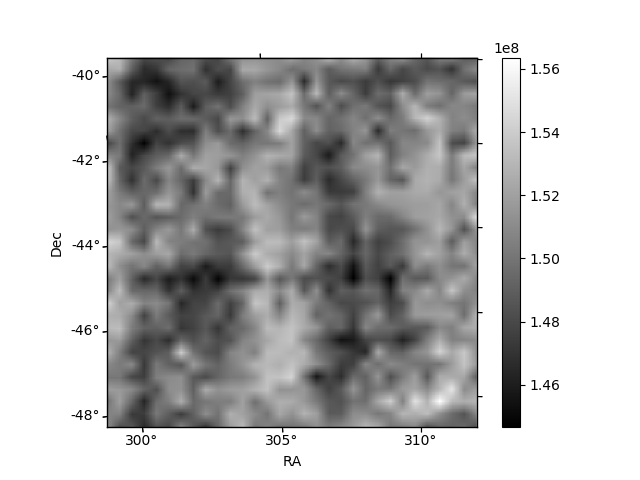
| Quadrant D |  |
 |
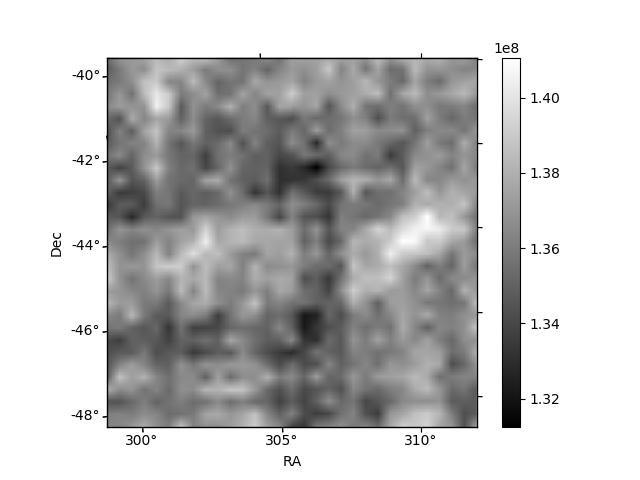
Quadrant C |
| Plot type | Count rate plots | Images |
|---|---|---|
| Comparison with Poisson distribution Blue bars denote a histogram of data divided into 1 sec bins. Red curve is a Poisson curve with rate = median count rate of data. |
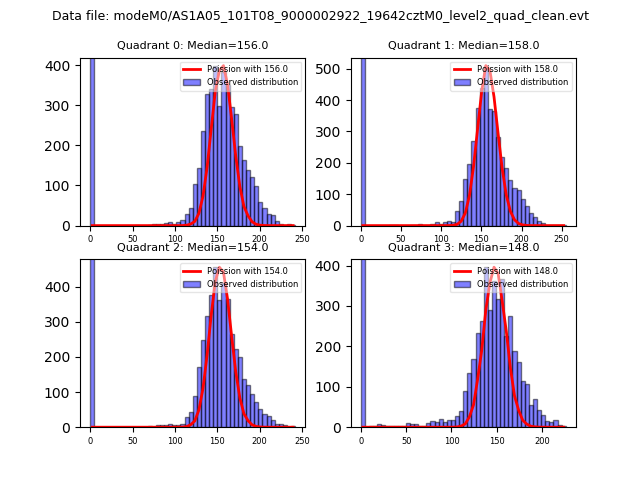 |
 |
| Quadrant-wise count rates Data is divided into 100 sec bins |
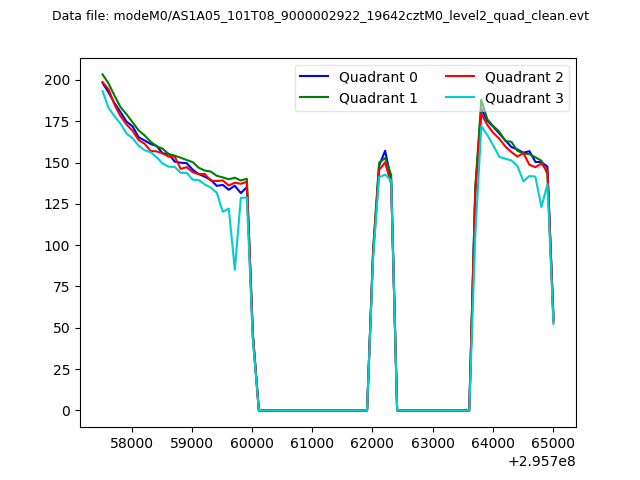 |
|
| Module-wise count rates for Quadrant A Data is divided into 100 sec bins |
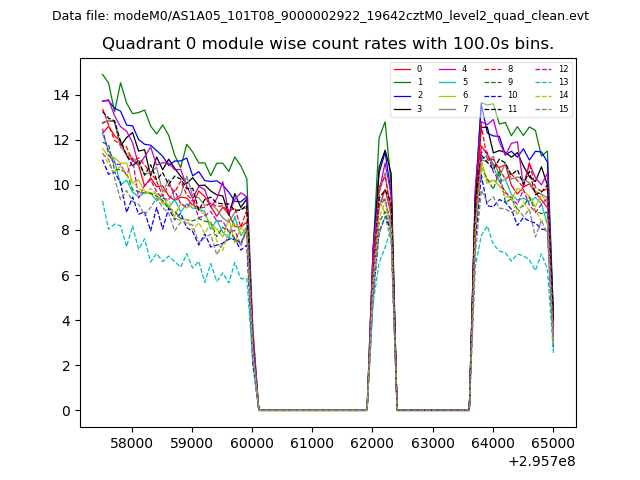 |
 |
| Module-wise count rates for Quadrant B Data is divided into 100 sec bins |
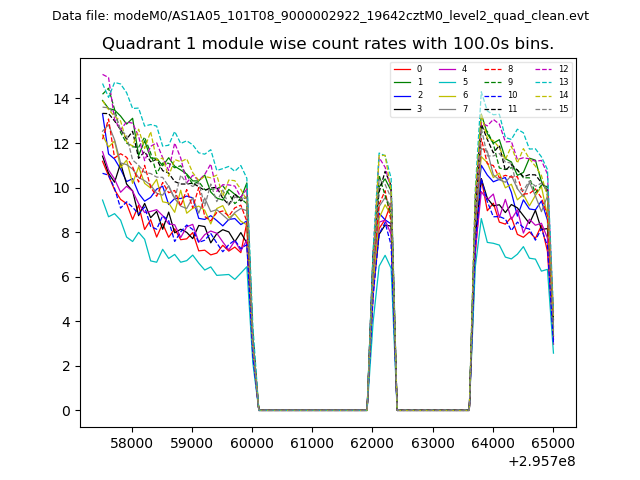 |
 |
| Module-wise count rates for Quadrant C Data is divided into 100 sec bins |
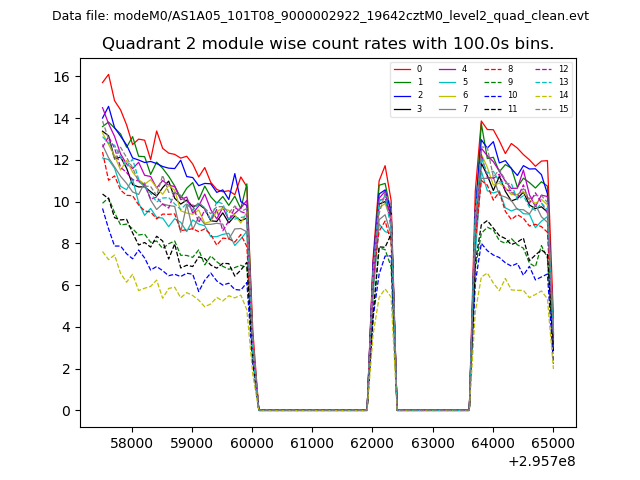 |
 |
| Module-wise count rates for Quadrant D Data is divided into 100 sec bins |
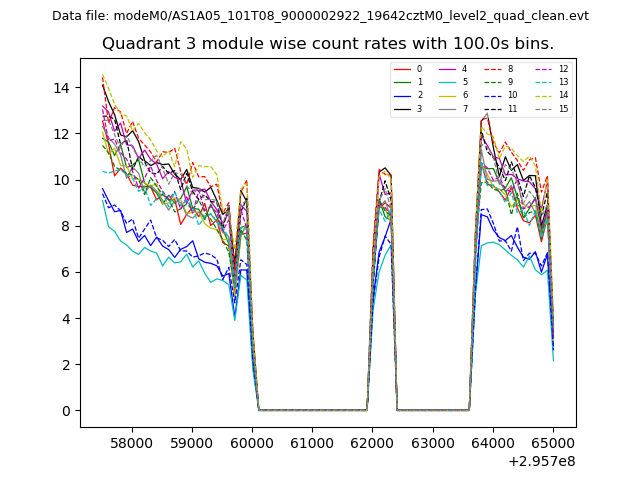 |
 |
| Parameter | Plot |
|---|---|
| CZT HV Monitor | 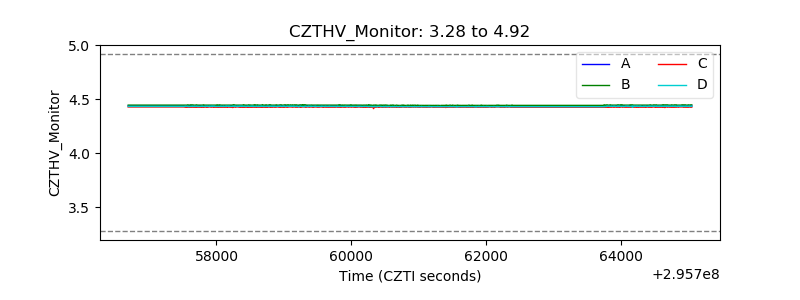 |
| D_VDD | 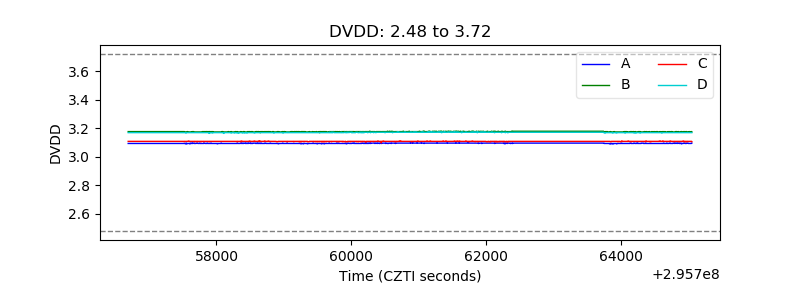 |
| Temperature 1 | 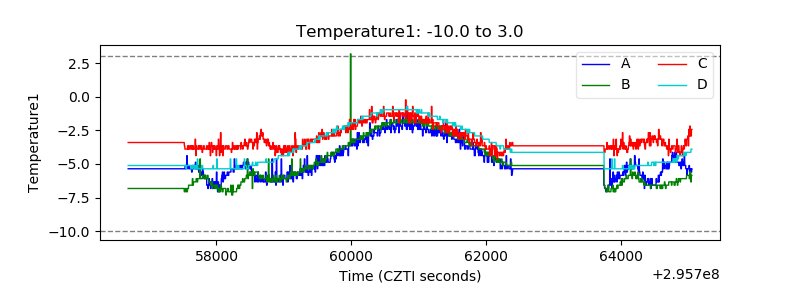 |
| Veto HV Monitor | 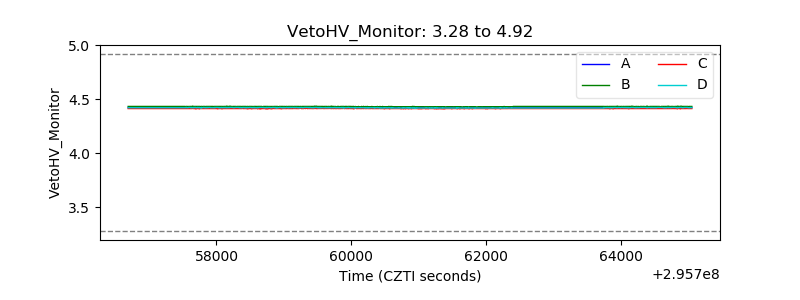 |
| Veto LLD | 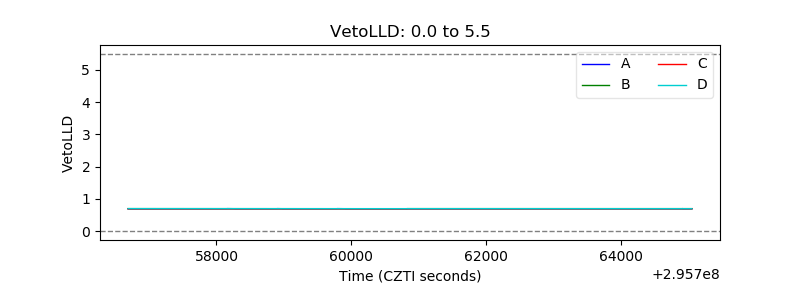 |
| Alpha Counter | 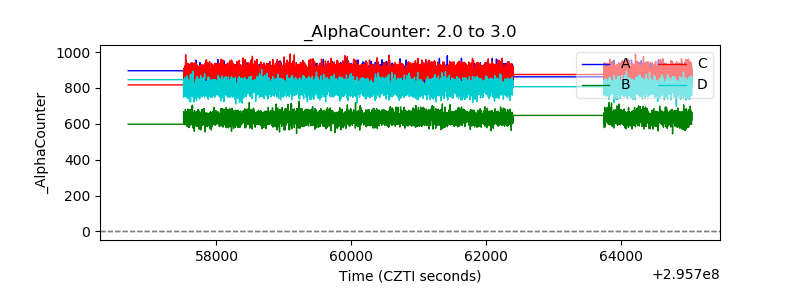 |
| _CPM_Rate | 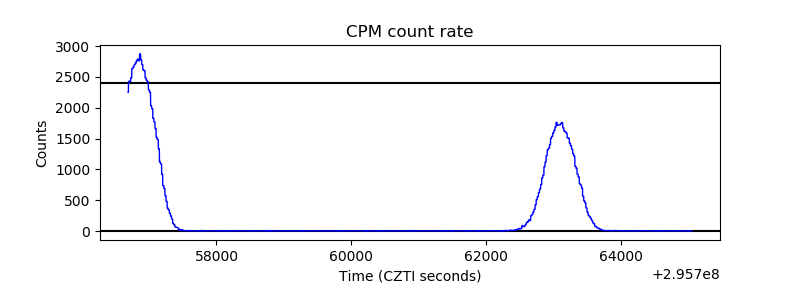 |
| CZT Counter |  |
| +2.5 Volts monitor |  |
| +5 Volts monitor | 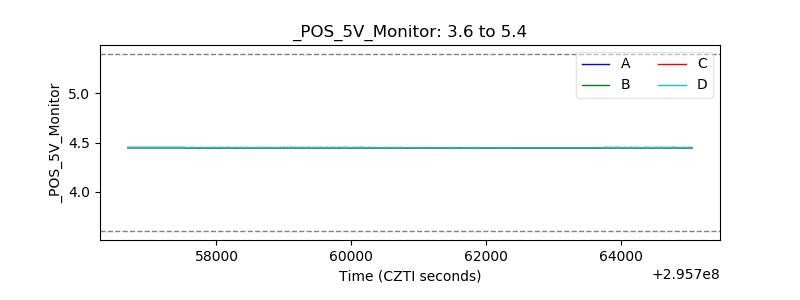 |
| _ROLL_ROT | 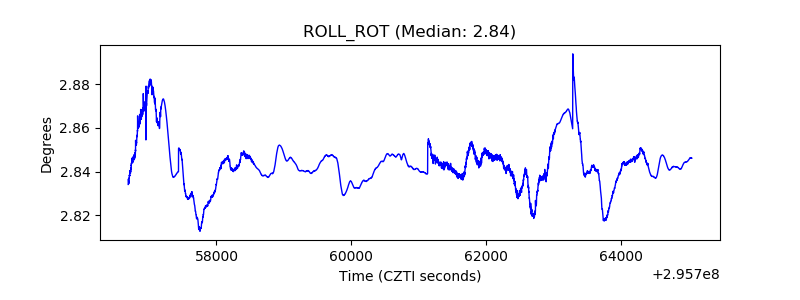 |
| _Roll_DEC | 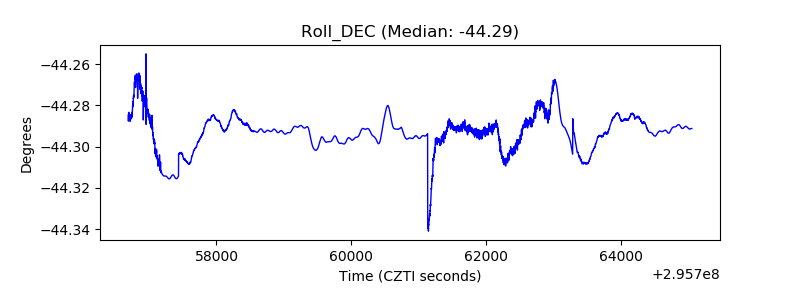 |
| _Roll_RA | 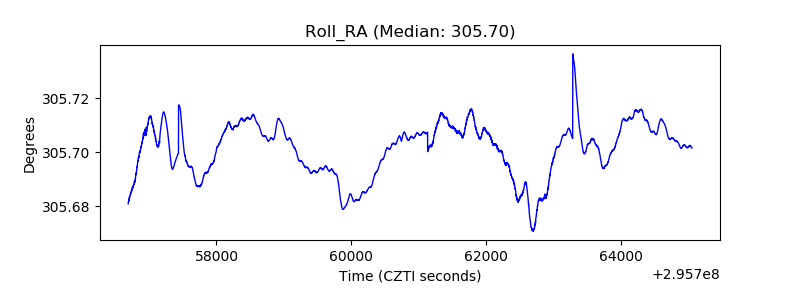 |
| Veto Counter | 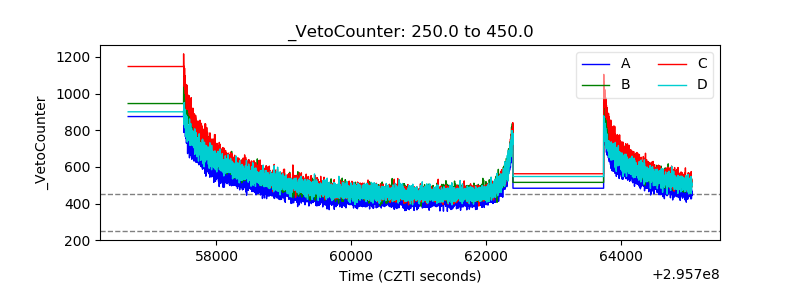 |