| Param | Original file | Final file |
|---|---|---|
| Filename | modeM0/AS1A05_101T08_9000002922_19644cztM0_level2.evt | modeM0/AS1A05_101T08_9000002922_19644cztM0_level2_quad_clean.evt |
| Size (bytes) | 333,855,360 | 50,711,040 |
| Size | 318.4 MB | 48.4 MB |
| Events in quadrant A | 1,982,019 | 317,065 |
| Events in quadrant B | 2,254,856 | 320,192 |
| Events in quadrant C | 2,017,573 | 309,483 |
| Events in quadrant D | 3,565,992 | 288,393 |
| Mode M0 | |||
|---|---|---|---|
| Quadrant | BADHDUFLAG | Total packets | Discarded packets |
| A | 0 | 8616 | 0 |
| B | 0 | 9390 | 0 |
| C | 0 | 8660 | 0 |
| D | 0 | 13351 | 0 |
| Mode SS | |||
|---|---|---|---|
| Quadrant | BADHDUFLAG | Total packets | Discarded packets |
| A | 0 | 84 | 0 |
| B | 0 | 84 | 0 |
| C | 0 | 84 | 0 |
| D | 0 | 84 | 0 |
| Quadrant | Total seconds | Saturated seconds | Saturation percentage |
|---|---|---|---|
| A | 4263 | 5 | 0.117288% |
| B | 4264 | 35 | 0.820826% |
| C | 4264 | 14 | 0.328330% |
| D | 4264 | 337 | 7.903377% |
Noise dominated data is calculated using 1-second bins in cleaned event files. If a bin has >2000 counts, and if more than 50% of those come from <1% of pixels, then it is considered to be noise-dominated and hence unusable.
| Quadrant | # 1 sec bins | Bins with >0 counts | Bins with >2000 counts | High rate bins dominated by noise | Noise dominated (total time) | Noise dominated (detector-on time) | Marked lightcurve |
|---|---|---|---|---|---|---|---|
| A | 4263 | 4263 | 0 | 0 | 0.00% | 0.00% | 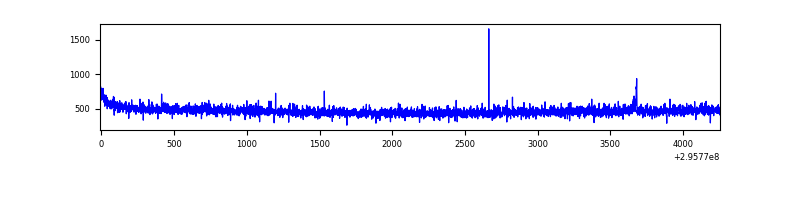 |
| B | 4264 | 4264 | 17 | 17 | 0.40% | 0.40% | 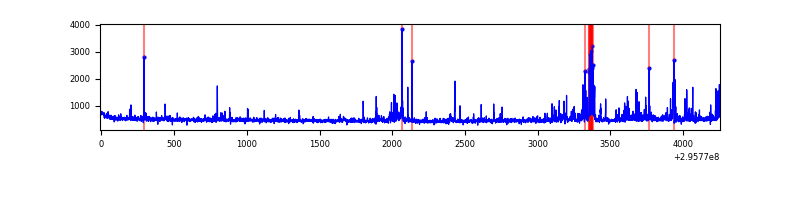 |
| C | 4264 | 4264 | 0 | 0 | 0.00% | 0.00% | 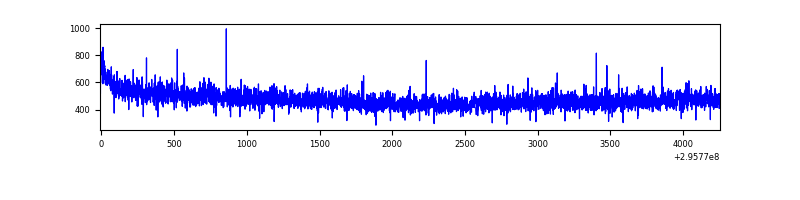 |
| D | 4264 | 4264 | 330 | 330 | 7.74% | 7.74% | 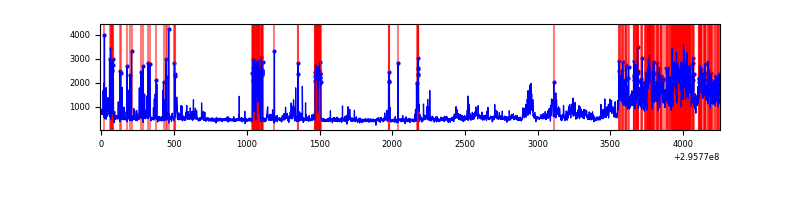 |
Top three noisy pixels from each quadrant. If the there are fewer than three noisy pixels in the level2.evt file, extra rows are filled as -1
| Pixel properties | Quadrant properties | ||||||
|---|---|---|---|---|---|---|---|
| Quadrant | DetID | PixID | Counts | Sigma | Mean | Median | Sigma |
| A | 4 | 2 | 7955 | 72.6 | 512 | 503 | 102.6 |
| A | 13 | 254 | 4757 | 41.45 | 512 | 503 | 102.6 |
| A | 0 | 226 | 4555 | 39.48 | 512 | 503 | 102.6 |
| B | 3 | 112 | 190699 | 1999.76 | 504 | 494 | 95.1 |
| B | 7 | 220 | 50015 | 520.65 | 504 | 494 | 95.1 |
| B | 0 | 197 | 13639 | 138.2 | 504 | 494 | 95.1 |
| C | 14 | 238 | 78366 | 679.01 | 494 | 499 | 114.7 |
| C | 3 | 233 | 10405 | 86.38 | 494 | 499 | 114.7 |
| C | 13 | 61 | 3486 | 26.05 | 494 | 499 | 114.7 |
| D | 7 | 238 | 1298970 | 10913.02 | 492 | 478 | 119.0 |
| D | 1 | 52 | 366630 | 3077.28 | 492 | 478 | 119.0 |
| D | 1 | 20 | 19362 | 158.71 | 492 | 478 | 119.0 |
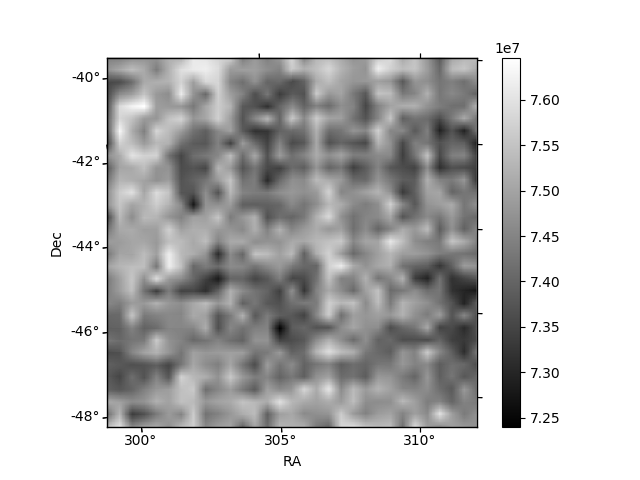
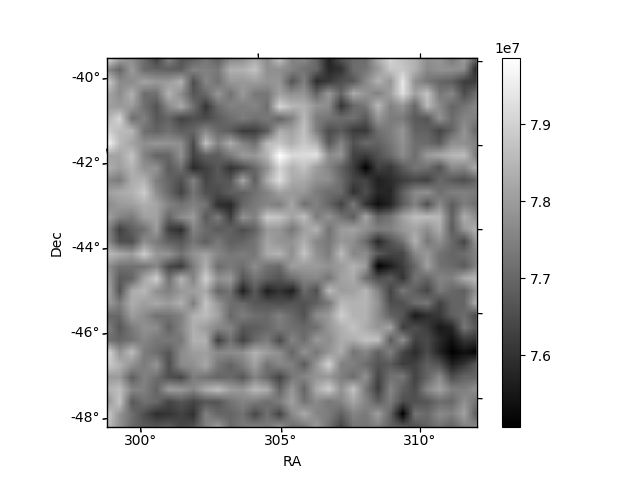
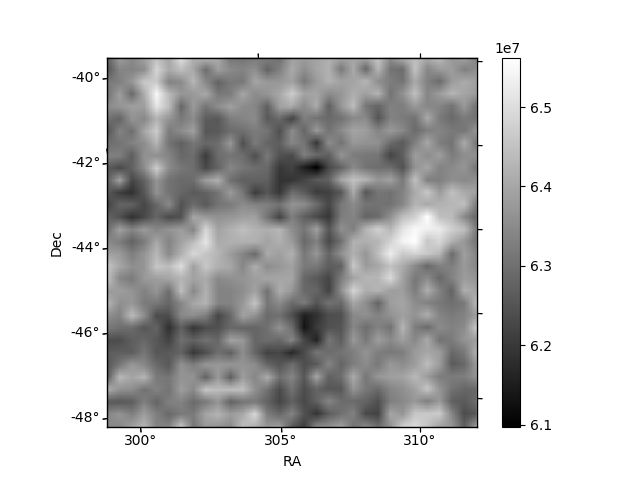
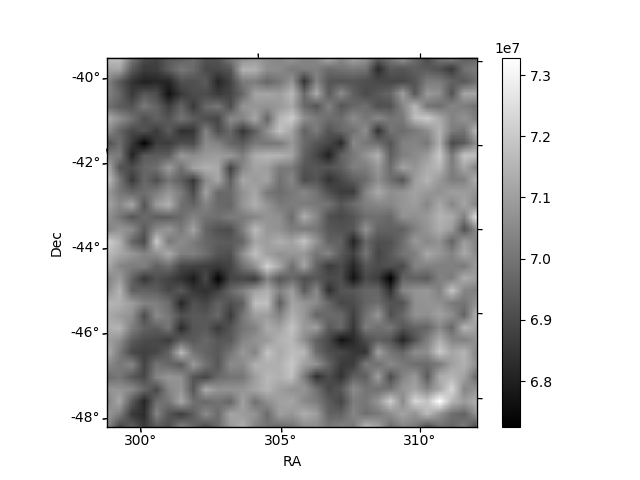
Histogram calculated using DETX and DETY for each event in the final _common_clean file
| Quadrant A | 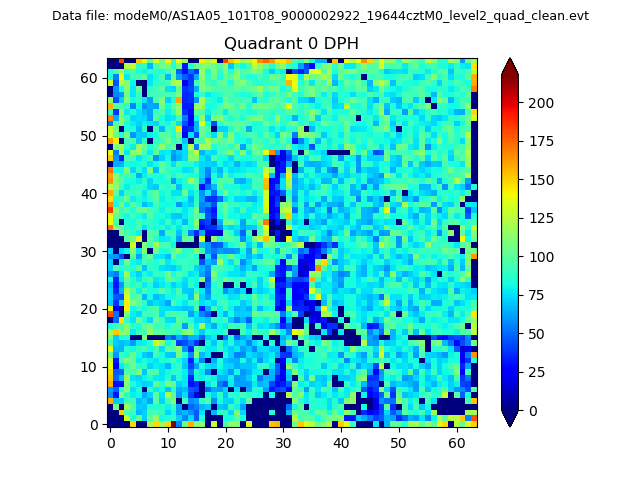 |
 |
Quadrant B |
|---|---|---|---|
| Quadrant D | 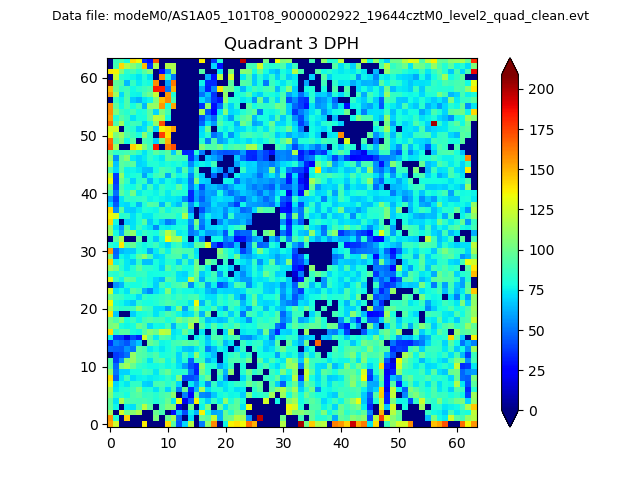 |
 |
Quadrant C |
| Plot type | Count rate plots | Images |
|---|---|---|
| Comparison with Poisson distribution Blue bars denote a histogram of data divided into 1 sec bins. Red curve is a Poisson curve with rate = median count rate of data. |
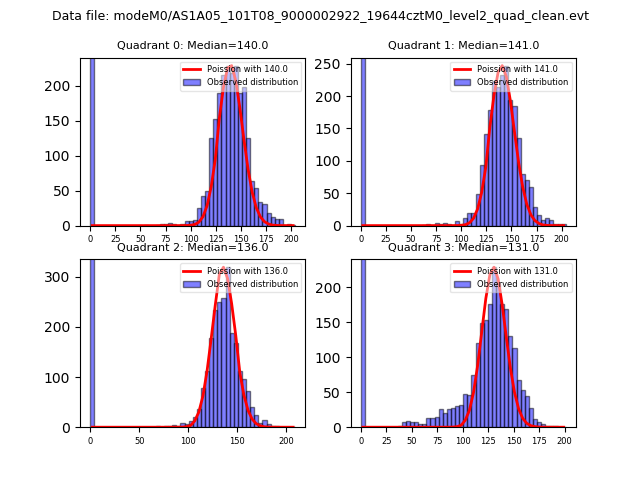 |
 |
| Quadrant-wise count rates Data is divided into 100 sec bins |
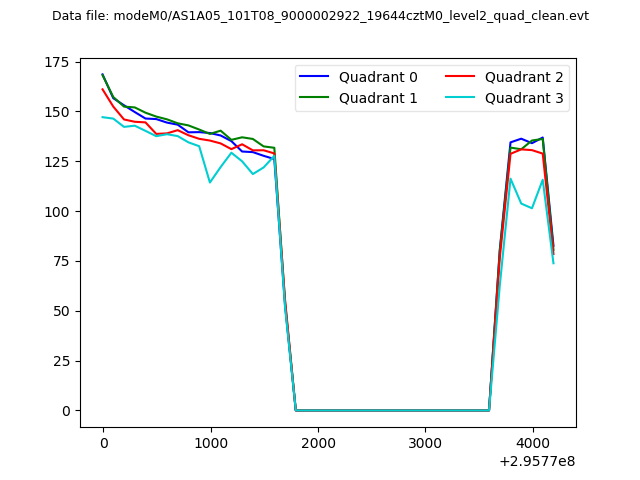 |
|
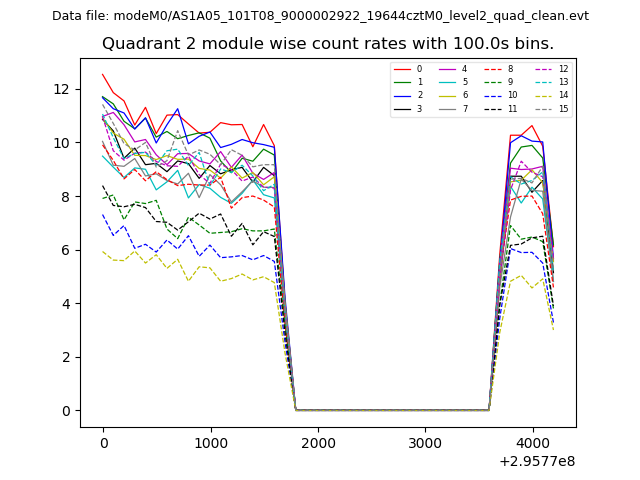
| Module-wise count rates for Quadrant A Data is divided into 100 sec bins |
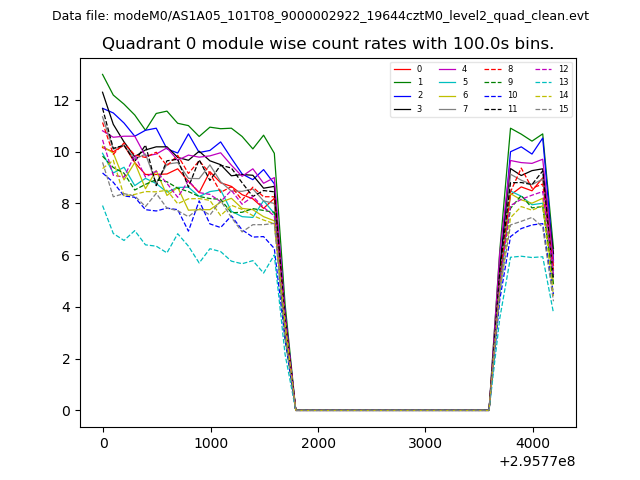 |
 |
| Module-wise count rates for Quadrant B Data is divided into 100 sec bins |
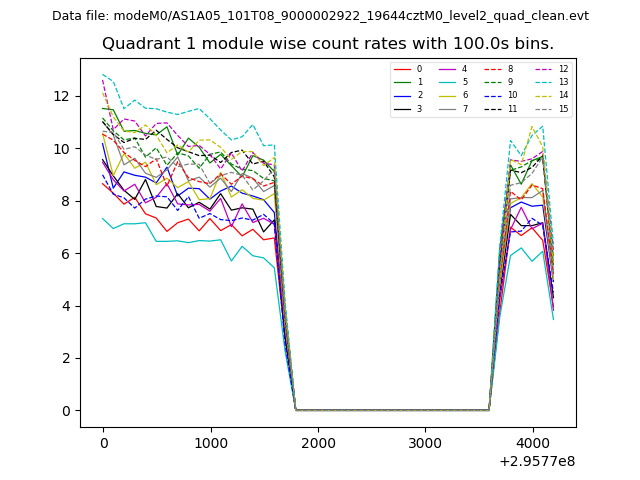 |
 |
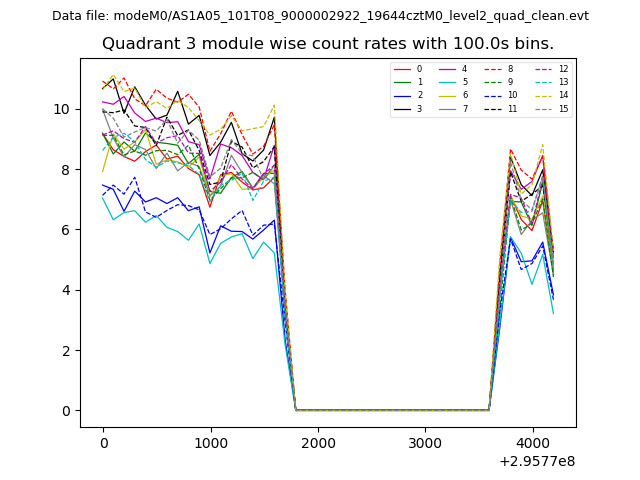
| Module-wise count rates for Quadrant C Data is divided into 100 sec bins |
 |
 |
| Module-wise count rates for Quadrant D Data is divided into 100 sec bins |
 |
 |
| Parameter | Plot |
|---|---|
| CZT HV Monitor | 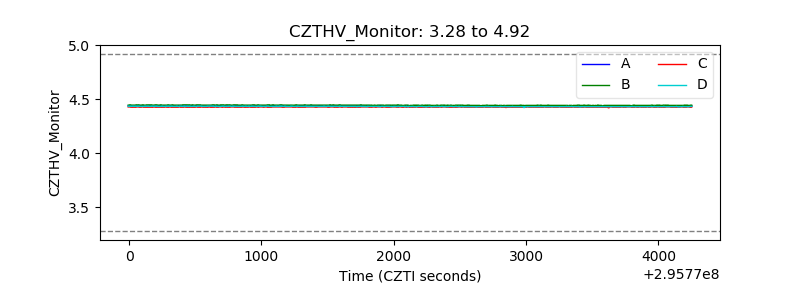 |
| D_VDD | 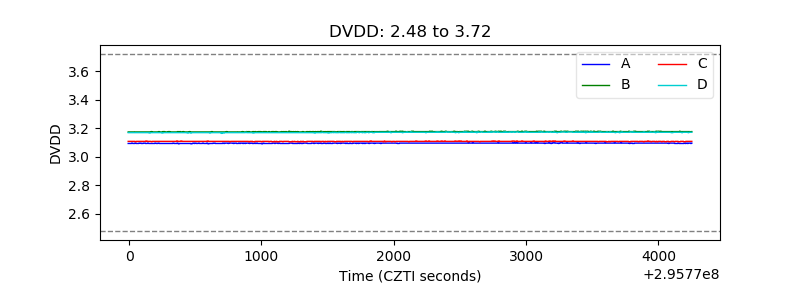 |
| Temperature 1 | 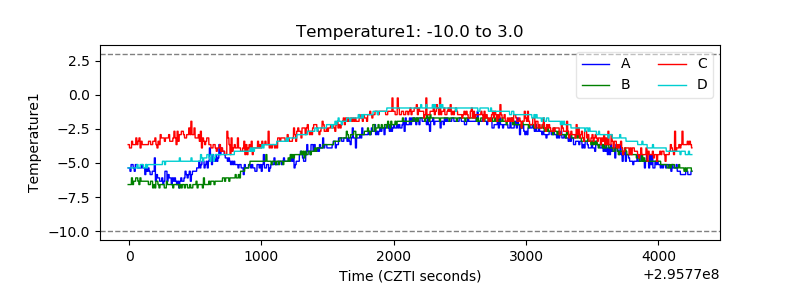 |
| Veto HV Monitor | 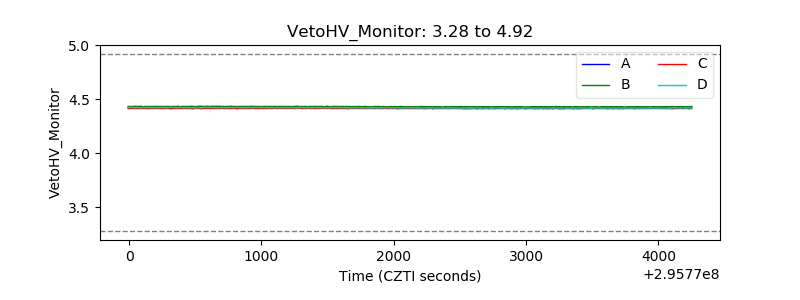 |
| Veto LLD |  |
| Alpha Counter | 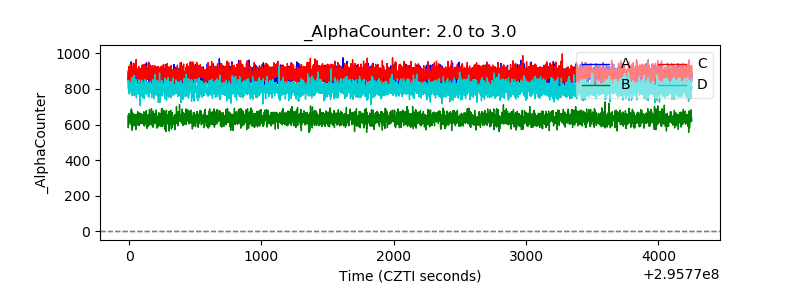 |
| _CPM_Rate | 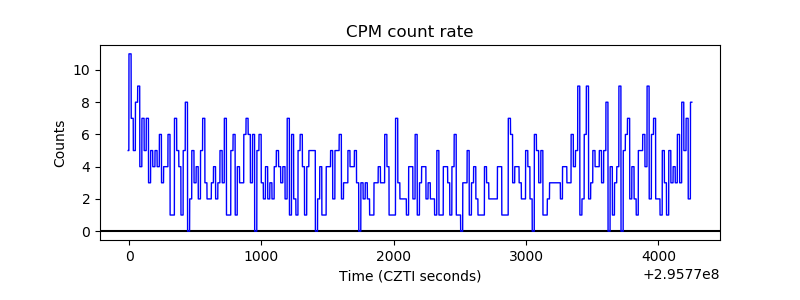 |
| CZT Counter | 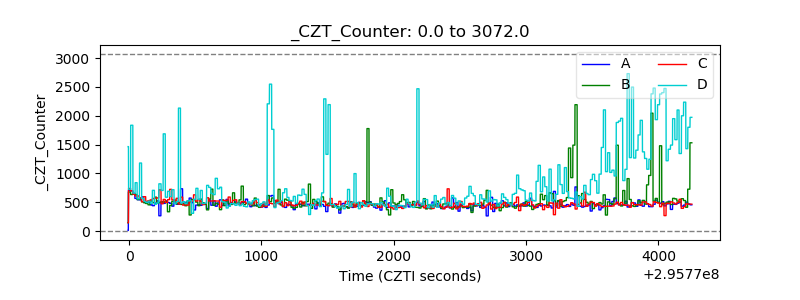 |
| +2.5 Volts monitor |  |
| +5 Volts monitor |  |
| _ROLL_ROT | 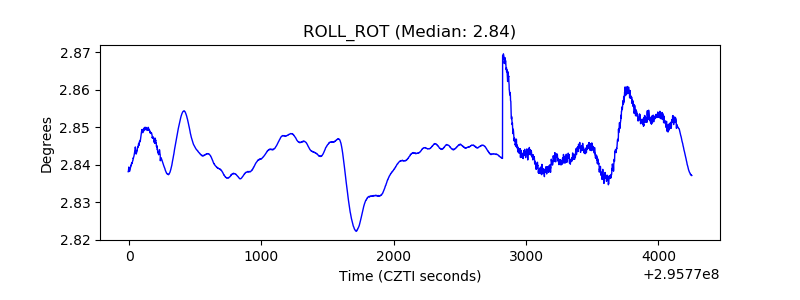 |
| _Roll_DEC | 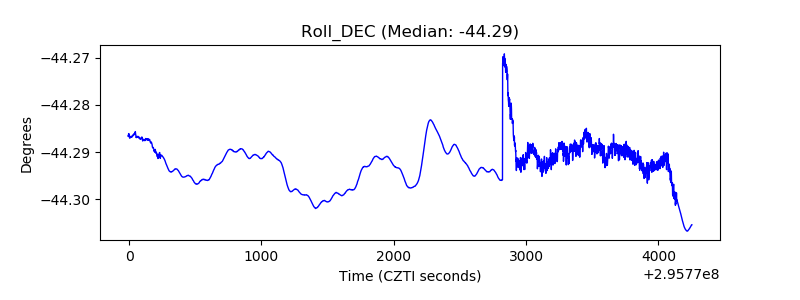 |
| _Roll_RA | 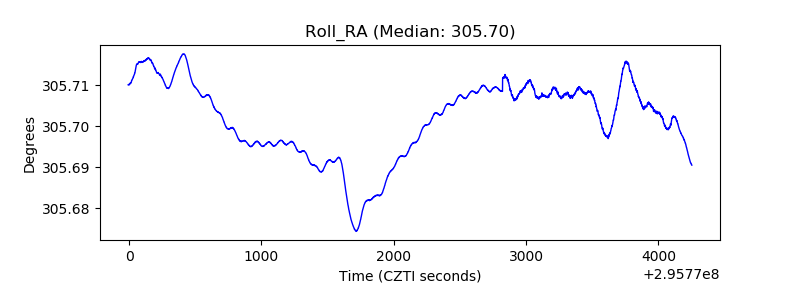 |
| Veto Counter | 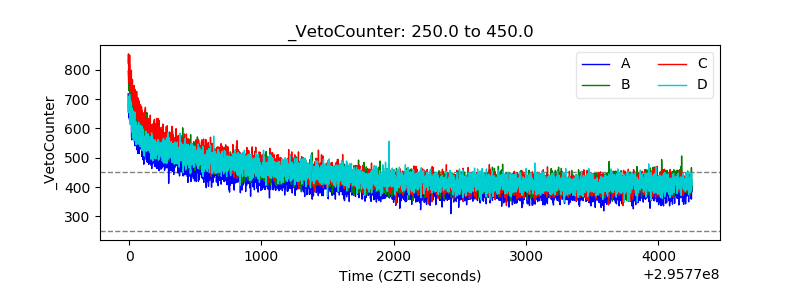 |