| Param | Original file | Final file |
|---|---|---|
| Filename | modeM0/AS1A05_101T10_9000002924cztM0_level2.fits | modeM0/AS1A05_101T10_9000002924cztM0_level2_quad_clean.evt |
| Size (bytes) | 97,755,840 | 120,458,880 |
| Size | 93.2 MB | 114.9 MB |
| Events in quadrant A | 593,574 | 764,239 |
| Events in quadrant B | 569,440 | 758,337 |
| Events in quadrant C | 587,178 | 740,506 |
| Events in quadrant D | 479,548 | 654,514 |
| Mode M9 | |||
|---|---|---|---|
| Quadrant | BADHDUFLAG | Total packets | Discarded packets |
| A | 0 | 16 | 0 |
| B | 0 | 16 | 0 |
| C | 0 | 16 | 0 |
| D | 0 | 16 | 0 |
| Mode M0 | |||
|---|---|---|---|
| Quadrant | BADHDUFLAG | Total packets | Discarded packets |
| A | 0 | 22529 | 0 |
| B | 0 | 22512 | 0 |
| C | 0 | 21585 | 0 |
| D | 0 | 34437 | 0 |
| Mode SS | |||
|---|---|---|---|
| Quadrant | BADHDUFLAG | Total packets | Discarded packets |
| A | 0 | 214 | 0 |
| B | 0 | 214 | 0 |
| C | 0 | 214 | 0 |
| D | 0 | 214 | 0 |
| Quadrant | Total seconds | Saturated seconds | Saturation percentage |
|---|---|---|---|
| A | 10555 | 235 | 2.226433% |
| B | 10555 | 214 | 2.027475% |
| C | 10555 | 252 | 2.387494% |
| D | 10555 | 1636 | 15.499763% |
Noise dominated data is calculated using 1-second bins in cleaned event files. If a bin has >2000 counts, and if more than 50% of those come from <1% of pixels, then it is considered to be noise-dominated and hence unusable.
| Quadrant | # 1 sec bins | Bins with >0 counts | Bins with >2000 counts | High rate bins dominated by noise | Noise dominated (total time) | Noise dominated (detector-on time) | Marked lightcurve |
|---|---|---|---|---|---|---|---|
| A | 12000 | 10547 | 0 | 0 | 0.00% | 0.00% |  |
| B | 12000 | 10553 | 0 | 0 | 0.00% | 0.00% | 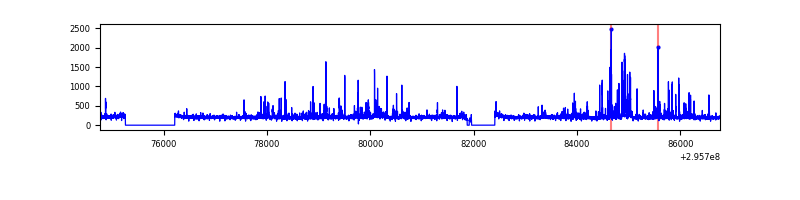 |
| C | 12000 | 10553 | 0 | 0 | 0.00% | 0.00% | 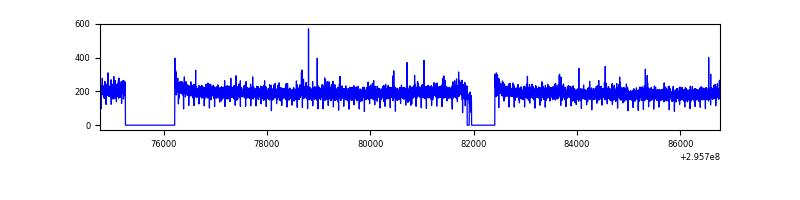 |
| D | 12000 | 10535 | 0 | 0 | 0.00% | 0.00% |  |
Top three noisy pixels from each quadrant. If the there are fewer than three noisy pixels in the level2.evt file, extra rows are filled as -1
| Pixel properties | Quadrant properties | ||||||
|---|---|---|---|---|---|---|---|
| Quadrant | DetID | PixID | Counts | Sigma | Mean | Median | Sigma |
| A | 0 | 29 | 547 | 9.96 | 155 | 146 | 40.3 |
| A | 7 | 110 | 494 | 8.64 | 155 | 146 | 40.3 |
| A | 9 | 19 | 435 | 7.18 | 155 | 146 | 40.3 |
| B | 5 | 255 | 430 | 8.77 | 151 | 144 | 32.6 |
| B | 2 | 9 | 413 | 8.25 | 151 | 144 | 32.6 |
| B | 5 | 232 | 376 | 7.11 | 151 | 144 | 32.6 |
| C | 1 | 81 | 452 | 7.48 | 154 | 145 | 41.0 |
| C | 1 | 80 | 447 | 7.36 | 154 | 145 | 41.0 |
| C | 12 | 241 | 438 | 7.14 | 154 | 145 | 41.0 |
| D | 4 | 246 | 371 | 6.47 | 136 | 123 | 38.3 |
| D | 3 | 31 | 358 | 6.13 | 136 | 123 | 38.3 |
| D | 15 | 46 | 351 | 5.95 | 136 | 123 | 38.3 |
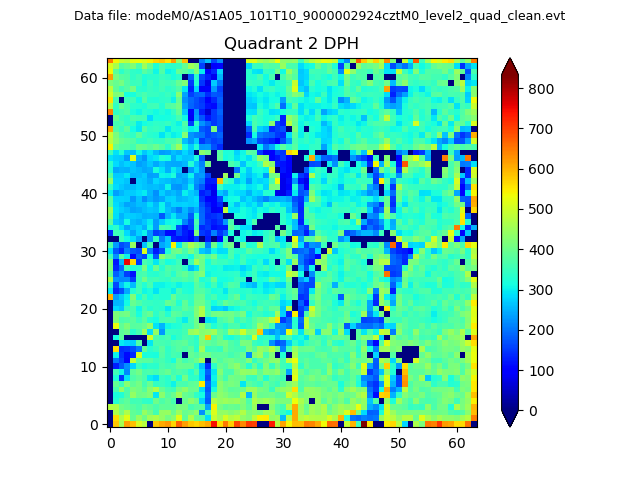
Histogram calculated using DETX and DETY for each event in the final _common_clean file
| Quadrant A | 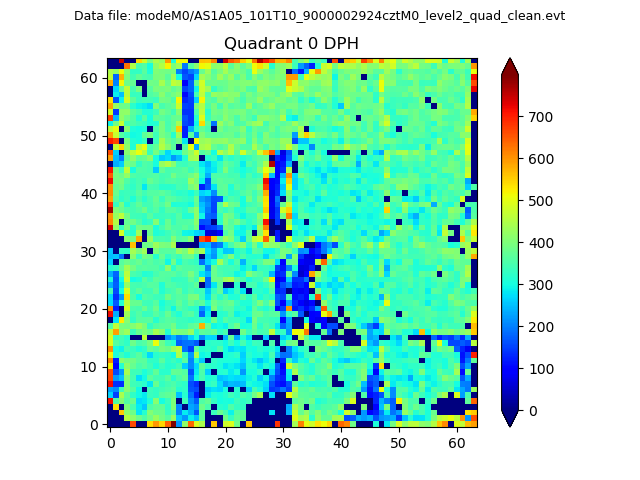 |
 |
Quadrant B |
|---|---|---|---|
| Quadrant D | 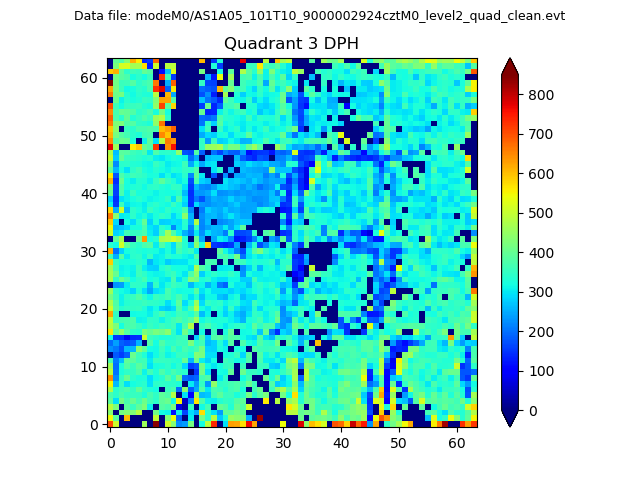 |
 |
Quadrant C |
| Plot type | Count rate plots | Images |
|---|---|---|
| Comparison with Poisson distribution Blue bars denote a histogram of data divided into 1 sec bins. Red curve is a Poisson curve with rate = median count rate of data. |
 |
 |
| Quadrant-wise count rates Data is divided into 100 sec bins |
 |
|
| Module-wise count rates for Quadrant A Data is divided into 100 sec bins |
 |
 |
| Module-wise count rates for Quadrant B Data is divided into 100 sec bins |
 |
 |
| Module-wise count rates for Quadrant C Data is divided into 100 sec bins |
 |
 |
| Module-wise count rates for Quadrant D Data is divided into 100 sec bins |
 |
 |
| Parameter | Plot |
|---|---|
| CZT HV Monitor |  |
| D_VDD | 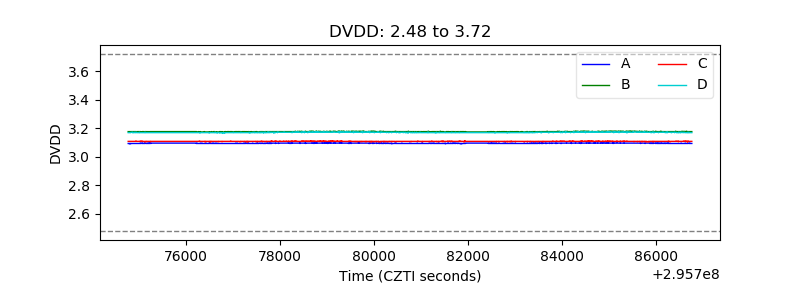 |
| Temperature 1 |  |
| Veto HV Monitor | 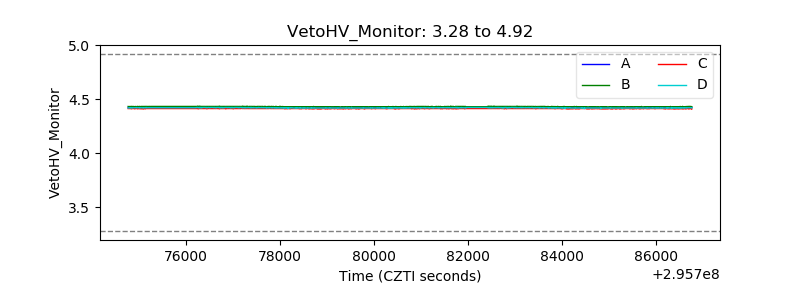 |
| Veto LLD |  |
| Alpha Counter | 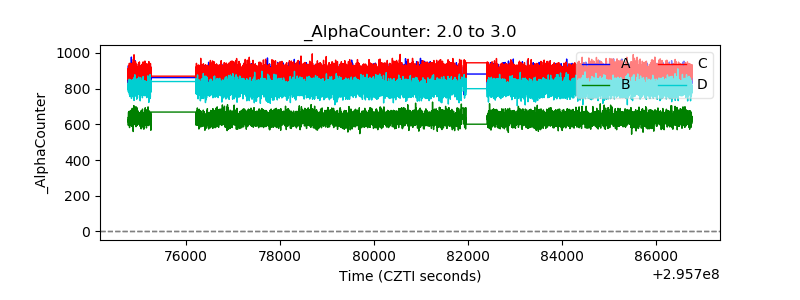 |
| _CPM_Rate | 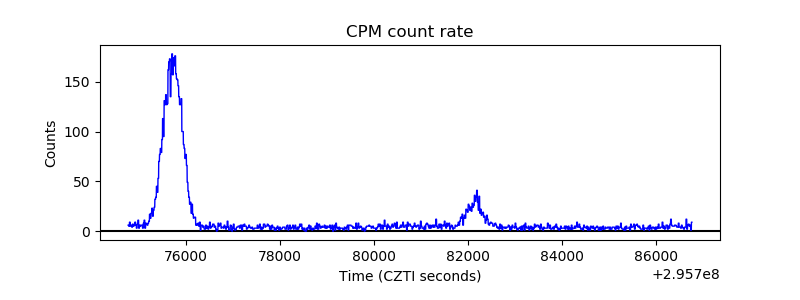 |
| CZT Counter |  |
| +2.5 Volts monitor | 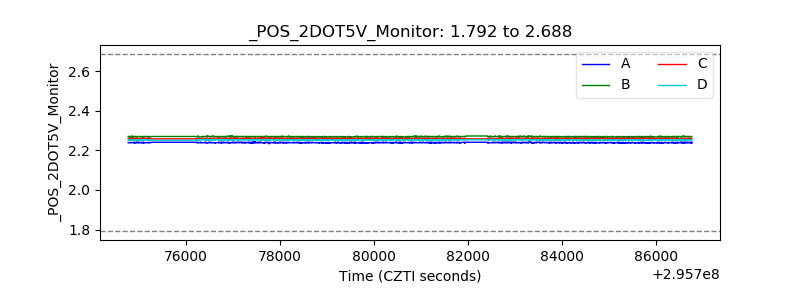 |
| +5 Volts monitor |  |
| _ROLL_ROT | 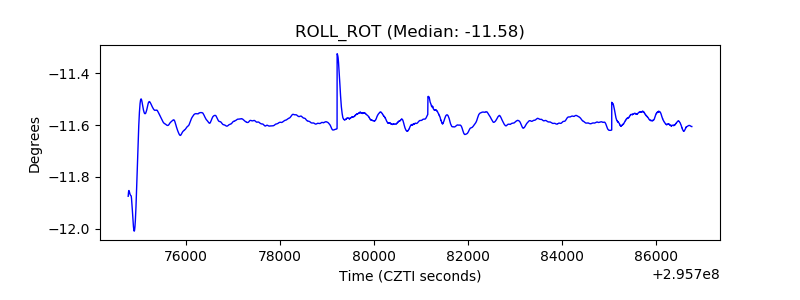 |
| _Roll_DEC |  |
| _Roll_RA |  |
| Veto Counter | 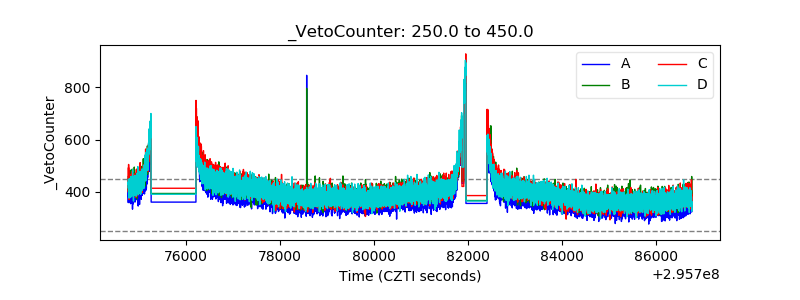 |