| Param | Original file | Final file |
|---|---|---|
| Filename | modeM0/AS1A05_101T10_9000002924_19644cztM0_level2.evt | modeM0/AS1A05_101T10_9000002924_19644cztM0_level2_quad_clean.evt |
| Size (bytes) | 189,734,400 | 35,349,120 |
| Size | 180.9 MB | 33.7 MB |
| Events in quadrant A | 950,049 | 248,132 |
| Events in quadrant B | 913,867 | 254,427 |
| Events in quadrant C | 930,944 | 242,038 |
| Events in quadrant D | 2,823,379 | 190,195 |
| Mode M9 | |||
|---|---|---|---|
| Quadrant | BADHDUFLAG | Total packets | Discarded packets |
| A | 0 | 10 | 0 |
| B | 0 | 10 | 0 |
| C | 0 | 10 | 0 |
| D | 0 | 10 | 0 |
| Mode M0 | |||
|---|---|---|---|
| Quadrant | BADHDUFLAG | Total packets | Discarded packets |
| A | 0 | 4049 | 1 |
| B | 0 | 3882 | 1 |
| C | 0 | 3891 | 1 |
| D | 0 | 9671 | 1 |
| Mode SS | |||
|---|---|---|---|
| Quadrant | BADHDUFLAG | Total packets | Discarded packets |
| A | 0 | 38 | 0 |
| B | 0 | 38 | 0 |
| C | 0 | 38 | 0 |
| D | 0 | 38 | 0 |
| Quadrant | Total seconds | Saturated seconds | Saturation percentage |
|---|---|---|---|
| A | 1849 | 42 | 2.271498% |
| B | 1849 | 30 | 1.622499% |
| C | 1849 | 68 | 3.677664% |
| D | 1849 | 802 | 43.374797% |
Noise dominated data is calculated using 1-second bins in cleaned event files. If a bin has >2000 counts, and if more than 50% of those come from <1% of pixels, then it is considered to be noise-dominated and hence unusable.
| Quadrant | # 1 sec bins | Bins with >0 counts | Bins with >2000 counts | High rate bins dominated by noise | Noise dominated (total time) | Noise dominated (detector-on time) | Marked lightcurve |
|---|---|---|---|---|---|---|---|
| A | 2804 | 1850 | 0 | 0 | 0.00% | 0.00% |  |
| B | 2804 | 1850 | 0 | 0 | 0.00% | 0.00% | 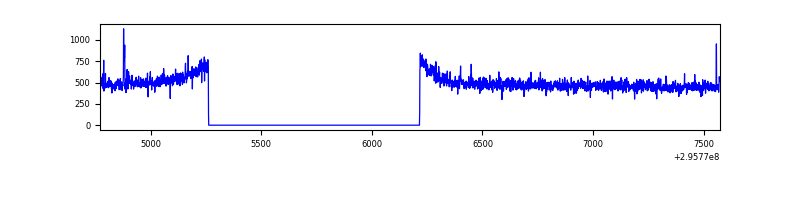 |
| C | 2804 | 1850 | 0 | 0 | 0.00% | 0.00% | 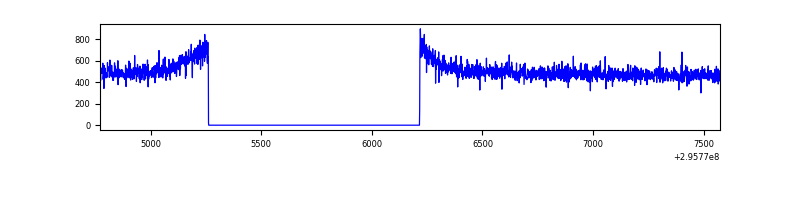 |
| D | 2804 | 1849 | 621 | 621 | 22.15% | 33.59% | 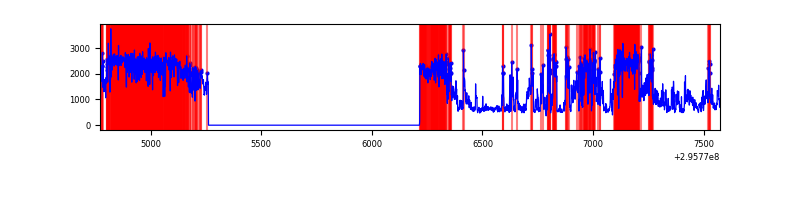 |
Top three noisy pixels from each quadrant. If the there are fewer than three noisy pixels in the level2.evt file, extra rows are filled as -1
| Pixel properties | Quadrant properties | ||||||
|---|---|---|---|---|---|---|---|
| Quadrant | DetID | PixID | Counts | Sigma | Mean | Median | Sigma |
| A | 9 | 143 | 51204 | 1061.86 | 232 | 226 | 48.0 |
| A | 4 | 2 | 5239 | 104.42 | 232 | 226 | 48.0 |
| A | 0 | 226 | 2102 | 39.08 | 232 | 226 | 48.0 |
| B | 12 | 111 | 5281 | 111.87 | 231 | 226 | 45.2 |
| B | 11 | 111 | 4684 | 98.65 | 231 | 226 | 45.2 |
| B | 14 | 111 | 4099 | 85.71 | 231 | 226 | 45.2 |
| C | 14 | 238 | 35297 | 640.45 | 229 | 229 | 54.8 |
| C | 3 | 233 | 1835 | 29.33 | 229 | 229 | 54.8 |
| C | 13 | 61 | 1535 | 23.85 | 229 | 229 | 54.8 |
| D | 7 | 238 | 1851991 | 39210.81 | 192 | 186 | 47.2 |
| D | 1 | 52 | 241410 | 5107.77 | 192 | 186 | 47.2 |
| D | 2 | 234 | 4457 | 90.44 | 192 | 186 | 47.2 |
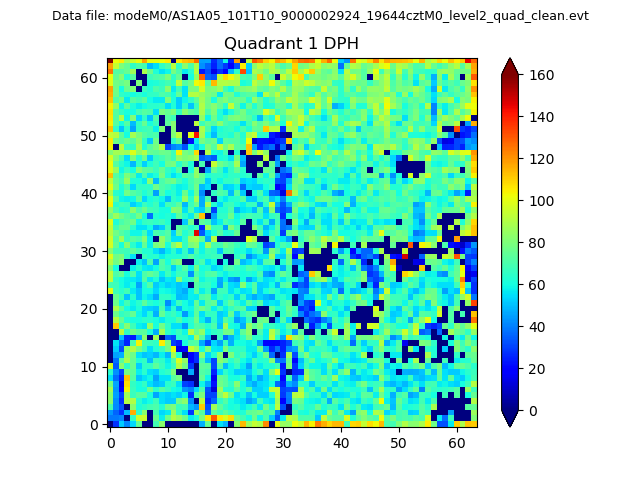
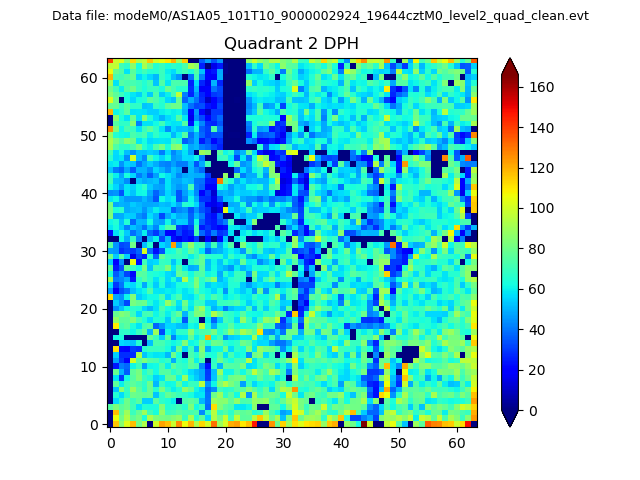
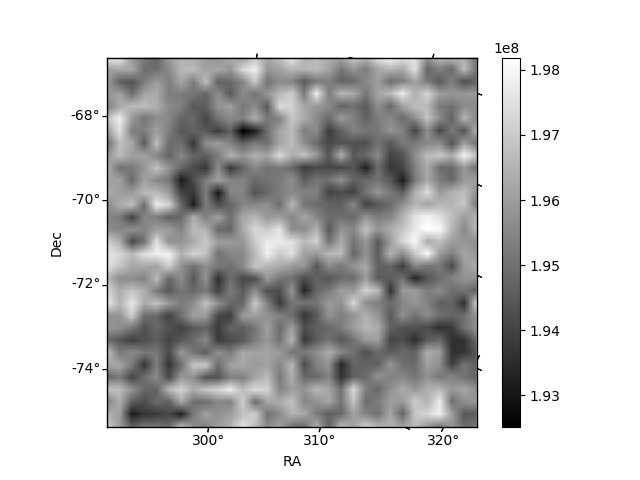
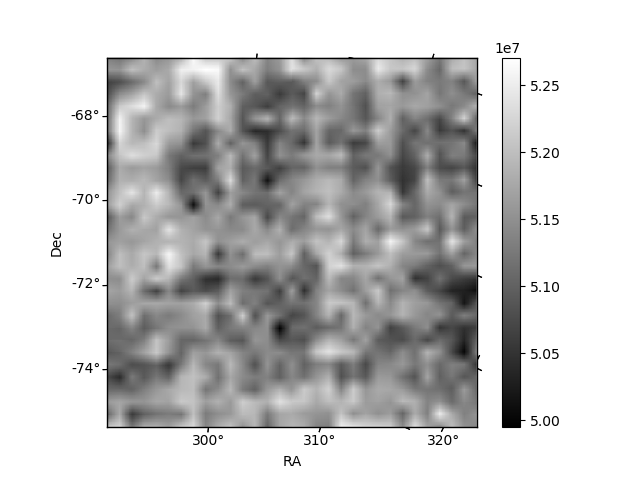
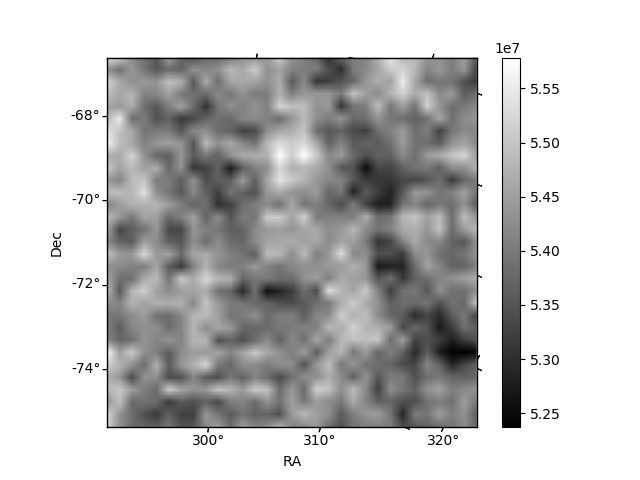
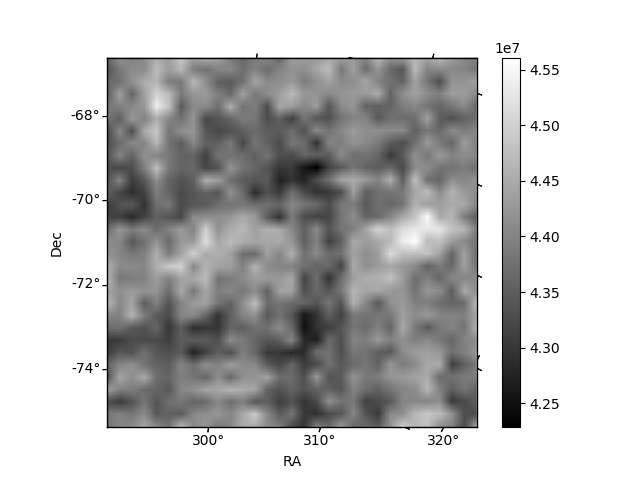
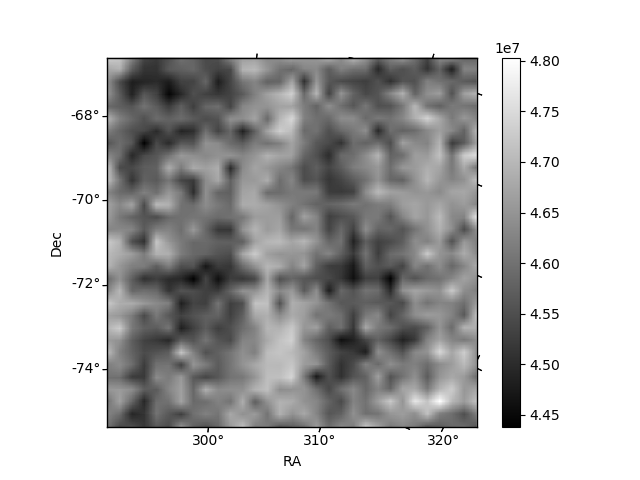
Histogram calculated using DETX and DETY for each event in the final _common_clean file
| Quadrant A | 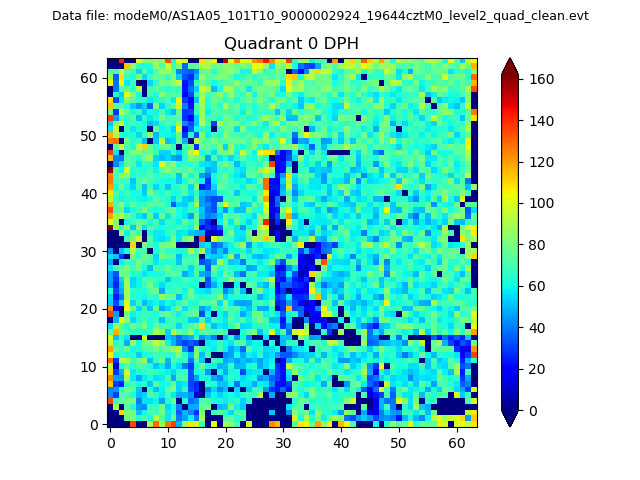 |
 |
Quadrant B |
|---|---|---|---|
| Quadrant D | 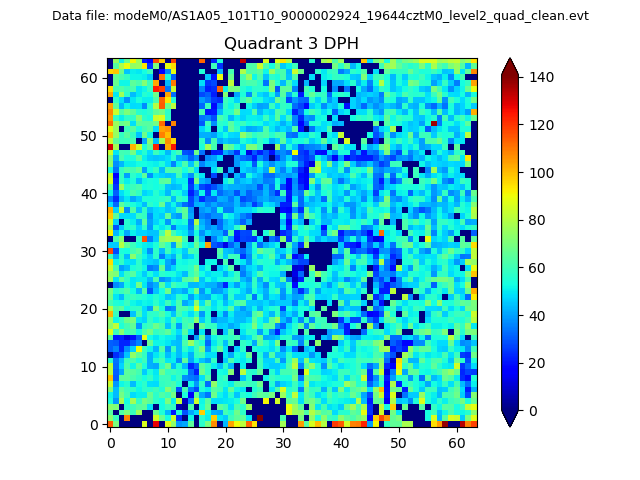 |
 |
Quadrant C |
| Plot type | Count rate plots | Images |
|---|---|---|
| Comparison with Poisson distribution Blue bars denote a histogram of data divided into 1 sec bins. Red curve is a Poisson curve with rate = median count rate of data. |
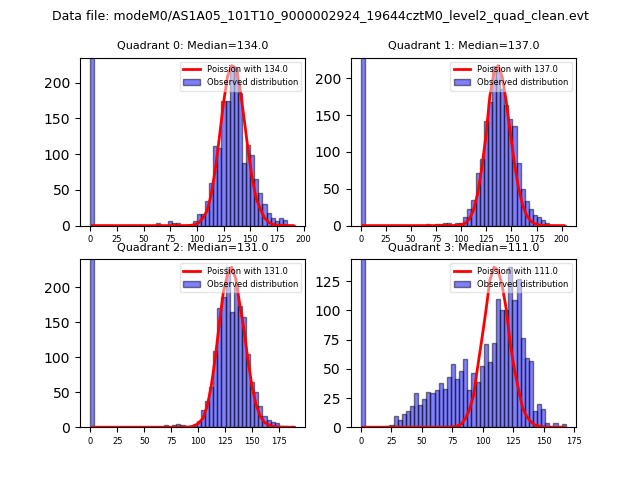 |
 |
| Quadrant-wise count rates Data is divided into 100 sec bins |
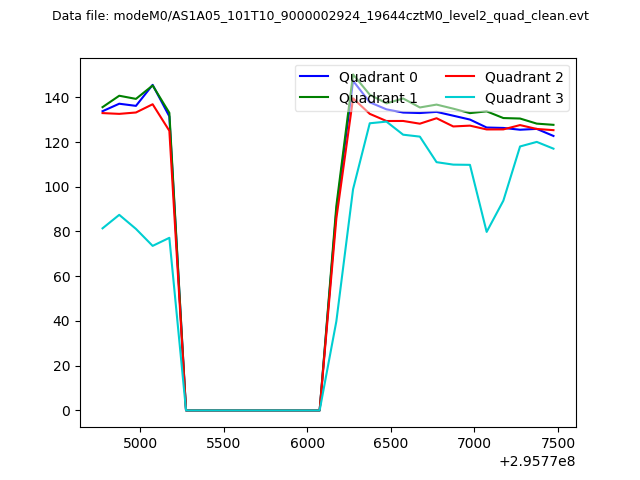 |
|
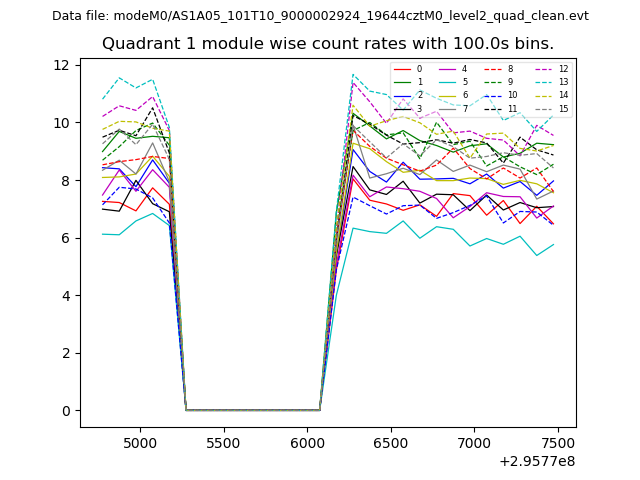
| Module-wise count rates for Quadrant A Data is divided into 100 sec bins |
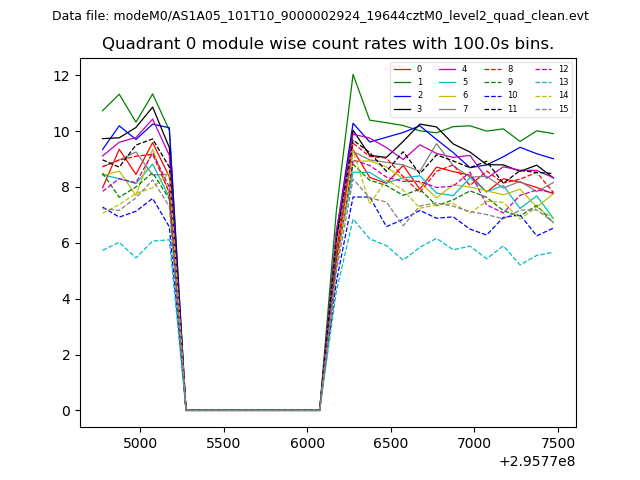 |
 |
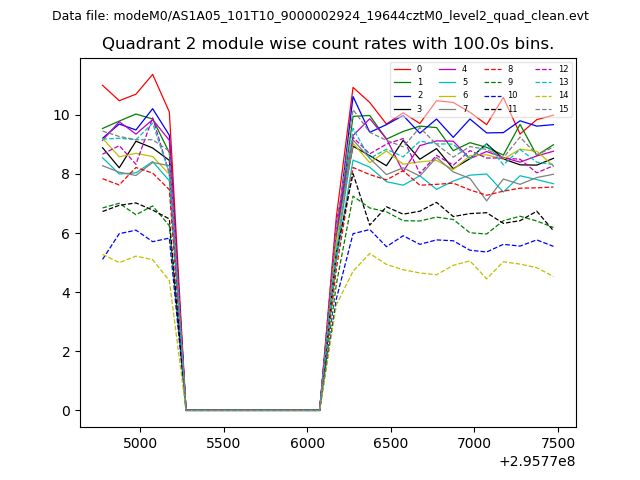
| Module-wise count rates for Quadrant B Data is divided into 100 sec bins |
 |
 |
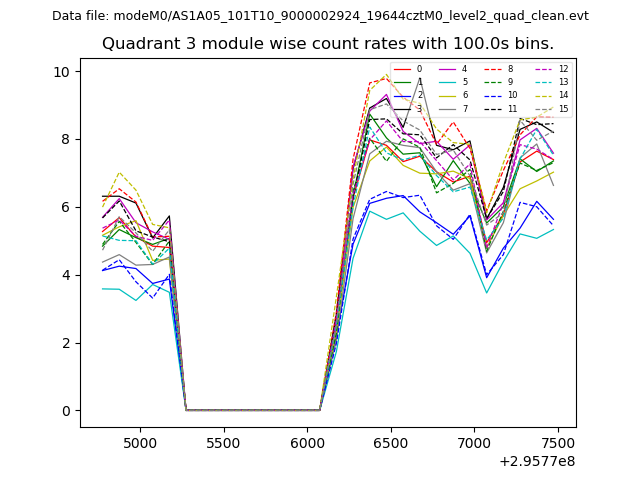
| Module-wise count rates for Quadrant C Data is divided into 100 sec bins |
 |
 |
| Module-wise count rates for Quadrant D Data is divided into 100 sec bins |
 |
 |
| Parameter | Plot |
|---|---|
| CZT HV Monitor | 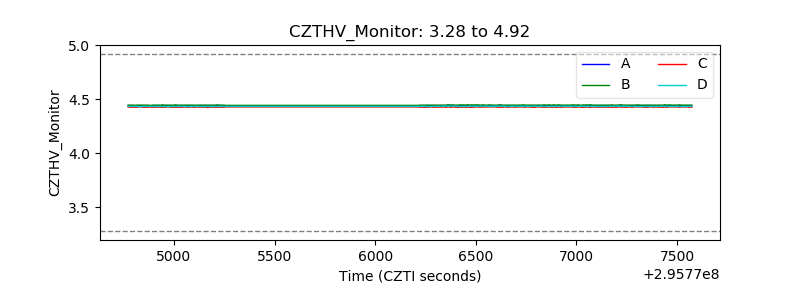 |
| D_VDD | 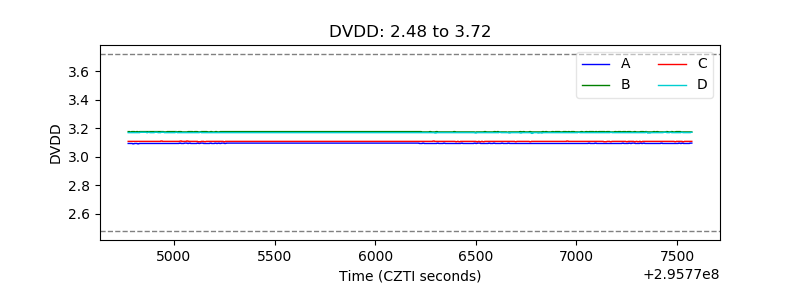 |
| Temperature 1 | 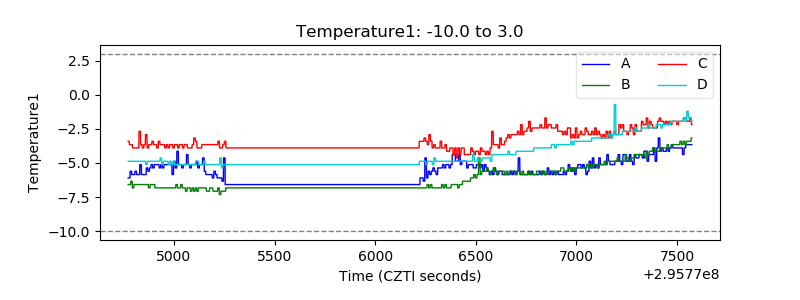 |
| Veto HV Monitor | 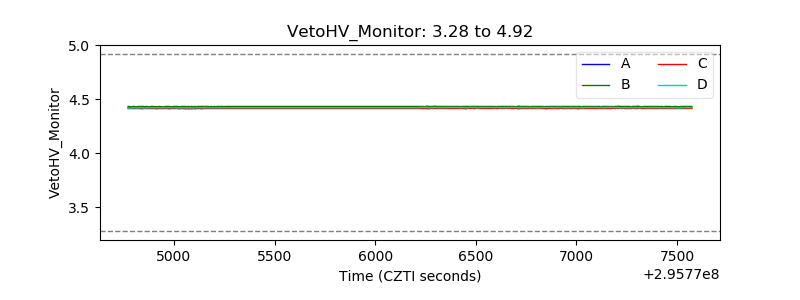 |
| Veto LLD | 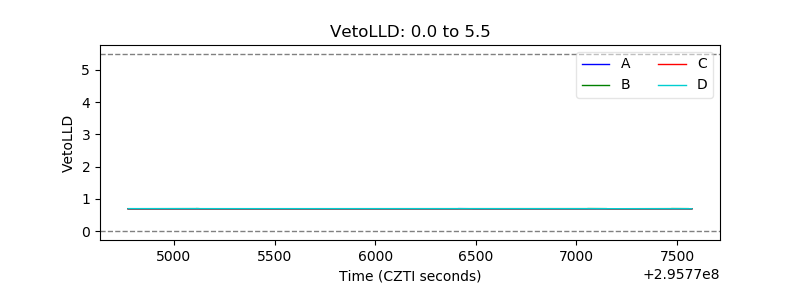 |
| Alpha Counter | 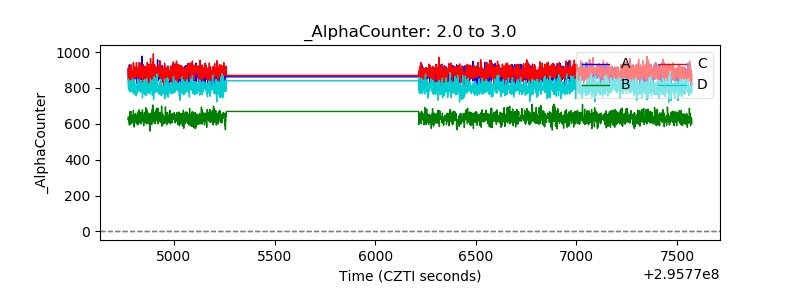 |
| _CPM_Rate | 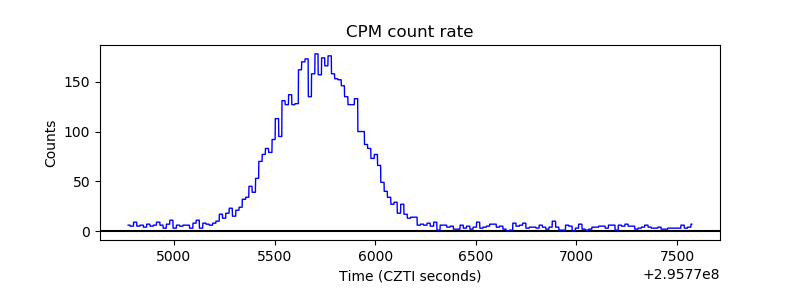 |
| CZT Counter | 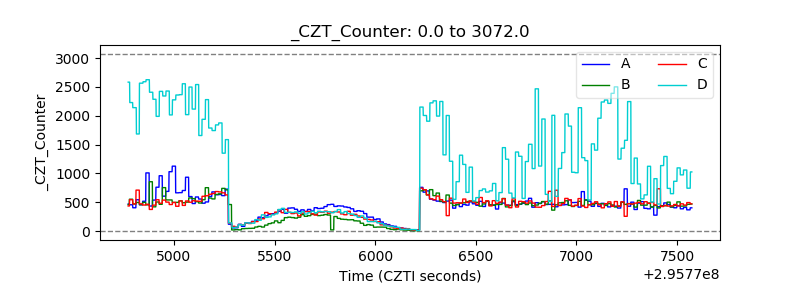 |
| +2.5 Volts monitor |  |
| +5 Volts monitor |  |
| _ROLL_ROT | 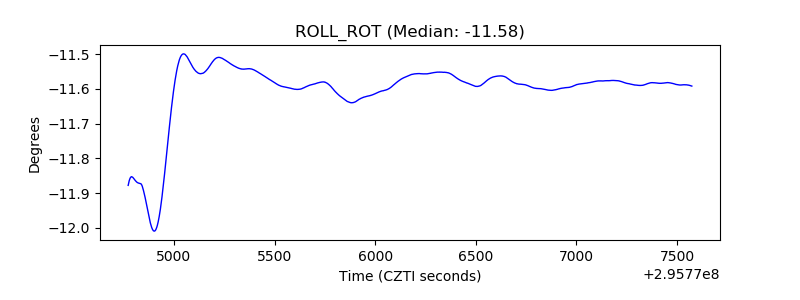 |
| _Roll_DEC | 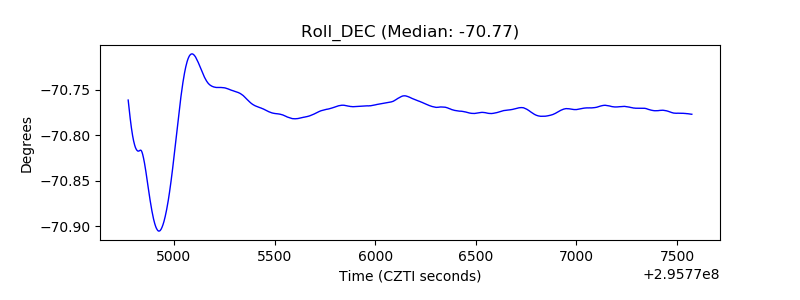 |
| _Roll_RA | 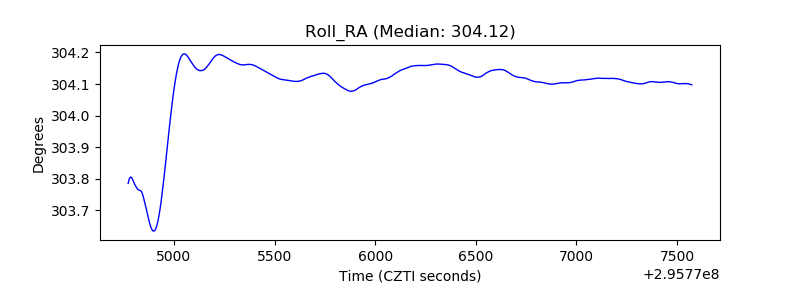 |
| Veto Counter | 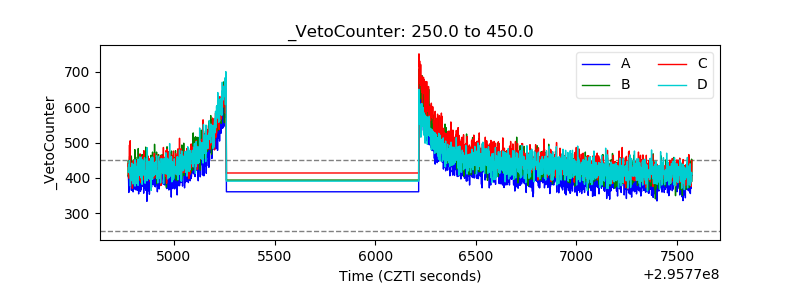 |