| Param | Original file | Final file |
|---|---|---|
| Filename | modeM0/AS1A05_101T10_9000002924_19645cztM0_level2.evt | modeM0/AS1A05_101T10_9000002924_19645cztM0_level2_quad_clean.evt |
| Size (bytes) | 546,157,440 | 133,845,120 |
| Size | 520.9 MB | 127.6 MB |
| Events in quadrant A | 3,546,081 | 902,175 |
| Events in quadrant B | 3,495,590 | 914,813 |
| Events in quadrant C | 3,332,482 | 896,129 |
| Events in quadrant D | 5,677,090 | 838,733 |
| Mode M9 | |||
|---|---|---|---|
| Quadrant | BADHDUFLAG | Total packets | Discarded packets |
| A | 0 | 6 | 0 |
| B | 0 | 6 | 0 |
| C | 0 | 6 | 0 |
| D | 0 | 6 | 0 |
| Mode M0 | |||
|---|---|---|---|
| Quadrant | BADHDUFLAG | Total packets | Discarded packets |
| A | 0 | 15376 | 1 |
| B | 0 | 15131 | 1 |
| C | 0 | 14709 | 1 |
| D | 0 | 21769 | 1 |
| Mode SS | |||
|---|---|---|---|
| Quadrant | BADHDUFLAG | Total packets | Discarded packets |
| A | 0 | 146 | 0 |
| B | 0 | 146 | 0 |
| C | 0 | 146 | 0 |
| D | 0 | 146 | 0 |
| Quadrant | Total seconds | Saturated seconds | Saturation percentage |
|---|---|---|---|
| A | 7211 | 189 | 2.620996% |
| B | 7212 | 167 | 2.315585% |
| C | 7212 | 183 | 2.537438% |
| D | 7212 | 778 | 10.787576% |
Noise dominated data is calculated using 1-second bins in cleaned event files. If a bin has >2000 counts, and if more than 50% of those come from <1% of pixels, then it is considered to be noise-dominated and hence unusable.
| Quadrant | # 1 sec bins | Bins with >0 counts | Bins with >2000 counts | High rate bins dominated by noise | Noise dominated (total time) | Noise dominated (detector-on time) | Marked lightcurve |
|---|---|---|---|---|---|---|---|
| A | 7701 | 7211 | 39 | 39 | 0.51% | 0.54% |  |
| B | 7702 | 7212 | 13 | 13 | 0.17% | 0.18% |  |
| C | 7702 | 7212 | 0 | 0 | 0.00% | 0.00% | 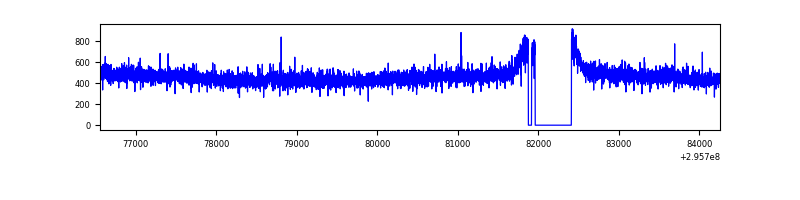 |
| D | 7702 | 7212 | 593 | 593 | 7.70% | 8.22% | 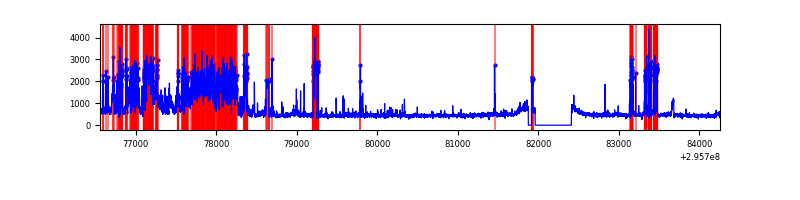 |
Top three noisy pixels from each quadrant. If the there are fewer than three noisy pixels in the level2.evt file, extra rows are filled as -1
| Pixel properties | Quadrant properties | ||||||
|---|---|---|---|---|---|---|---|
| Quadrant | DetID | PixID | Counts | Sigma | Mean | Median | Sigma |
| A | 9 | 143 | 164745 | 971.22 | 842 | 823 | 168.8 |
| A | 5 | 16 | 128768 | 758.06 | 842 | 823 | 168.8 |
| A | 4 | 2 | 7606 | 40.19 | 842 | 823 | 168.8 |
| B | 3 | 112 | 97451 | 615.96 | 837 | 815 | 156.9 |
| B | 4 | 216 | 33191 | 206.37 | 837 | 815 | 156.9 |
| B | 0 | 198 | 23483 | 144.49 | 837 | 815 | 156.9 |
| C | 14 | 238 | 127912 | 676.61 | 818 | 821 | 187.8 |
| C | 3 | 233 | 11784 | 58.36 | 818 | 821 | 187.8 |
| C | 13 | 61 | 5651 | 25.71 | 818 | 821 | 187.8 |
| D | 7 | 238 | 1344123 | 6925.98 | 804 | 779 | 194.0 |
| D | 1 | 52 | 1144324 | 5895.86 | 804 | 779 | 194.0 |
| D | 2 | 16 | 59503 | 302.77 | 804 | 779 | 194.0 |
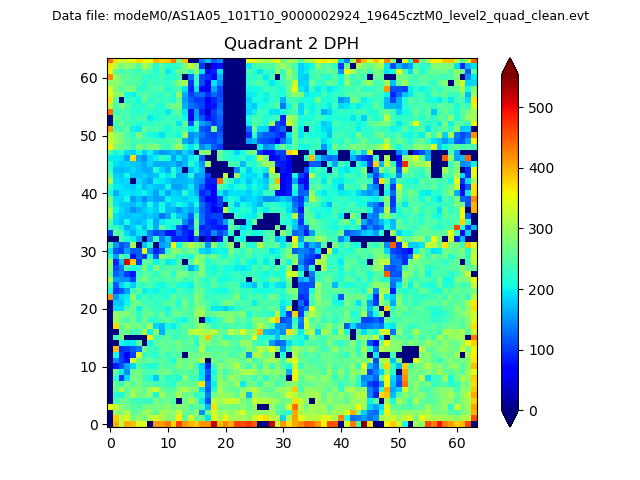
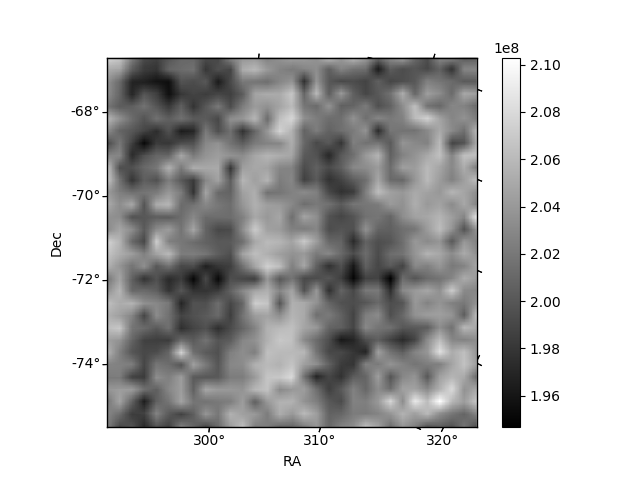
Histogram calculated using DETX and DETY for each event in the final _common_clean file
| Quadrant A | 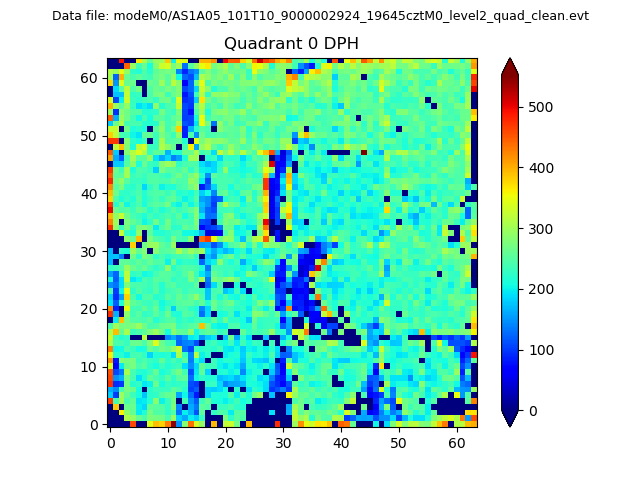 |
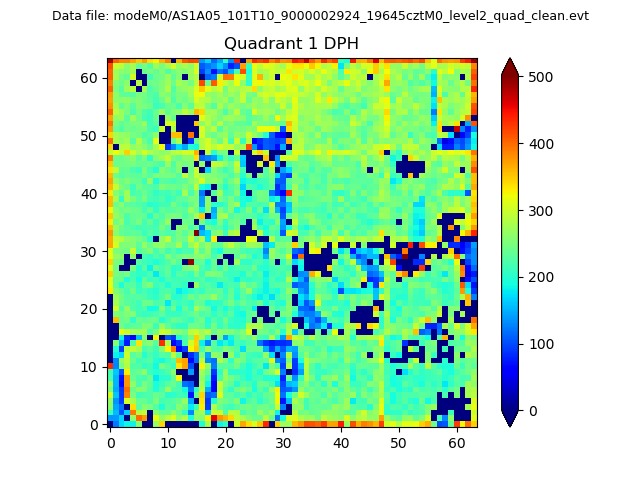 |
Quadrant B |
|---|---|---|---|
| Quadrant D | 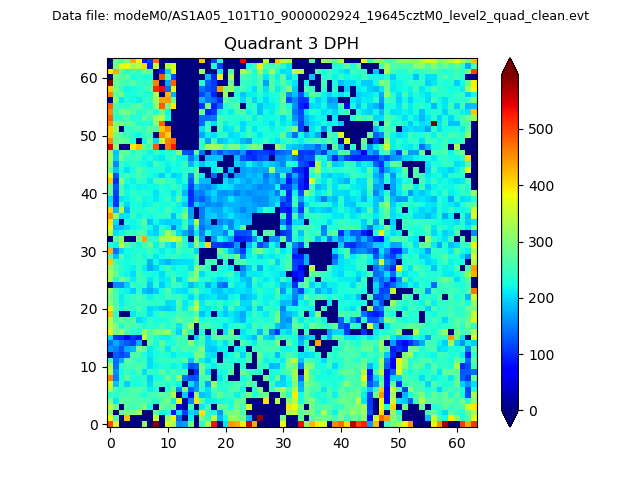 |
 |
Quadrant C |
| Plot type | Count rate plots | Images |
|---|---|---|
| Comparison with Poisson distribution Blue bars denote a histogram of data divided into 1 sec bins. Red curve is a Poisson curve with rate = median count rate of data. |
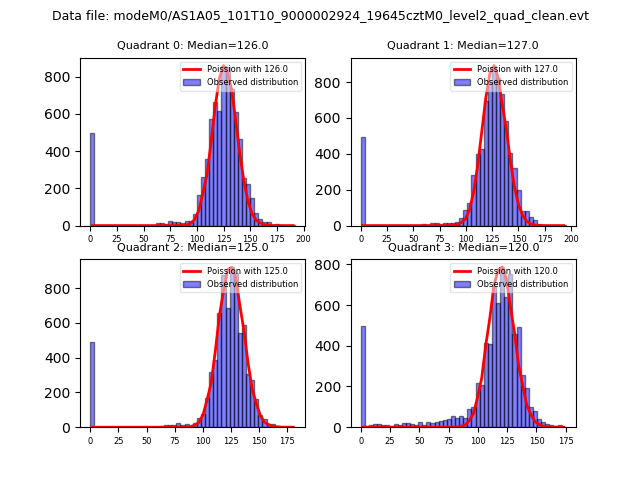 |
 |
| Quadrant-wise count rates Data is divided into 100 sec bins |
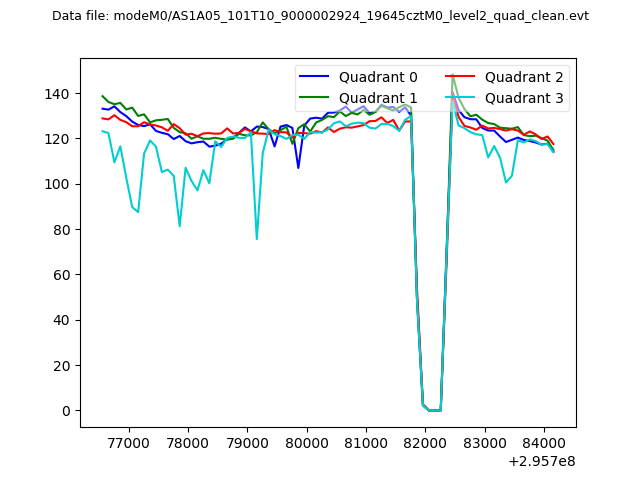 |
|
| Module-wise count rates for Quadrant A Data is divided into 100 sec bins |
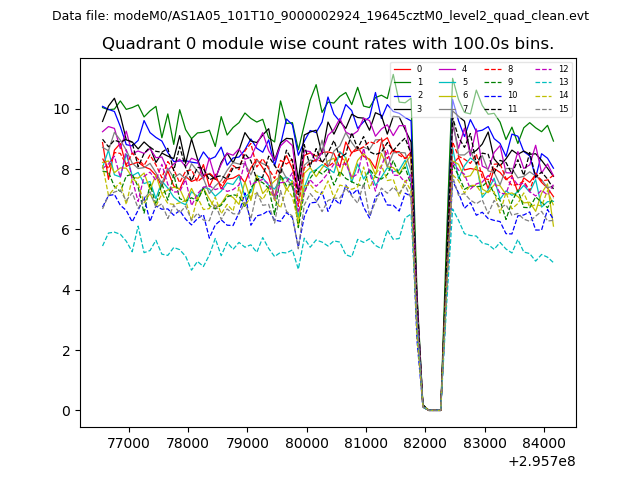 |
 |
| Module-wise count rates for Quadrant B Data is divided into 100 sec bins |
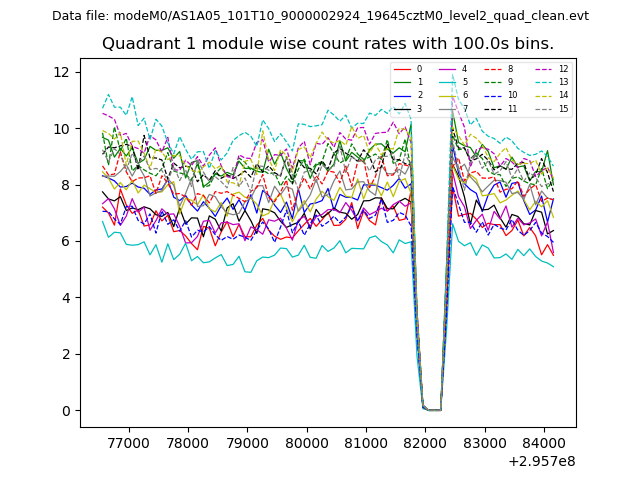 |
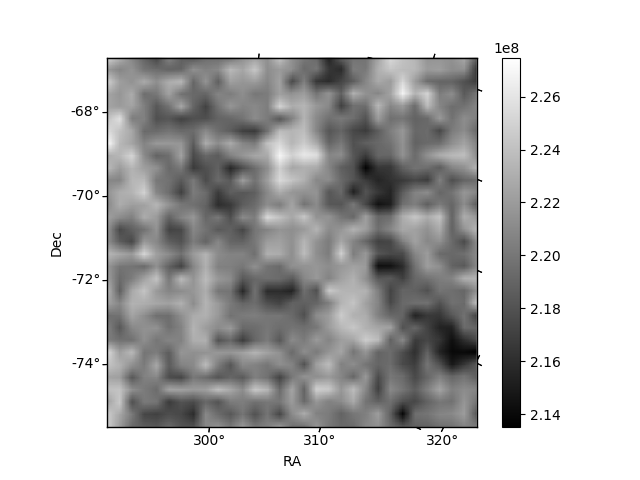 |
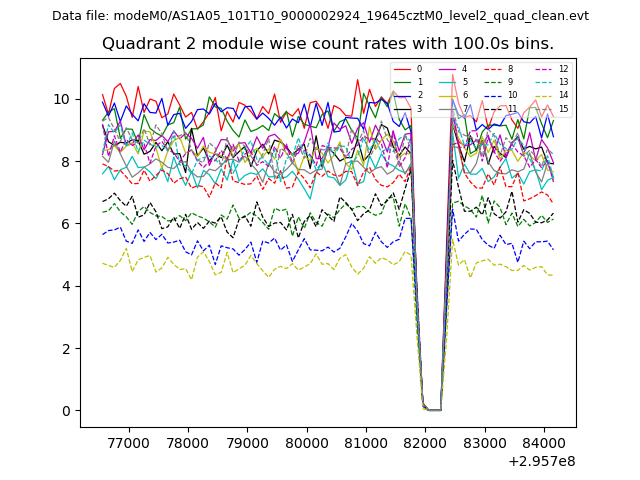
| Module-wise count rates for Quadrant C Data is divided into 100 sec bins |
 |
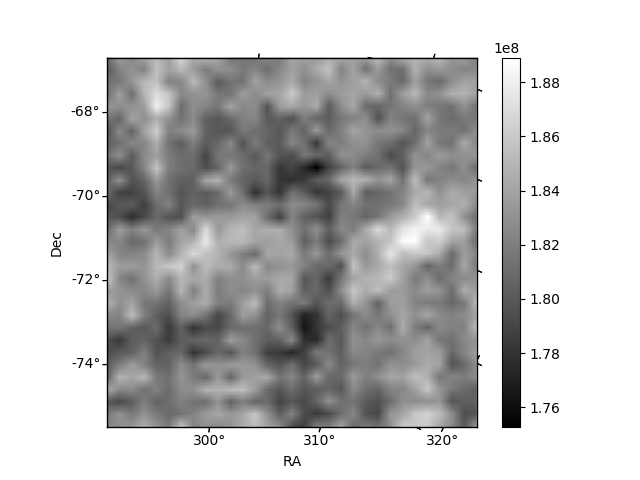 |
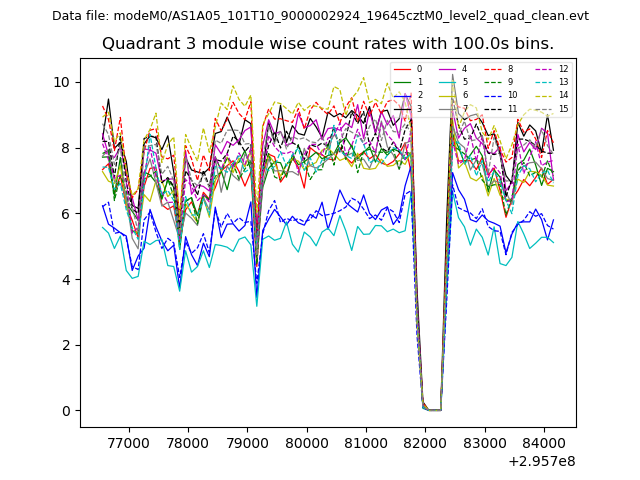
| Module-wise count rates for Quadrant D Data is divided into 100 sec bins |
 |
 |
| Parameter | Plot |
|---|---|
| CZT HV Monitor | 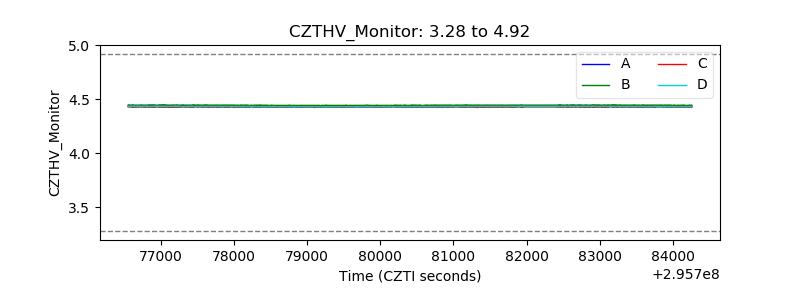 |
| D_VDD |  |
| Temperature 1 | 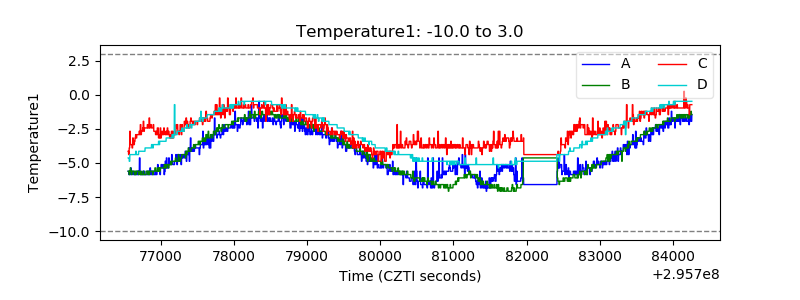 |
| Veto HV Monitor | 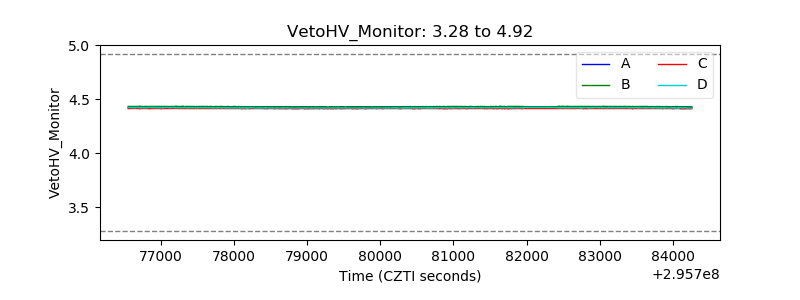 |
| Veto LLD | 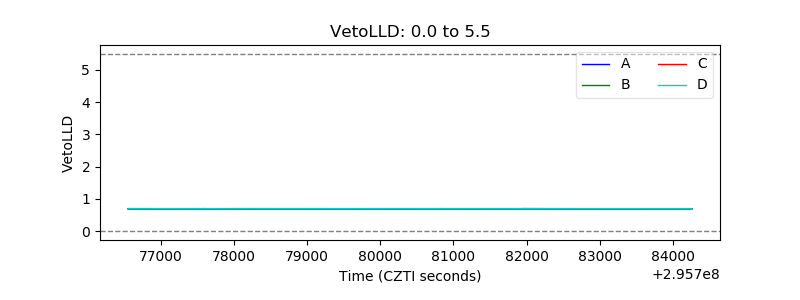 |
| Alpha Counter | 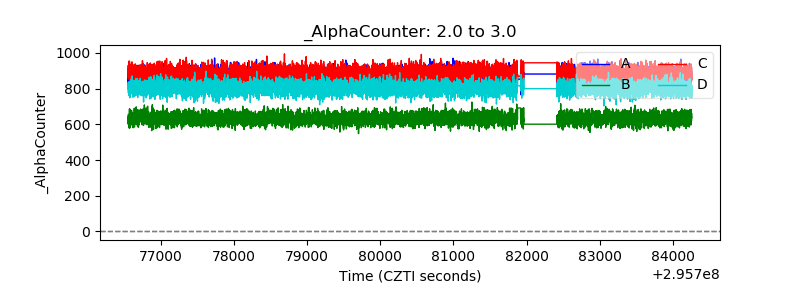 |
| _CPM_Rate | 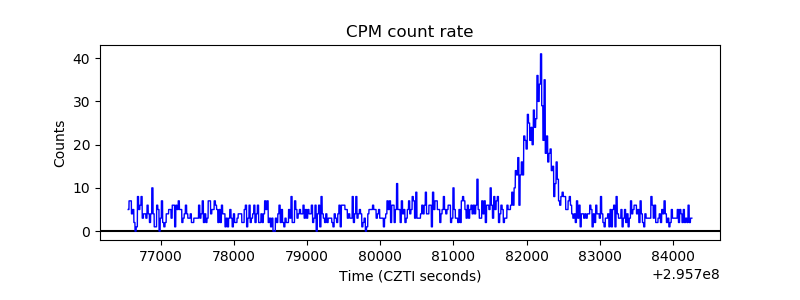 |
| CZT Counter | 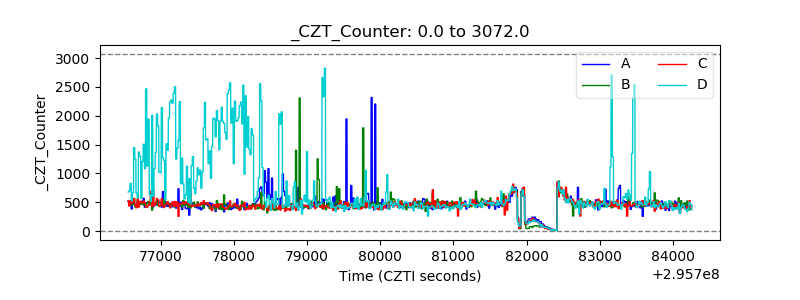 |
| +2.5 Volts monitor |  |
| +5 Volts monitor |  |
| _ROLL_ROT | 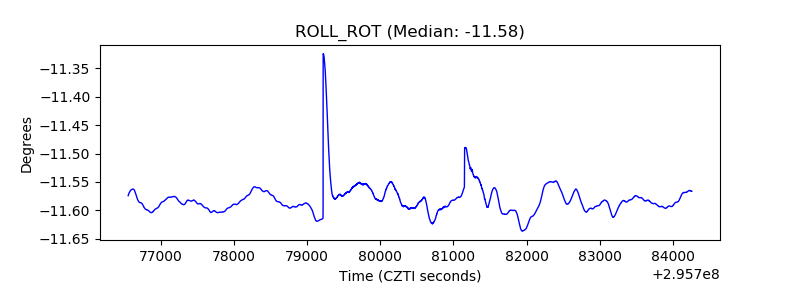 |
| _Roll_DEC | 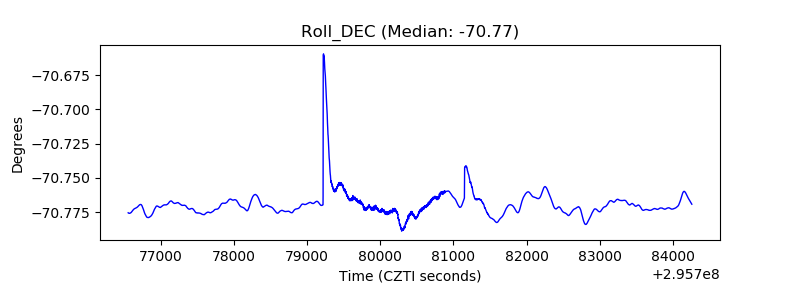 |
| _Roll_RA | 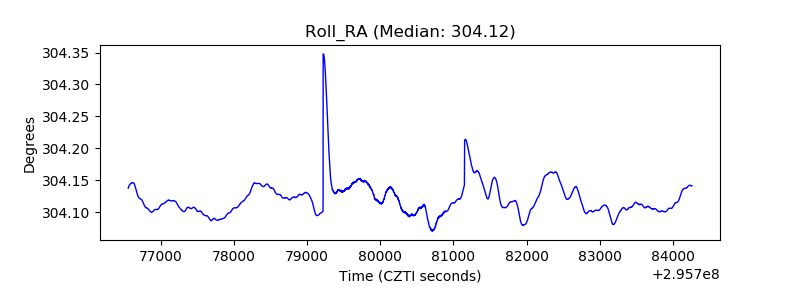 |
| Veto Counter | 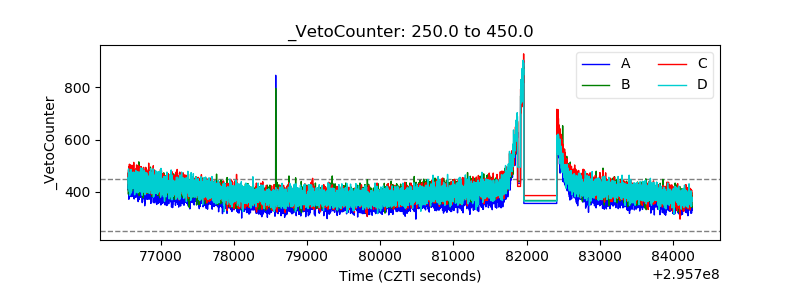 |