| Param | Original file | Final file |
|---|---|---|
| Filename | modeM0/AS1A05_101T10_9000002924_19646cztM0_level2.evt | modeM0/AS1A05_101T10_9000002924_19646cztM0_level2_quad_clean.evt |
| Size (bytes) | 241,738,560 | 60,949,440 |
| Size | 230.5 MB | 58.1 MB |
| Events in quadrant A | 1,504,044 | 407,851 |
| Events in quadrant B | 1,682,871 | 410,293 |
| Events in quadrant C | 1,447,695 | 404,871 |
| Events in quadrant D | 2,454,245 | 382,011 |
| Mode M0 | |||
|---|---|---|---|
| Quadrant | BADHDUFLAG | Total packets | Discarded packets |
| A | 0 | 6944 | 0 |
| B | 0 | 7339 | 0 |
| C | 0 | 6784 | 0 |
| D | 0 | 9663 | 0 |
| Mode SS | |||
|---|---|---|---|
| Quadrant | BADHDUFLAG | Total packets | Discarded packets |
| A | 0 | 68 | 0 |
| B | 0 | 68 | 0 |
| C | 0 | 68 | 0 |
| D | 0 | 68 | 0 |
| Quadrant | Total seconds | Saturated seconds | Saturation percentage |
|---|---|---|---|
| A | 3387 | 8 | 0.236197% |
| B | 3388 | 18 | 0.531287% |
| C | 3388 | 7 | 0.206612% |
| D | 3388 | 321 | 9.474616% |
Noise dominated data is calculated using 1-second bins in cleaned event files. If a bin has >2000 counts, and if more than 50% of those come from <1% of pixels, then it is considered to be noise-dominated and hence unusable.
| Quadrant | # 1 sec bins | Bins with >0 counts | Bins with >2000 counts | High rate bins dominated by noise | Noise dominated (total time) | Noise dominated (detector-on time) | Marked lightcurve |
|---|---|---|---|---|---|---|---|
| A | 3387 | 3387 | 7 | 7 | 0.21% | 0.21% | 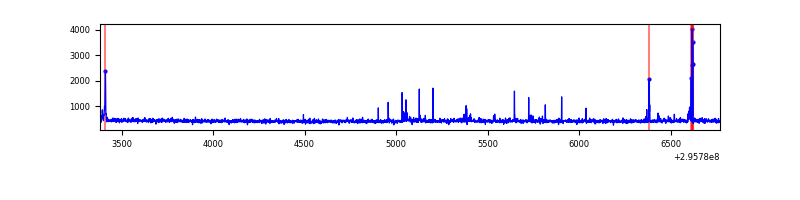 |
| B | 3388 | 3388 | 16 | 16 | 0.47% | 0.47% | 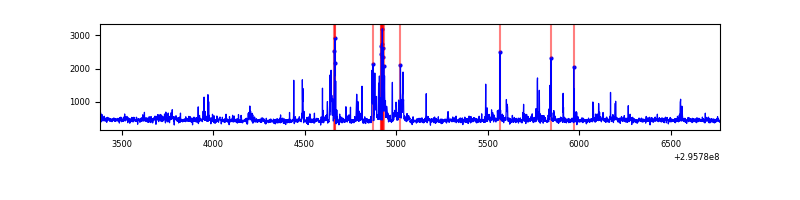 |
| C | 3388 | 3388 | 0 | 0 | 0.00% | 0.00% | 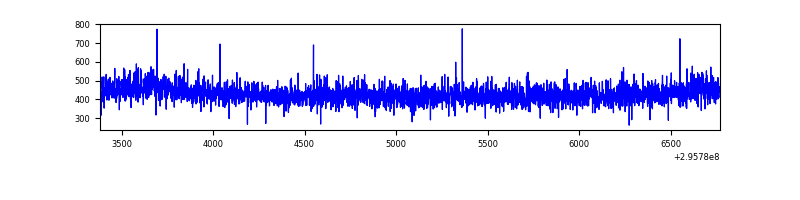 |
| D | 3388 | 3388 | 328 | 328 | 9.68% | 9.68% | 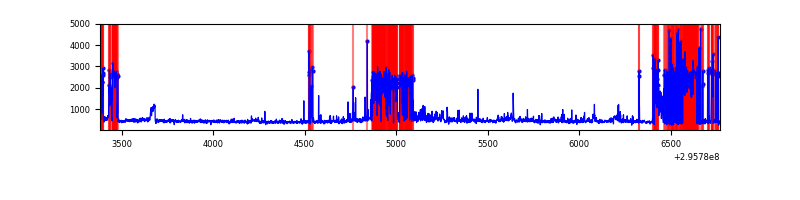 |
Top three noisy pixels from each quadrant. If the there are fewer than three noisy pixels in the level2.evt file, extra rows are filled as -1
| Pixel properties | Quadrant properties | ||||||
|---|---|---|---|---|---|---|---|
| Quadrant | DetID | PixID | Counts | Sigma | Mean | Median | Sigma |
| A | 5 | 16 | 57863 | 760.91 | 371 | 363 | 75.6 |
| A | 9 | 143 | 14464 | 186.6 | 371 | 363 | 75.6 |
| A | 0 | 226 | 3256 | 38.28 | 371 | 363 | 75.6 |
| B | 3 | 112 | 164435 | 2331.77 | 367 | 357 | 70.4 |
| B | 7 | 220 | 22913 | 320.54 | 367 | 357 | 70.4 |
| B | 0 | 230 | 15100 | 209.51 | 367 | 357 | 70.4 |
| C | 14 | 238 | 56232 | 668.77 | 354 | 355 | 83.6 |
| C | 9 | 221 | 6106 | 68.83 | 354 | 355 | 83.6 |
| C | 3 | 233 | 4480 | 49.37 | 354 | 355 | 83.6 |
| D | 1 | 20 | 773248 | 8998.65 | 348 | 337 | 85.9 |
| D | 1 | 52 | 246521 | 2866.21 | 348 | 337 | 85.9 |
| D | 13 | 172 | 43795 | 505.96 | 348 | 337 | 85.9 |
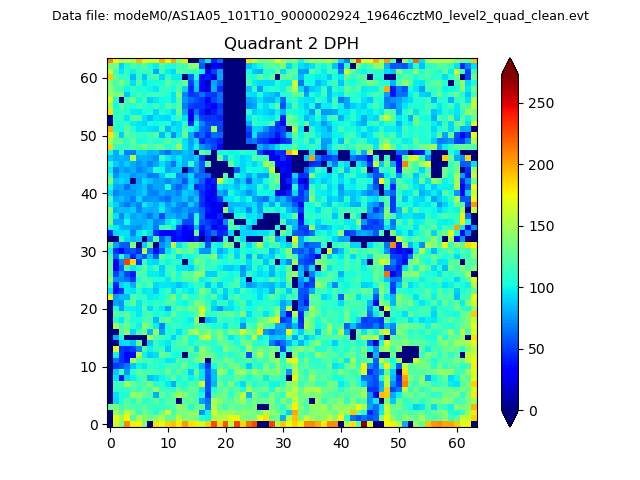
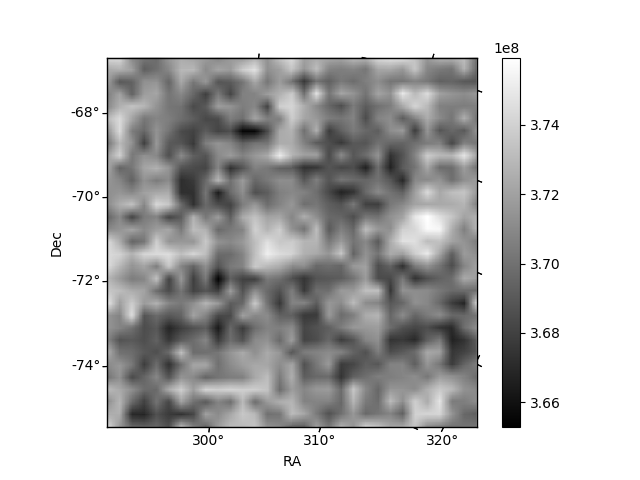
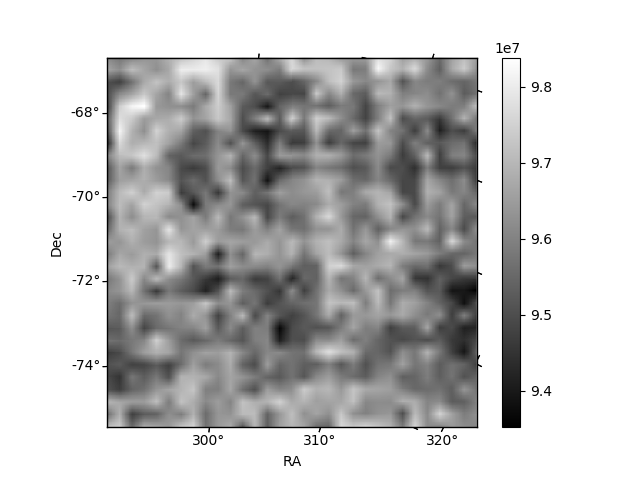
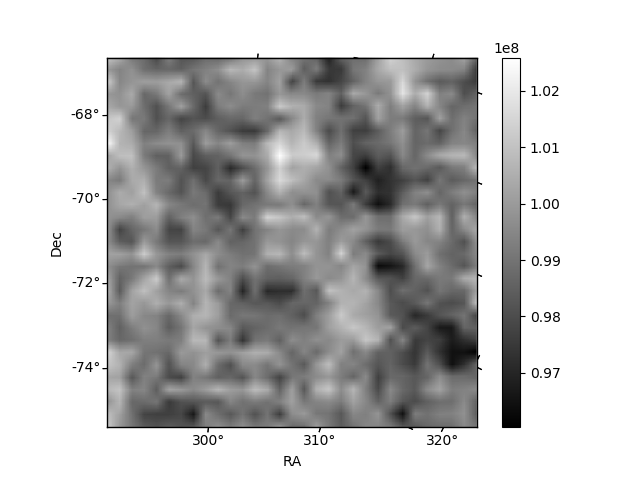
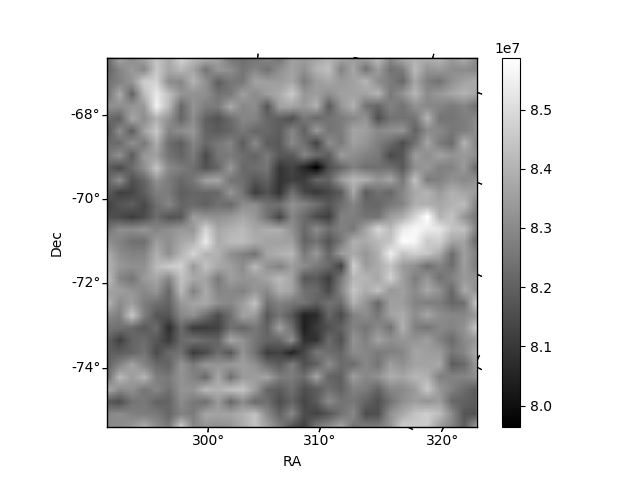
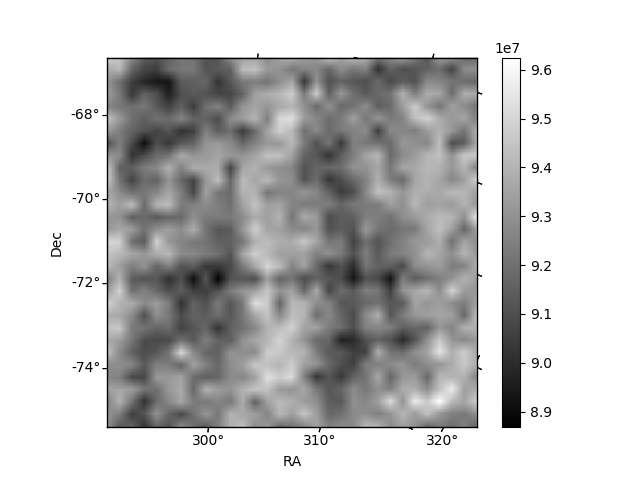
Histogram calculated using DETX and DETY for each event in the final _common_clean file
| Quadrant A | 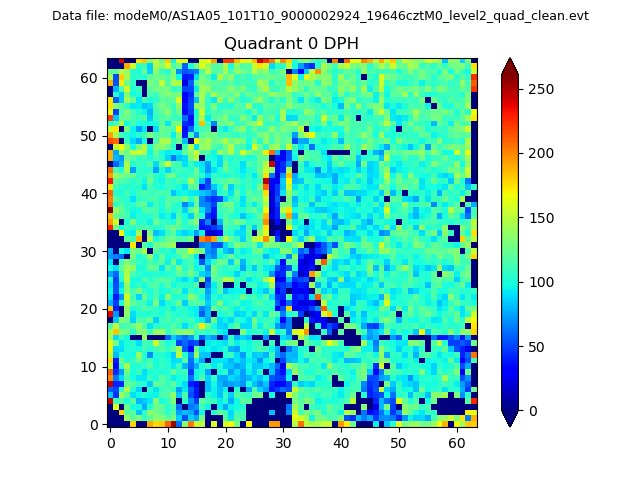 |
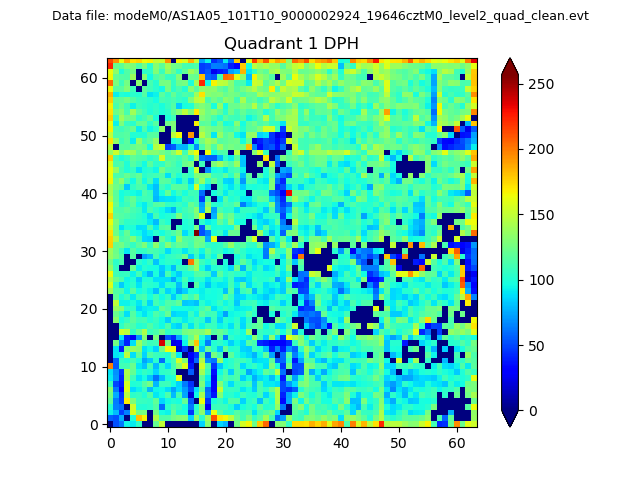 |
Quadrant B |
|---|---|---|---|
| Quadrant D | 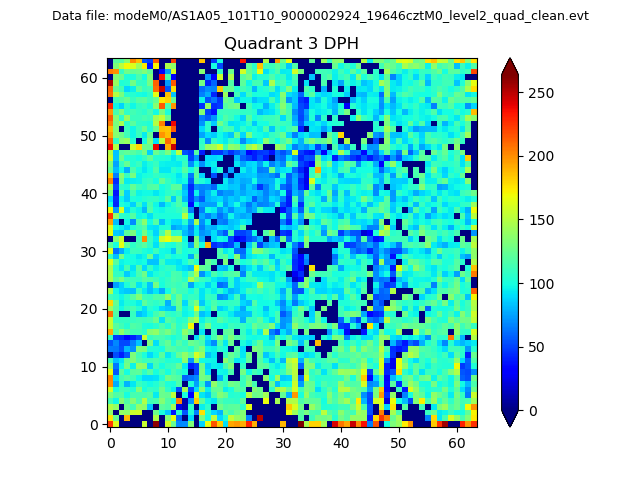 |
 |
Quadrant C |
| Plot type | Count rate plots | Images |
|---|---|---|
| Comparison with Poisson distribution Blue bars denote a histogram of data divided into 1 sec bins. Red curve is a Poisson curve with rate = median count rate of data. |
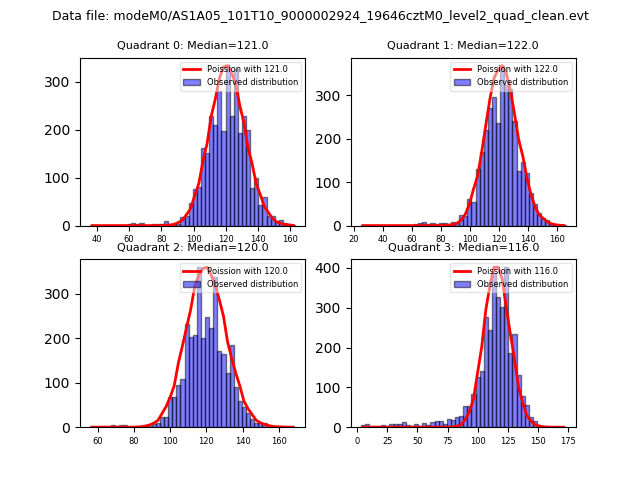 |
 |
| Quadrant-wise count rates Data is divided into 100 sec bins |
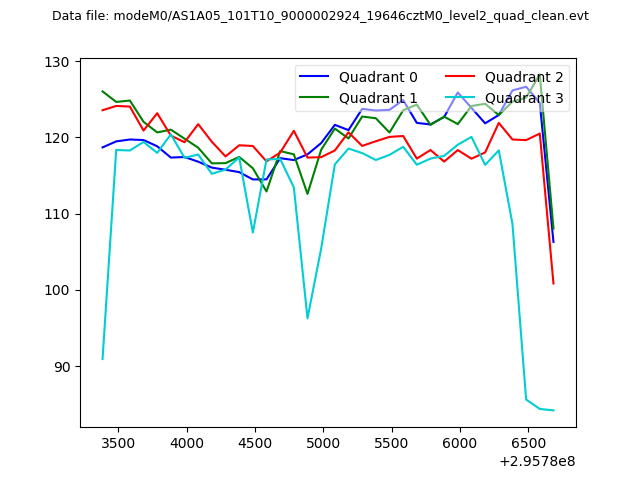 |
|
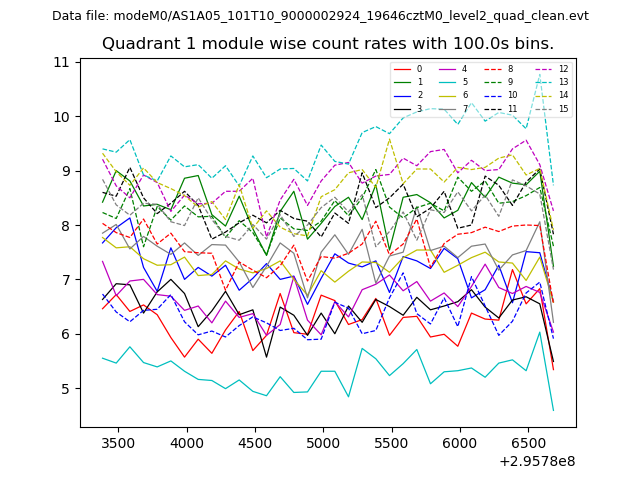
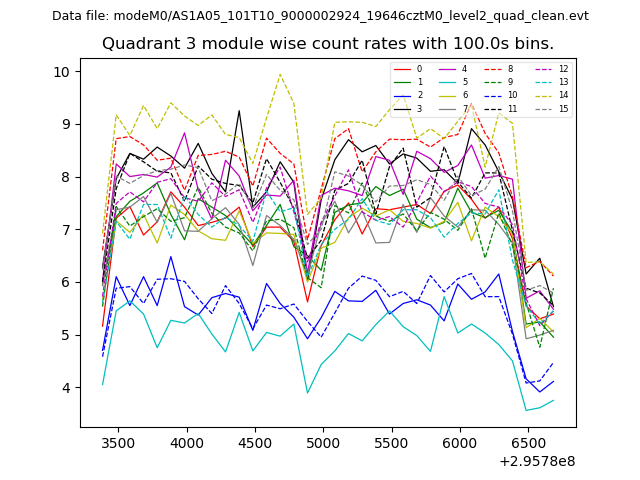
| Module-wise count rates for Quadrant A Data is divided into 100 sec bins |
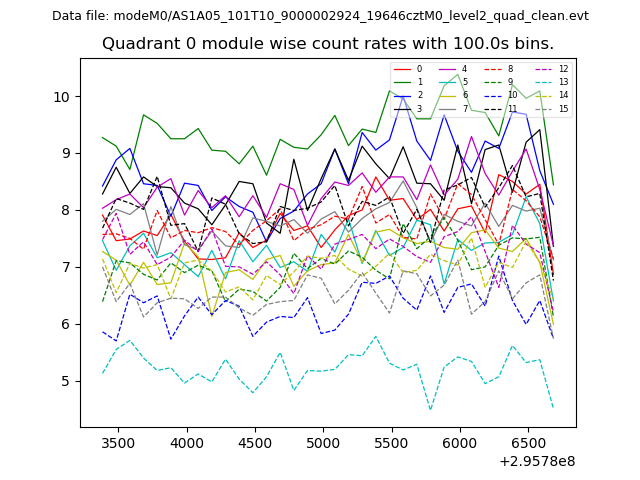 |
 |
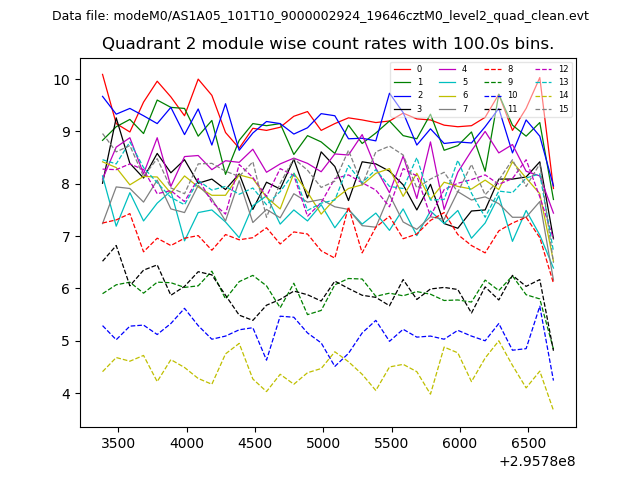
| Module-wise count rates for Quadrant B Data is divided into 100 sec bins |
 |
 |
| Module-wise count rates for Quadrant C Data is divided into 100 sec bins |
 |
 |
| Module-wise count rates for Quadrant D Data is divided into 100 sec bins |
 |
 |
| Parameter | Plot |
|---|---|
| CZT HV Monitor | 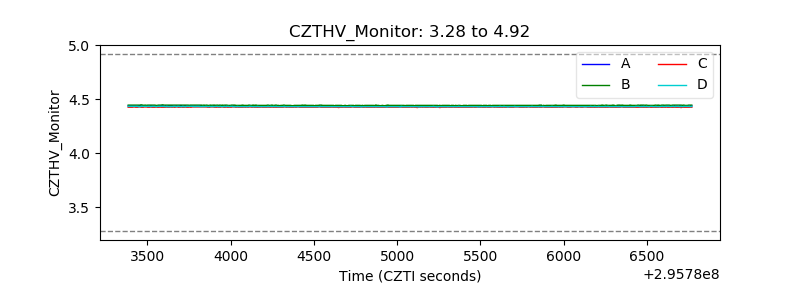 |
| D_VDD | 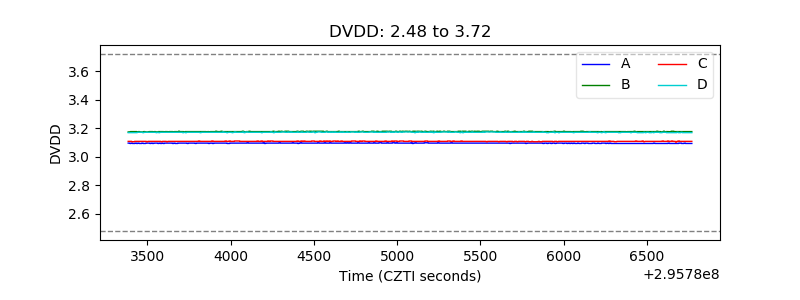 |
| Temperature 1 | 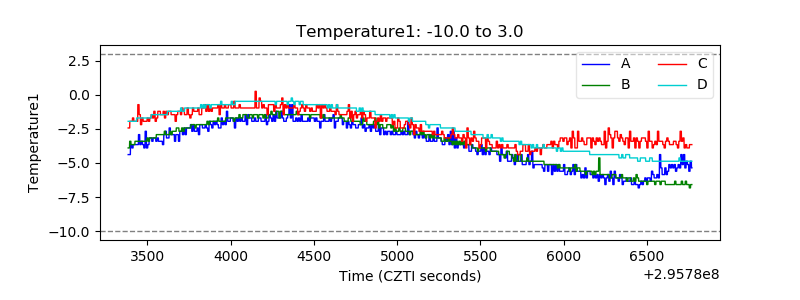 |
| Veto HV Monitor | 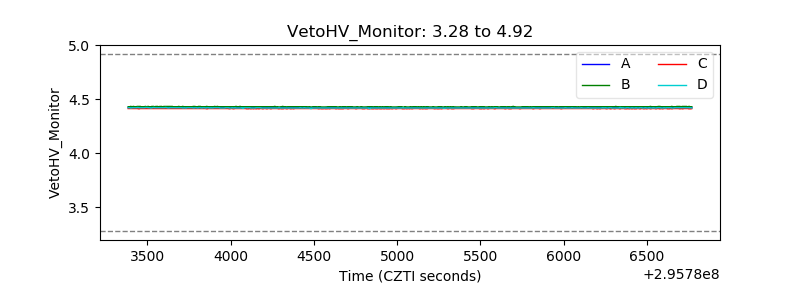 |
| Veto LLD | 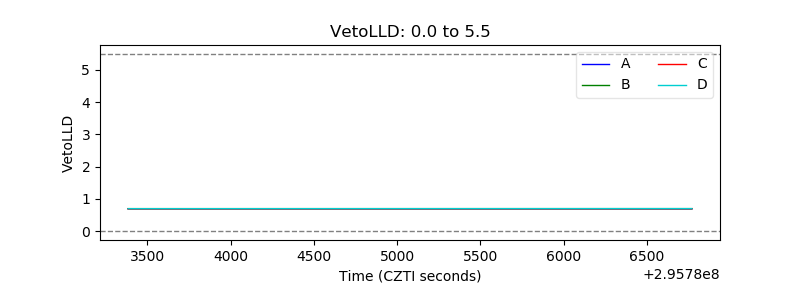 |
| Alpha Counter | 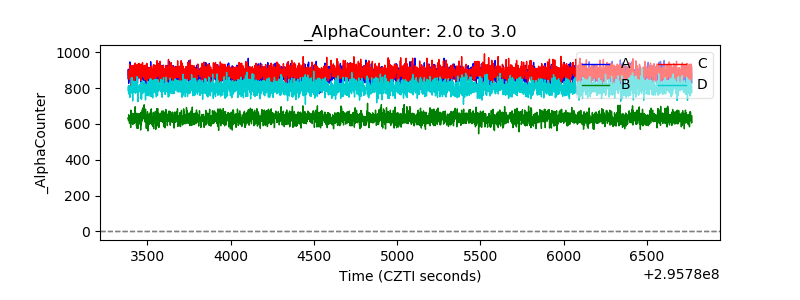 |
| _CPM_Rate | 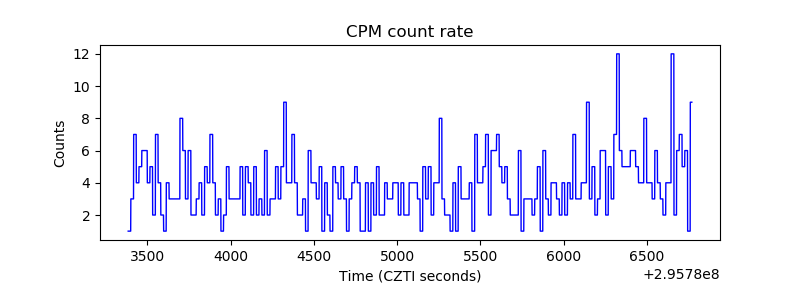 |
| CZT Counter | 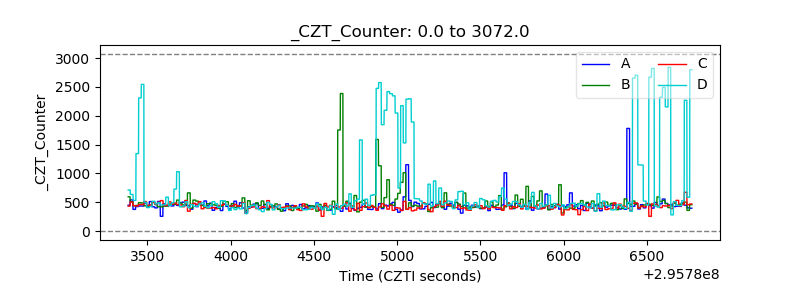 |
| +2.5 Volts monitor |  |
| +5 Volts monitor |  |
| _ROLL_ROT | 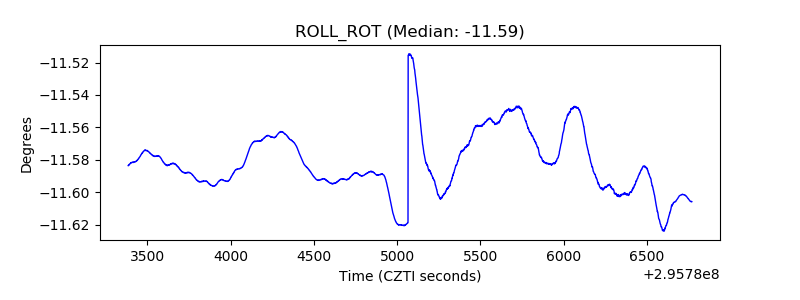 |
| _Roll_DEC | 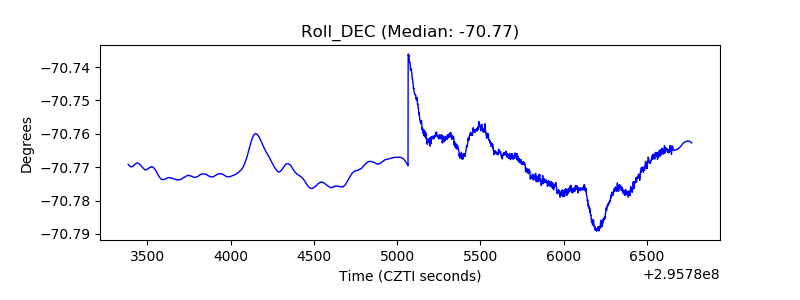 |
| _Roll_RA | 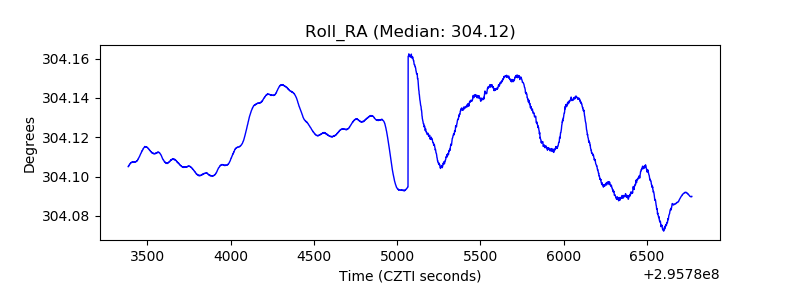 |
| Veto Counter | 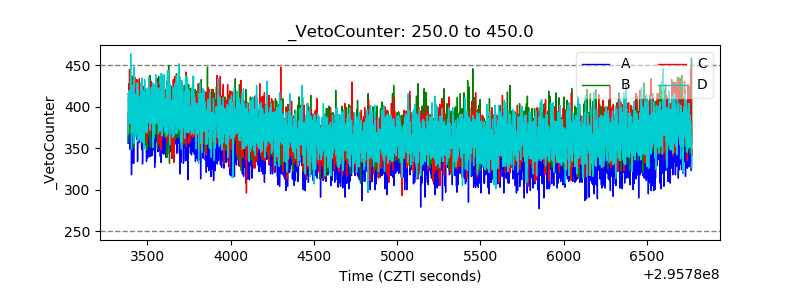 |