| Param | Original file | Final file |
|---|---|---|
| Filename | modeM0/AS1A06_003T02_9000002926cztM0_level2.fits | modeM0/AS1A06_003T02_9000002926cztM0_level2_quad_clean.evt |
| Size (bytes) | 305,251,200 | 250,801,920 |
| Size | 291.1 MB | 239.2 MB |
| Events in quadrant A | 1,889,134 | 1,488,878 |
| Events in quadrant B | 1,820,436 | 1,482,639 |
| Events in quadrant C | 1,848,584 | 1,406,483 |
| Events in quadrant D | 1,437,496 | 969,876 |
| Mode SS | |||
|---|---|---|---|
| Quadrant | BADHDUFLAG | Total packets | Discarded packets |
| A | 0 | 666 | 0 |
| B | 0 | 666 | 0 |
| C | 0 | 666 | 0 |
| D | 0 | 666 | 0 |
| Mode M9 | |||
|---|---|---|---|
| Quadrant | BADHDUFLAG | Total packets | Discarded packets |
| A | 0 | 43 | 0 |
| B | 0 | 43 | 0 |
| C | 0 | 44 | 0 |
| D | 0 | 44 | 0 |
| Mode M0 | |||
|---|---|---|---|
| Quadrant | BADHDUFLAG | Total packets | Discarded packets |
| A | 0 | 67594 | 0 |
| B | 0 | 69843 | 0 |
| C | 0 | 67434 | 0 |
| D | 0 | 110203 | 0 |
| Quadrant | Total seconds | Saturated seconds | Saturation percentage |
|---|---|---|---|
| A | 32685 | 541 | 1.655194% |
| B | 32685 | 674 | 2.062108% |
| C | 32685 | 643 | 1.967263% |
| D | 32685 | 5202 | 15.915558% |
Noise dominated data is calculated using 1-second bins in cleaned event files. If a bin has >2000 counts, and if more than 50% of those come from <1% of pixels, then it is considered to be noise-dominated and hence unusable.
| Quadrant | # 1 sec bins | Bins with >0 counts | Bins with >2000 counts | High rate bins dominated by noise | Noise dominated (total time) | Noise dominated (detector-on time) | Marked lightcurve |
|---|---|---|---|---|---|---|---|
| A | 46856 | 32683 | 0 | 0 | 0.00% | 0.00% | 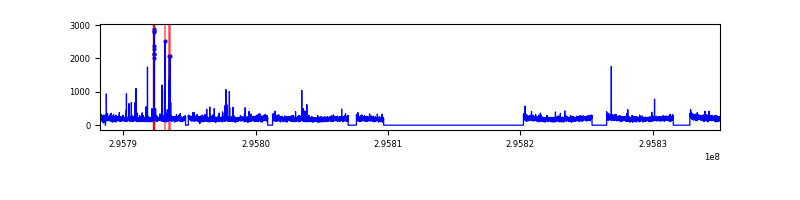 |
| B | 46856 | 32682 | 0 | 0 | 0.00% | 0.00% | 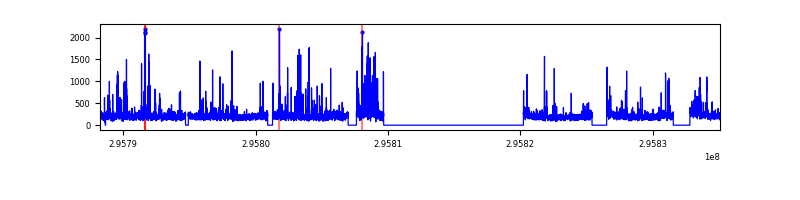 |
| C | 46856 | 32683 | 0 | 0 | 0.00% | 0.00% |  |
| D | 46856 | 31864 | 0 | 0 | 0.00% | 0.00% |  |
Top three noisy pixels from each quadrant. If the there are fewer than three noisy pixels in the level2.evt file, extra rows are filled as -1
| Pixel properties | Quadrant properties | ||||||
|---|---|---|---|---|---|---|---|
| Quadrant | DetID | PixID | Counts | Sigma | Mean | Median | Sigma |
| A | 0 | 29 | 1866 | 11.48 | 491 | 460 | 122.4 |
| A | 7 | 110 | 1496 | 8.46 | 491 | 460 | 122.4 |
| A | 15 | 236 | 1414 | 7.79 | 491 | 460 | 122.4 |
| B | 2 | 9 | 1454 | 10.63 | 479 | 457 | 93.8 |
| B | 3 | 17 | 1249 | 8.44 | 479 | 457 | 93.8 |
| B | 2 | 8 | 1216 | 8.09 | 479 | 457 | 93.8 |
| C | 1 | 81 | 1392 | 7.44 | 487 | 453 | 126.2 |
| C | 1 | 80 | 1387 | 7.4 | 487 | 453 | 126.2 |
| C | 12 | 241 | 1363 | 7.21 | 487 | 453 | 126.2 |
| D | 3 | 14 | 1037 | 6.01 | 411 | 374 | 110.4 |
| D | 6 | 231 | 1026 | 5.91 | 411 | 374 | 110.4 |
| D | 15 | 46 | 1024 | 5.89 | 411 | 374 | 110.4 |
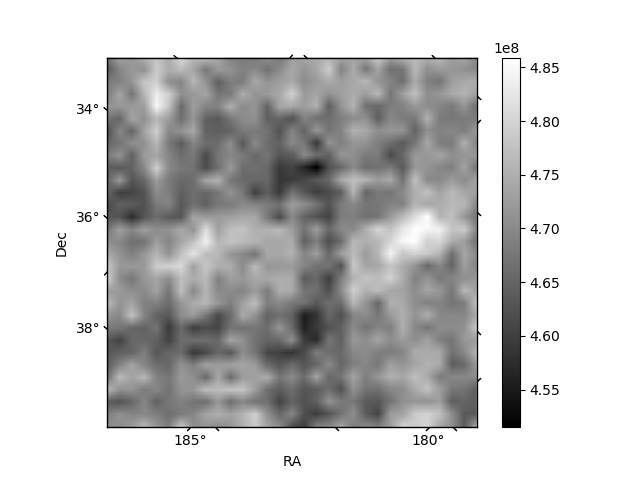
Histogram calculated using DETX and DETY for each event in the final _common_clean file
| Quadrant A | 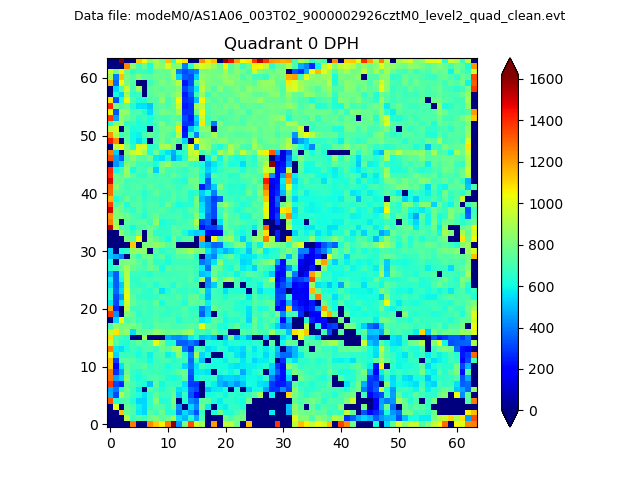 |
 |
Quadrant B |
|---|---|---|---|
| Quadrant D |  |
 |
Quadrant C |
| Plot type | Count rate plots | Images |
|---|---|---|
| Comparison with Poisson distribution Blue bars denote a histogram of data divided into 1 sec bins. Red curve is a Poisson curve with rate = median count rate of data. |
 |
 |
| Quadrant-wise count rates Data is divided into 100 sec bins |
 |
|
| Module-wise count rates for Quadrant A Data is divided into 100 sec bins |
 |
 |
| Module-wise count rates for Quadrant B Data is divided into 100 sec bins |
 |
 |
| Module-wise count rates for Quadrant C Data is divided into 100 sec bins |
 |
 |
| Module-wise count rates for Quadrant D Data is divided into 100 sec bins |
 |
 |
| Parameter | Plot |
|---|---|
| CZT HV Monitor |  |
| D_VDD |  |
| Temperature 1 |  |
| Veto HV Monitor |  |
| Veto LLD | 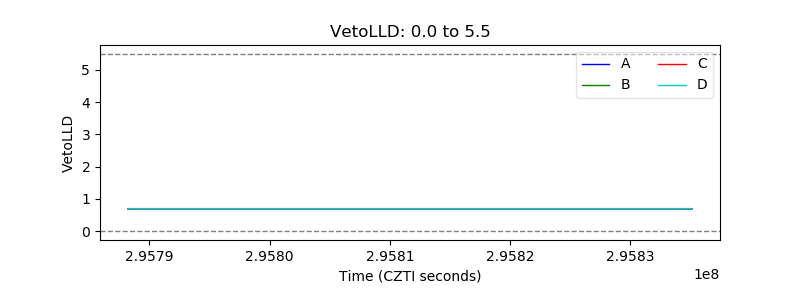 |
| Alpha Counter |  |
| _CPM_Rate |  |
| CZT Counter | 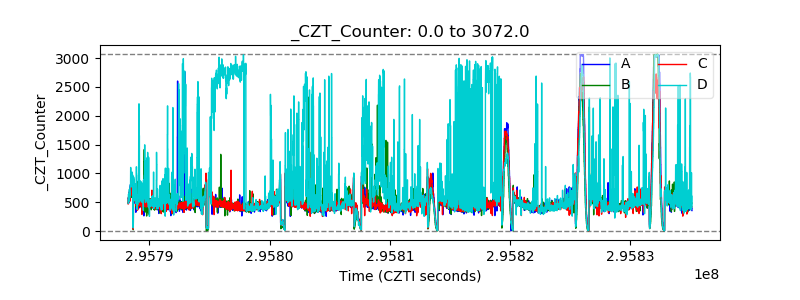 |
| +2.5 Volts monitor |  |
| +5 Volts monitor |  |
| _ROLL_ROT |  |
| _Roll_DEC |  |
| _Roll_RA |  |
| Veto Counter | 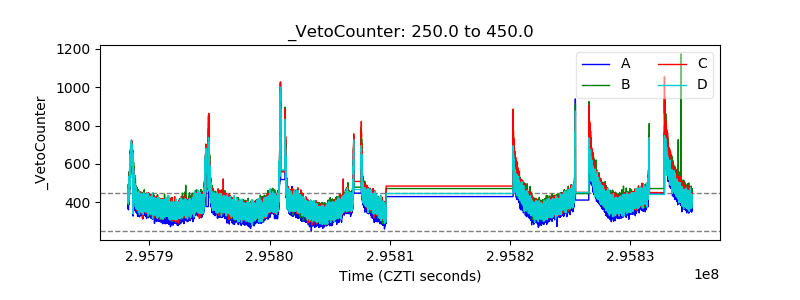 |