| Param | Original file | Final file |
|---|---|---|
| Filename | modeM0/AS1A06_003T02_9000002926_19646cztM0_level2.evt | modeM0/AS1A06_003T02_9000002926_19646cztM0_level2_quad_clean.evt |
| Size (bytes) | 169,968,960 | 19,788,480 |
| Size | 162.1 MB | 18.9 MB |
| Events in quadrant A | 1,121,871 | 113,996 |
| Events in quadrant B | 1,178,863 | 116,716 |
| Events in quadrant C | 1,115,575 | 108,781 |
| Events in quadrant D | 1,585,088 | 106,020 |
| Mode SS | |||
|---|---|---|---|
| Quadrant | BADHDUFLAG | Total packets | Discarded packets |
| A | 0 | 42 | 0 |
| B | 0 | 42 | 0 |
| C | 0 | 42 | 0 |
| D | 0 | 42 | 0 |
| Mode M0 | |||
|---|---|---|---|
| Quadrant | BADHDUFLAG | Total packets | Discarded packets |
| A | 0 | 4692 | 1 |
| B | 0 | 4875 | 1 |
| C | 0 | 4668 | 1 |
| D | 0 | 6134 | 1 |
| Quadrant | Total seconds | Saturated seconds | Saturation percentage |
|---|---|---|---|
| A | 2112 | 249 | 11.789773% |
| B | 2112 | 250 | 11.837121% |
| C | 2112 | 252 | 11.931818% |
| D | 2111 | 280 | 13.263856% |
Noise dominated data is calculated using 1-second bins in cleaned event files. If a bin has >2000 counts, and if more than 50% of those come from <1% of pixels, then it is considered to be noise-dominated and hence unusable.
| Quadrant | # 1 sec bins | Bins with >0 counts | Bins with >2000 counts | High rate bins dominated by noise | Noise dominated (total time) | Noise dominated (detector-on time) | Marked lightcurve |
|---|---|---|---|---|---|---|---|
| A | 2142 | 2113 | 0 | 0 | 0.00% | 0.00% | 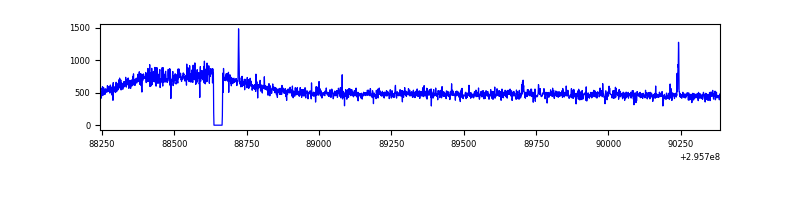 |
| B | 2142 | 2113 | 1 | 1 | 0.05% | 0.05% | 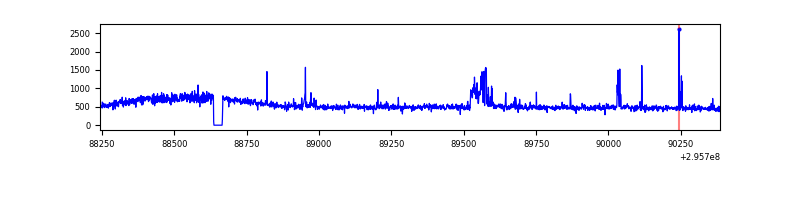 |
| C | 2142 | 2113 | 0 | 0 | 0.00% | 0.00% | 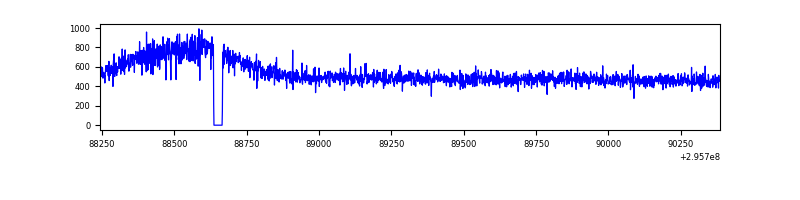 |
| D | 2141 | 2112 | 32 | 32 | 1.49% | 1.52% | 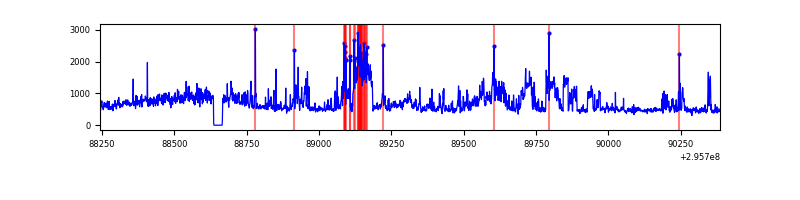 |
Top three noisy pixels from each quadrant. If the there are fewer than three noisy pixels in the level2.evt file, extra rows are filled as -1
| Pixel properties | Quadrant properties | ||||||
|---|---|---|---|---|---|---|---|
| Quadrant | DetID | PixID | Counts | Sigma | Mean | Median | Sigma |
| A | 4 | 2 | 5447 | 84.72 | 289 | 282 | 61.0 |
| A | 5 | 16 | 3337 | 50.11 | 289 | 282 | 61.0 |
| A | 3 | 137 | 2597 | 37.97 | 289 | 282 | 61.0 |
| B | 3 | 112 | 52460 | 908.68 | 282 | 274 | 57.4 |
| B | 7 | 220 | 14117 | 241.04 | 282 | 274 | 57.4 |
| B | 12 | 111 | 7019 | 117.45 | 282 | 274 | 57.4 |
| C | 14 | 238 | 42193 | 627.8 | 273 | 272 | 66.8 |
| C | 8 | 128 | 4092 | 57.21 | 273 | 272 | 66.8 |
| C | 13 | 61 | 2028 | 26.3 | 273 | 272 | 66.8 |
| D | 1 | 52 | 523457 | 7393.55 | 280 | 270 | 70.8 |
| D | 1 | 20 | 9422 | 129.33 | 280 | 270 | 70.8 |
| D | 2 | 234 | 6900 | 93.69 | 280 | 270 | 70.8 |
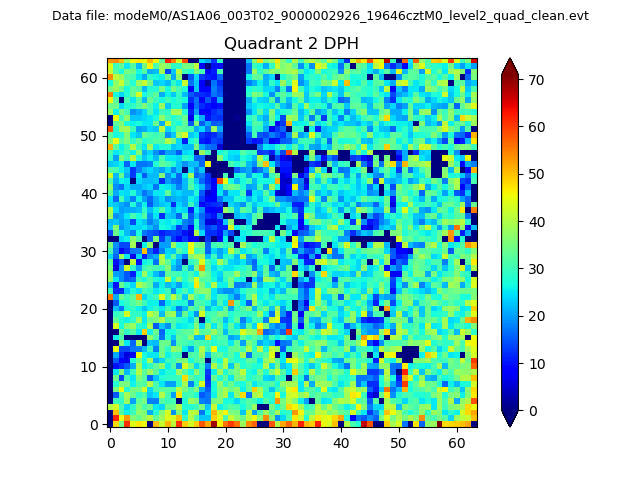
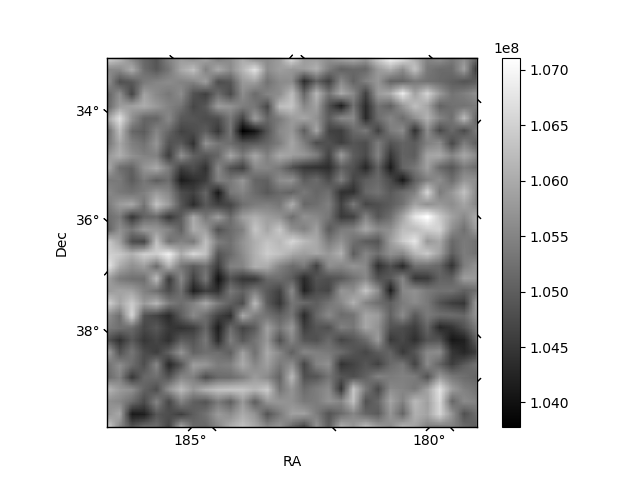
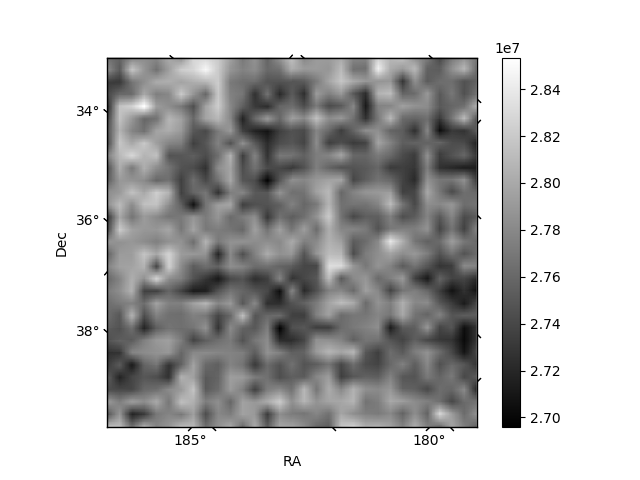
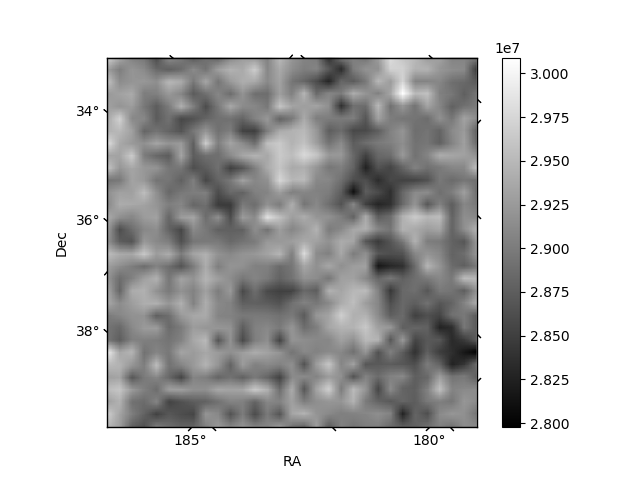
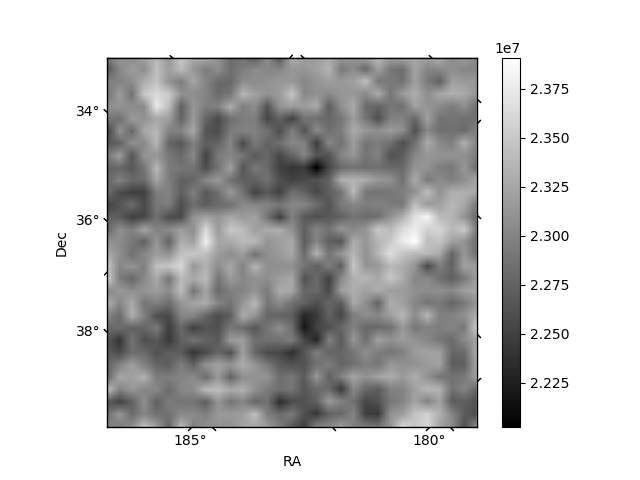
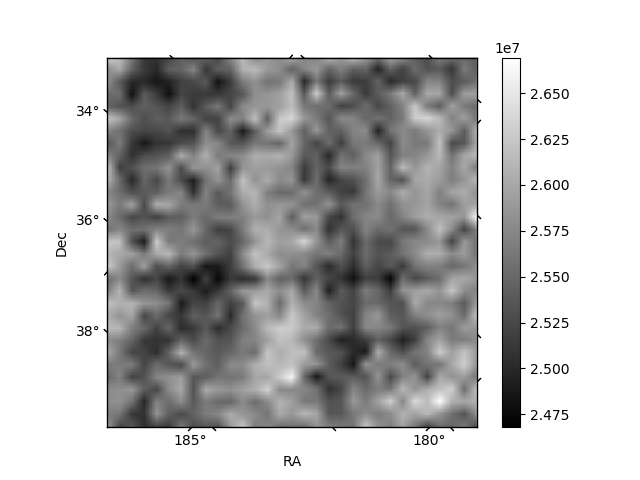
Histogram calculated using DETX and DETY for each event in the final _common_clean file
| Quadrant A | 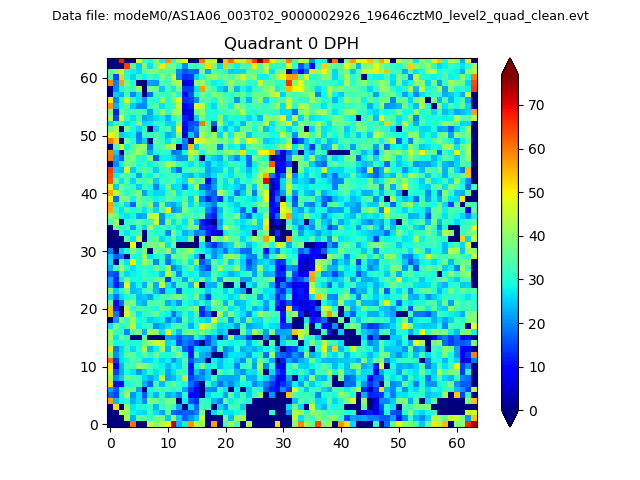 |
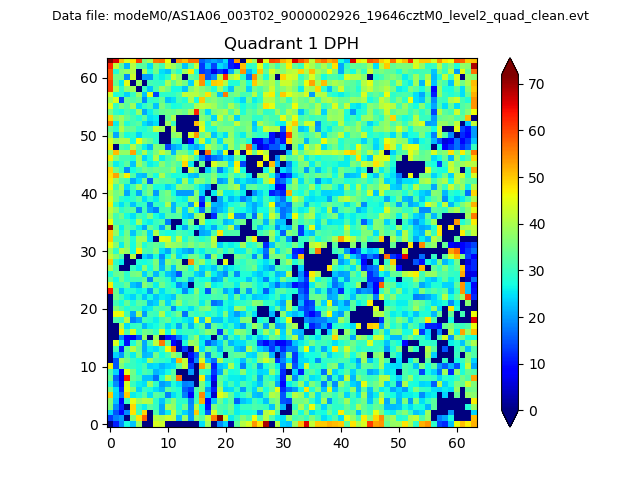 |
Quadrant B |
|---|---|---|---|
| Quadrant D | 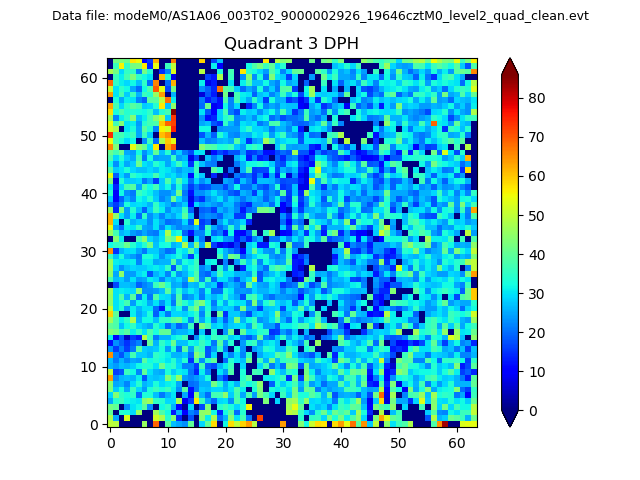 |
 |
Quadrant C |
| Plot type | Count rate plots | Images |
|---|---|---|
| Comparison with Poisson distribution Blue bars denote a histogram of data divided into 1 sec bins. Red curve is a Poisson curve with rate = median count rate of data. |
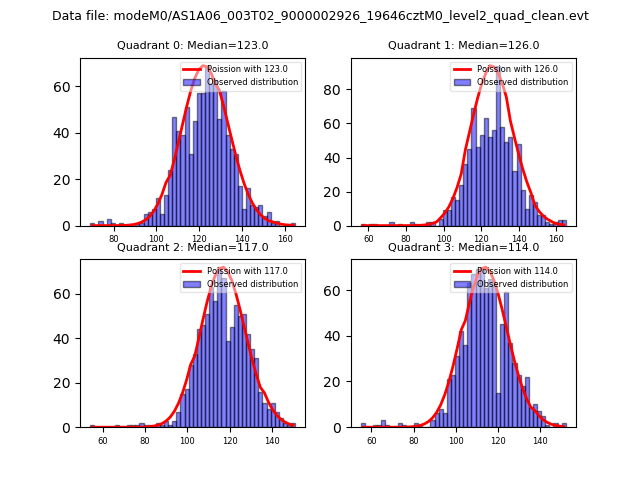 |
 |
| Quadrant-wise count rates Data is divided into 100 sec bins |
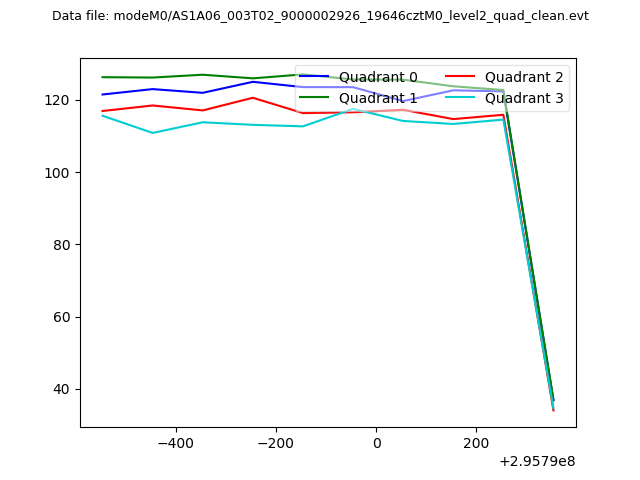 |
|
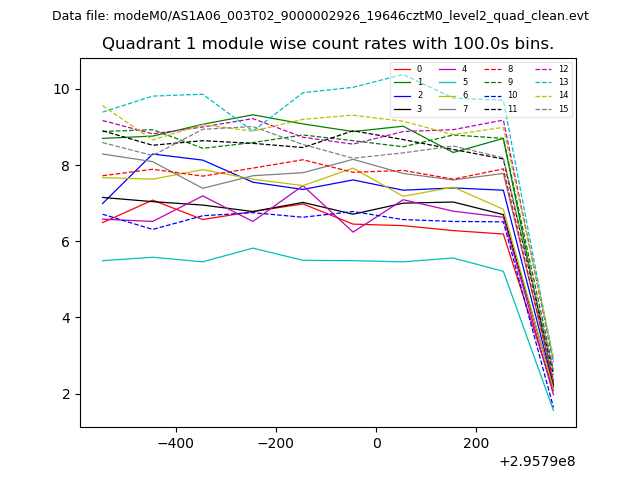
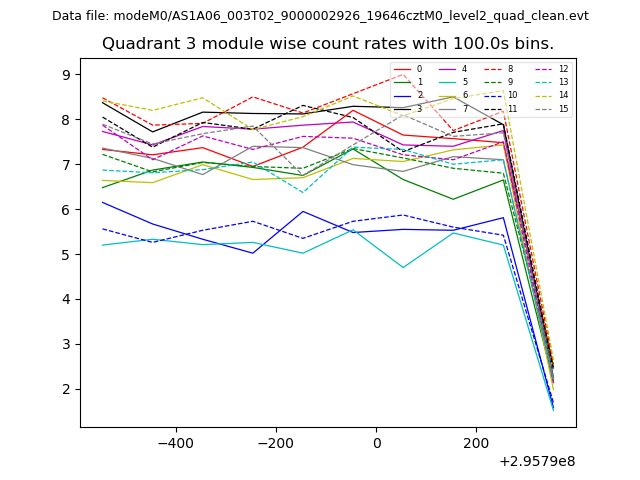
| Module-wise count rates for Quadrant A Data is divided into 100 sec bins |
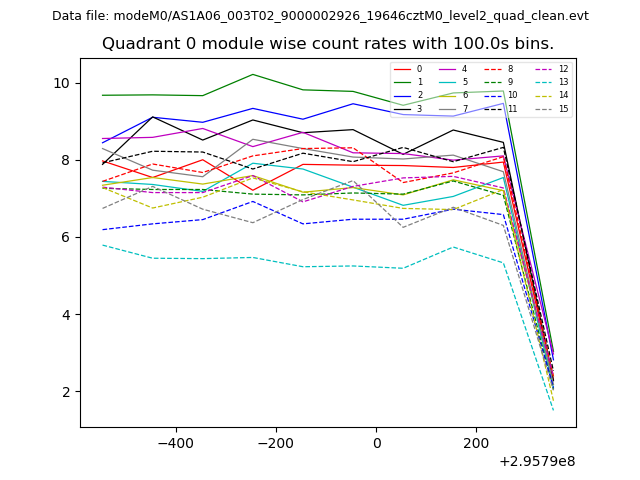 |
 |
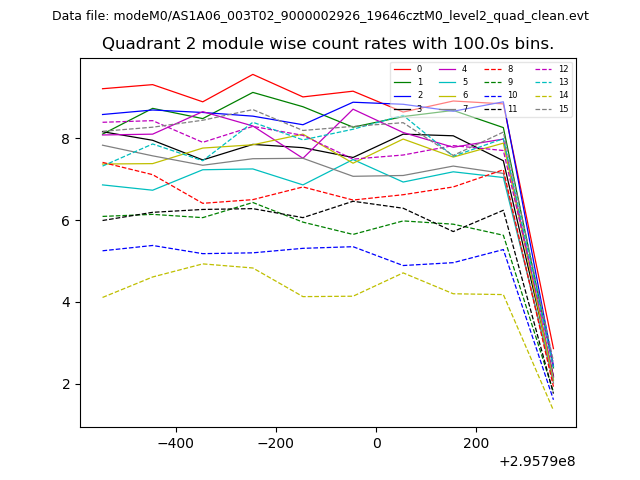
| Module-wise count rates for Quadrant B Data is divided into 100 sec bins |
 |
 |
| Module-wise count rates for Quadrant C Data is divided into 100 sec bins |
 |
 |
| Module-wise count rates for Quadrant D Data is divided into 100 sec bins |
 |
 |
| Parameter | Plot |
|---|---|
| CZT HV Monitor | 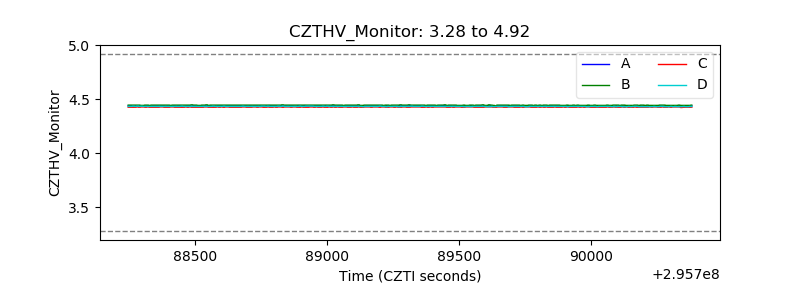 |
| D_VDD | 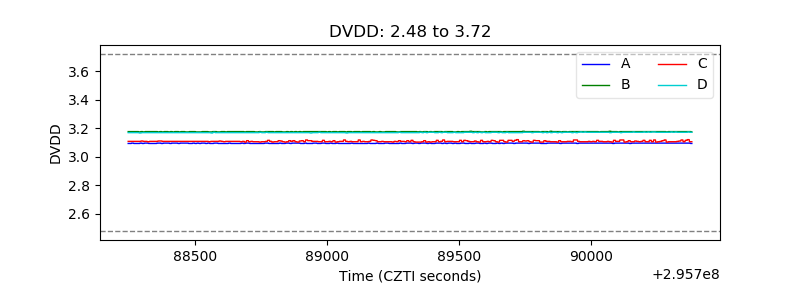 |
| Temperature 1 | 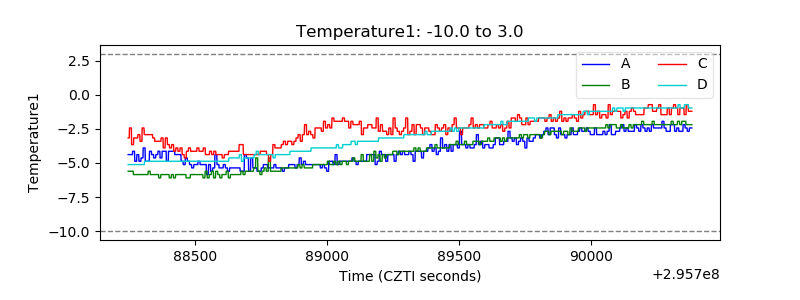 |
| Veto HV Monitor | 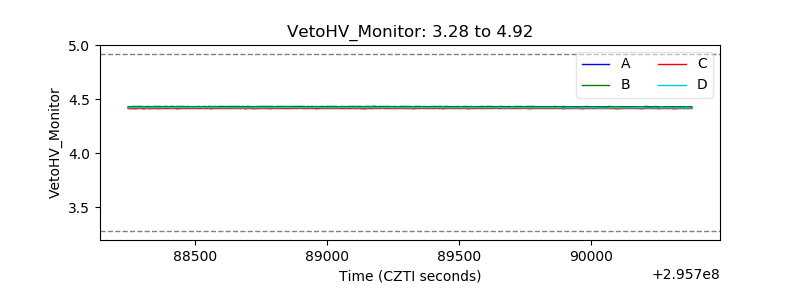 |
| Veto LLD | 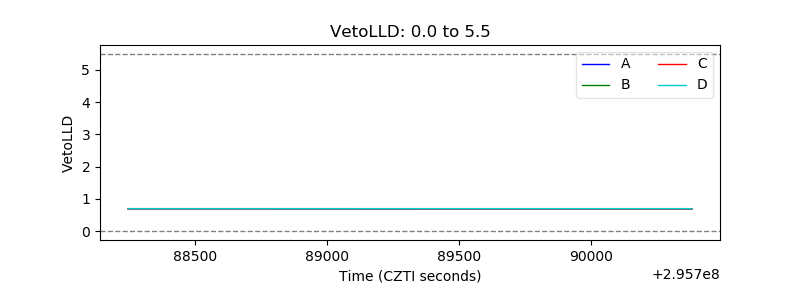 |
| Alpha Counter | 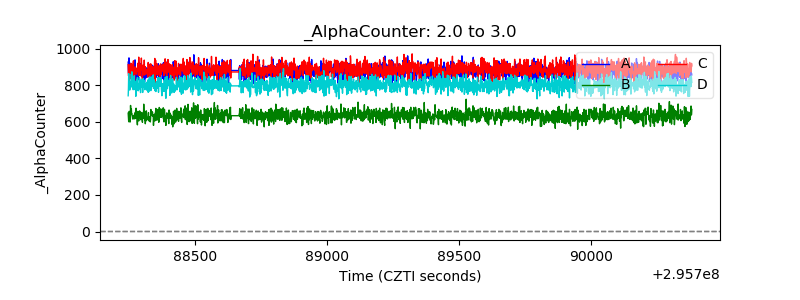 |
| _CPM_Rate | 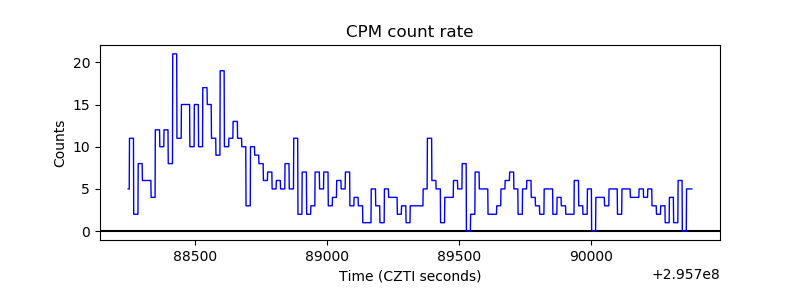 |
| CZT Counter | 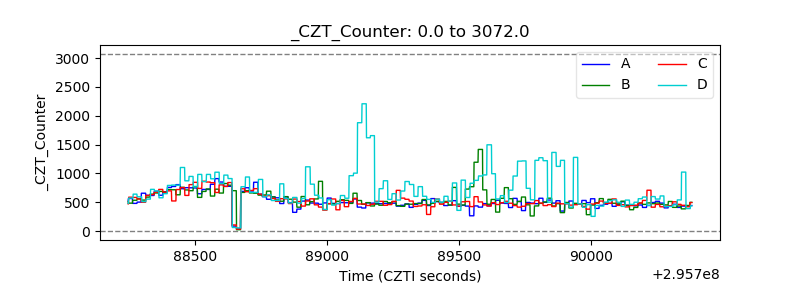 |
| +2.5 Volts monitor | 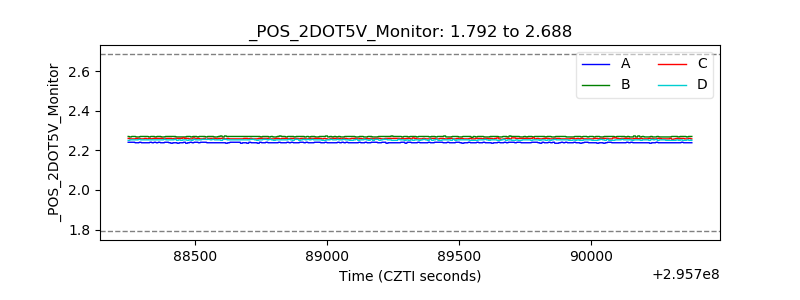 |
| +5 Volts monitor |  |
| _ROLL_ROT | 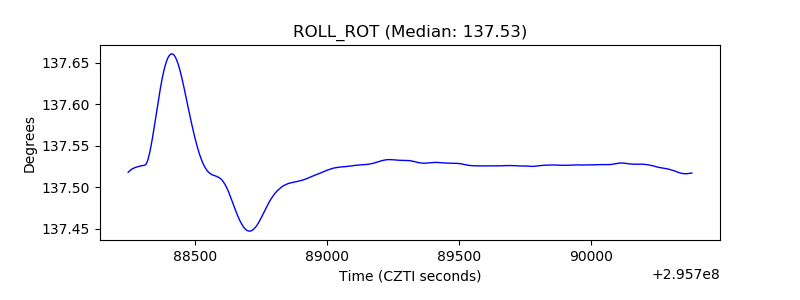 |
| _Roll_DEC | 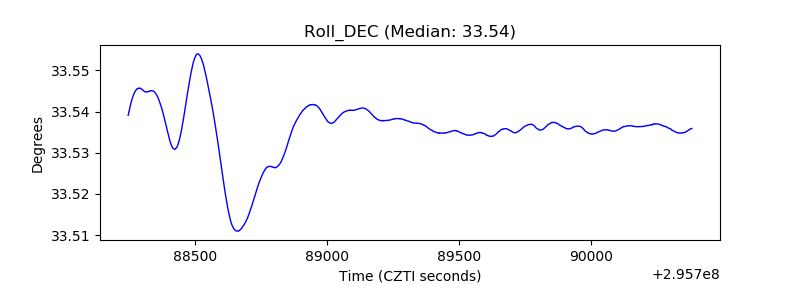 |
| _Roll_RA | 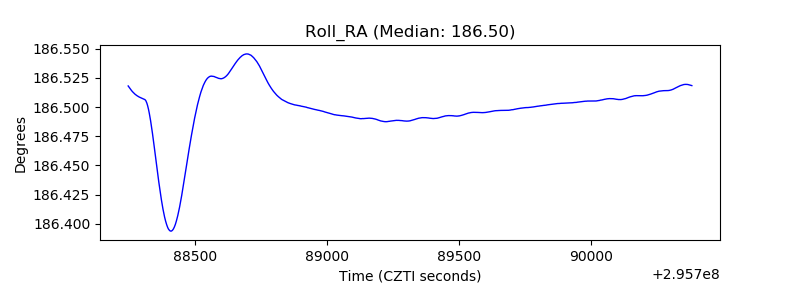 |
| Veto Counter | 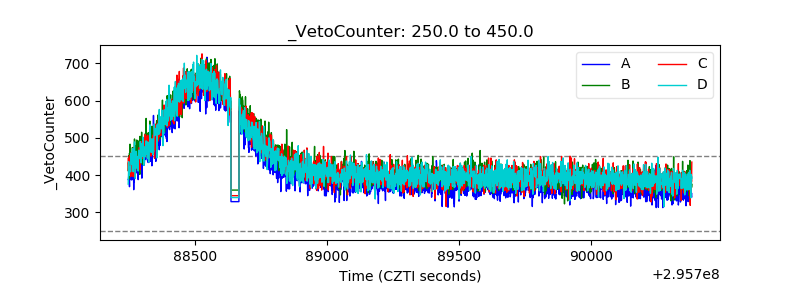 |