| Param | Original file | Final file |
|---|---|---|
| Filename | modeM0/AS1A06_003T02_9000002926_19650cztM0_level2.evt | modeM0/AS1A06_003T02_9000002926_19650cztM0_level2_quad_clean.evt |
| Size (bytes) | 1,519,338,240 | 222,713,280 |
| Size | 1.4 GB | 212.4 MB |
| Events in quadrant A | 8,230,478 | 1,486,395 |
| Events in quadrant B | 9,000,090 | 1,493,539 |
| Events in quadrant C | 8,379,626 | 1,439,102 |
| Events in quadrant D | 19,174,277 | 1,070,795 |
| Mode SS | |||
|---|---|---|---|
| Quadrant | BADHDUFLAG | Total packets | Discarded packets |
| A | 0 | 372 | 0 |
| B | 0 | 372 | 0 |
| C | 0 | 372 | 0 |
| D | 0 | 372 | 0 |
| Mode M9 | |||
|---|---|---|---|
| Quadrant | BADHDUFLAG | Total packets | Discarded packets |
| A | 0 | 17 | 0 |
| B | 0 | 17 | 0 |
| C | 0 | 17 | 0 |
| D | 0 | 17 | 0 |
| Mode M0 | |||
|---|---|---|---|
| Quadrant | BADHDUFLAG | Total packets | Discarded packets |
| A | 0 | 37130 | 3 |
| B | 0 | 38990 | 3 |
| C | 0 | 37152 | 3 |
| D | 0 | 69661 | 3 |
| Quadrant | Total seconds | Saturated seconds | Saturation percentage |
|---|---|---|---|
| A | 18183 | 153 | 0.841445% |
| B | 18184 | 263 | 1.446326% |
| C | 18184 | 237 | 1.303344% |
| D | 18184 | 3975 | 21.859877% |
Noise dominated data is calculated using 1-second bins in cleaned event files. If a bin has >2000 counts, and if more than 50% of those come from <1% of pixels, then it is considered to be noise-dominated and hence unusable.
| Quadrant | # 1 sec bins | Bins with >0 counts | Bins with >2000 counts | High rate bins dominated by noise | Noise dominated (total time) | Noise dominated (detector-on time) | Marked lightcurve |
|---|---|---|---|---|---|---|---|
| A | 20008 | 18185 | 2 | 2 | 0.01% | 0.01% | 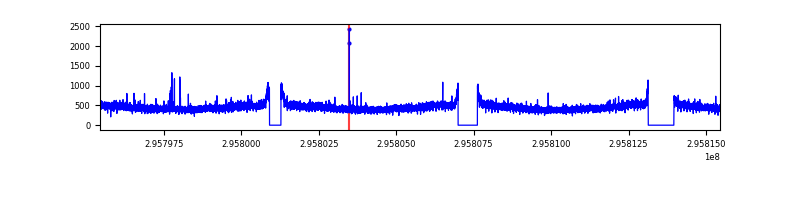 |
| B | 20009 | 18186 | 57 | 57 | 0.28% | 0.31% | 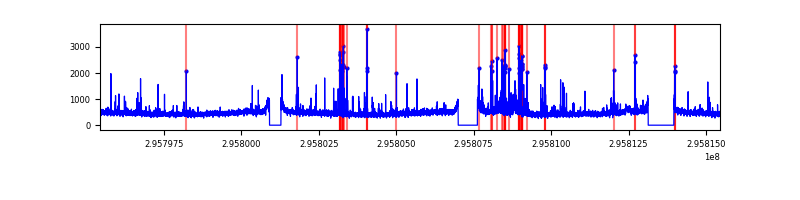 |
| C | 20009 | 18185 | 0 | 0 | 0.00% | 0.00% | 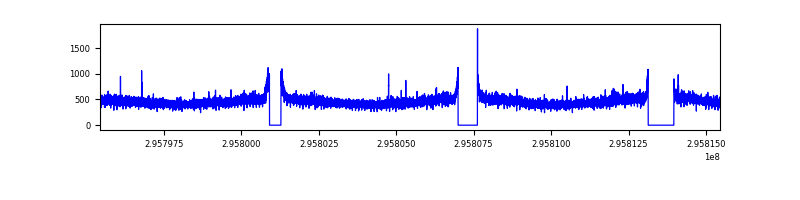 |
| D | 20009 | 18186 | 3654 | 3654 | 18.26% | 20.09% | 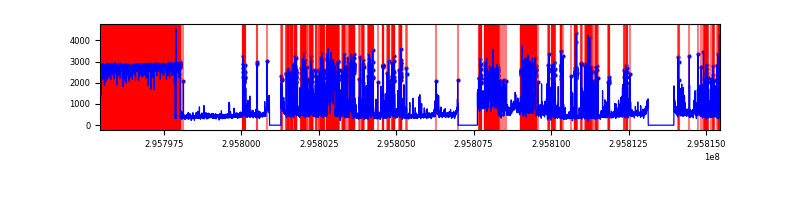 |
Top three noisy pixels from each quadrant. If the there are fewer than three noisy pixels in the level2.evt file, extra rows are filled as -1
| Pixel properties | Quadrant properties | ||||||
|---|---|---|---|---|---|---|---|
| Quadrant | DetID | PixID | Counts | Sigma | Mean | Median | Sigma |
| A | 5 | 16 | 34223 | 74.79 | 2127 | 2082 | 429.7 |
| A | 13 | 254 | 18721 | 38.72 | 2127 | 2082 | 429.7 |
| A | 0 | 226 | 18586 | 38.4 | 2127 | 2082 | 429.7 |
| B | 3 | 112 | 269655 | 662.44 | 2114 | 2058 | 404.0 |
| B | 7 | 220 | 221987 | 544.44 | 2114 | 2058 | 404.0 |
| B | 4 | 216 | 79414 | 191.5 | 2114 | 2058 | 404.0 |
| C | 14 | 238 | 315407 | 655.0 | 2047 | 2056 | 478.4 |
| C | 3 | 233 | 59115 | 119.27 | 2047 | 2056 | 478.4 |
| C | 9 | 221 | 21633 | 40.92 | 2047 | 2056 | 478.4 |
| D | 1 | 20 | 8220583 | 19112.78 | 1772 | 1720 | 430.0 |
| D | 1 | 52 | 2538836 | 5900.01 | 1772 | 1720 | 430.0 |
| D | 12 | 218 | 1374701 | 3192.84 | 1772 | 1720 | 430.0 |
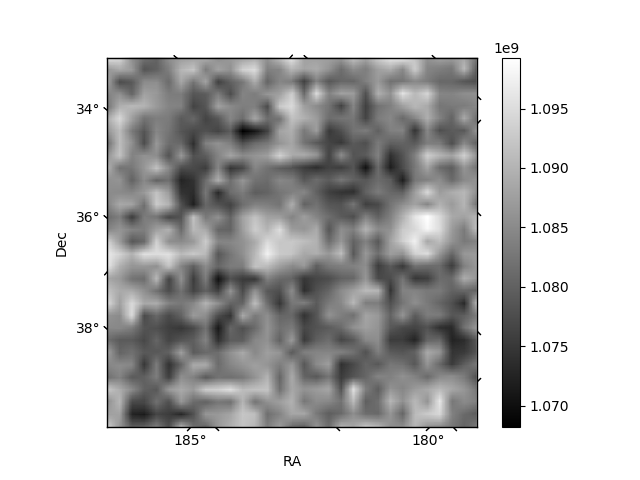
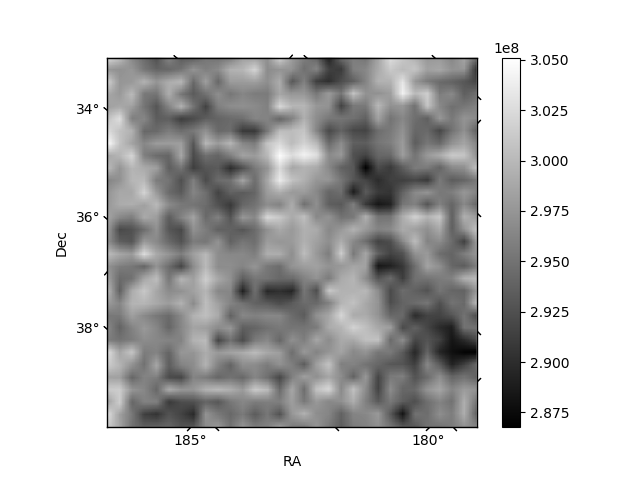
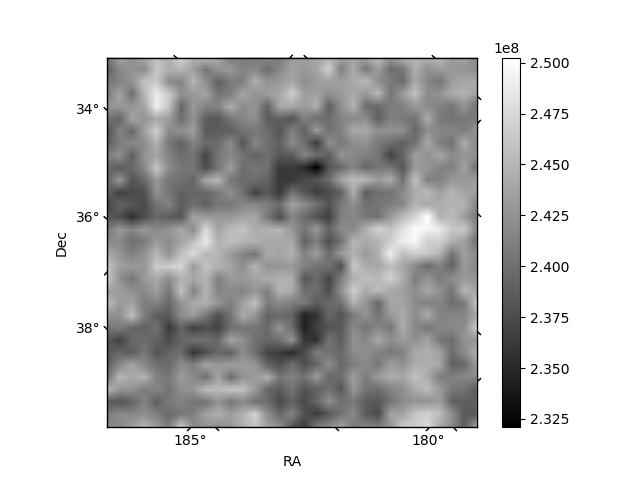
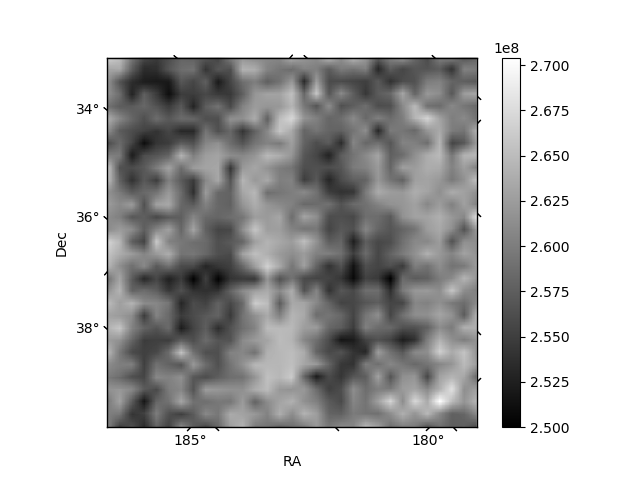
Histogram calculated using DETX and DETY for each event in the final _common_clean file
| Quadrant A | 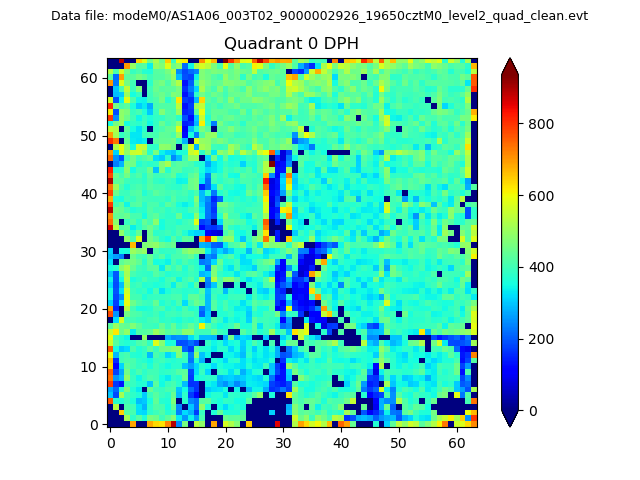 |
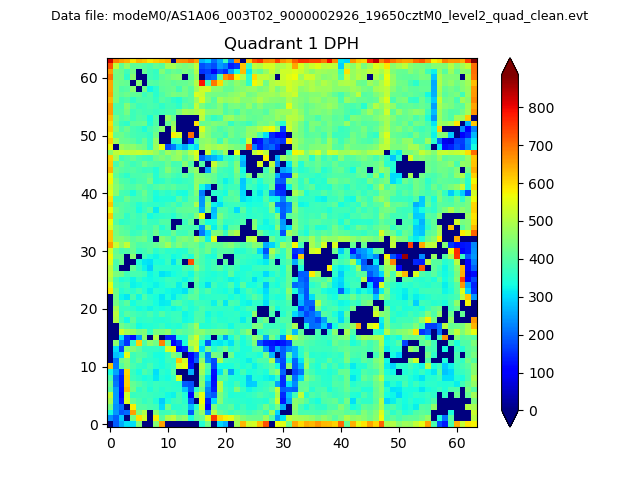 |
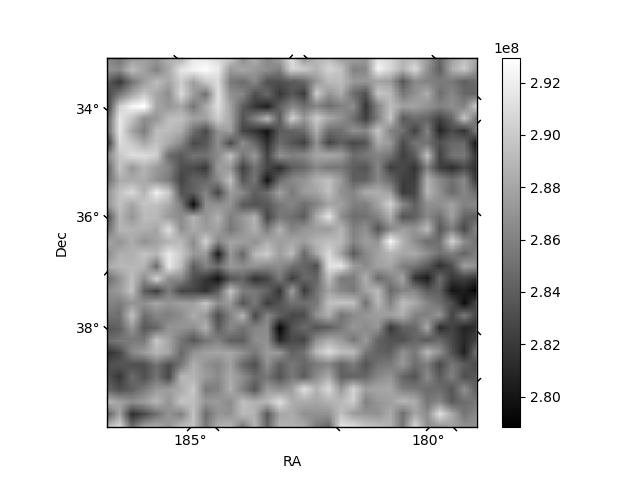
Quadrant B |
|---|---|---|---|
| Quadrant D |  |
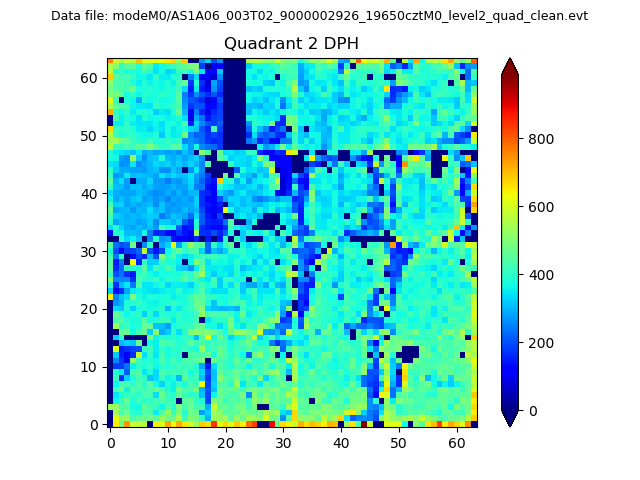 |
Quadrant C |
| Plot type | Count rate plots | Images |
|---|---|---|
| Comparison with Poisson distribution Blue bars denote a histogram of data divided into 1 sec bins. Red curve is a Poisson curve with rate = median count rate of data. |
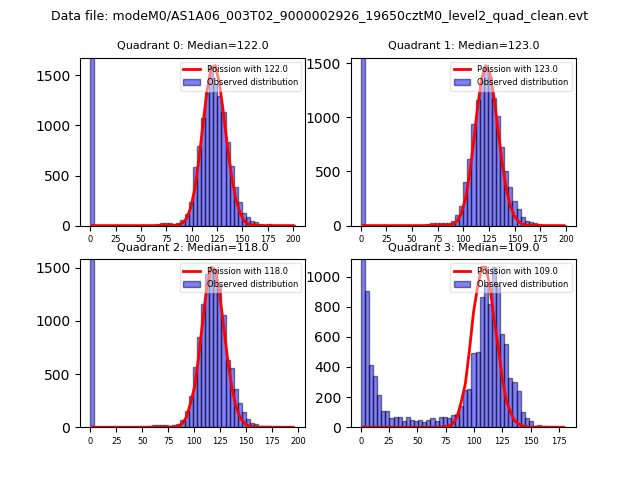 |
 |
| Quadrant-wise count rates Data is divided into 100 sec bins |
 |
|
| Module-wise count rates for Quadrant A Data is divided into 100 sec bins |
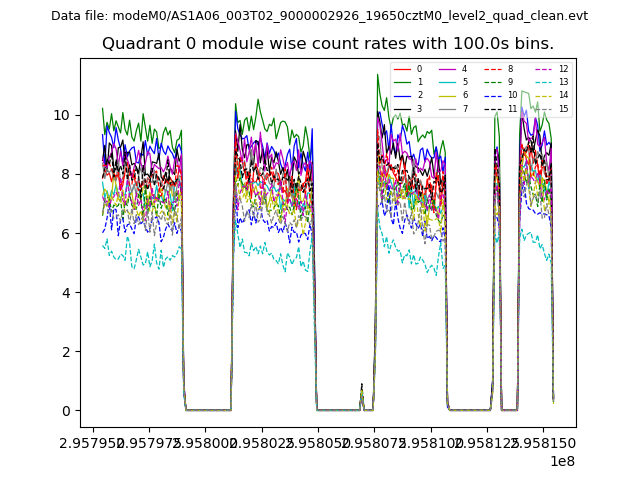 |
 |
| Module-wise count rates for Quadrant B Data is divided into 100 sec bins |
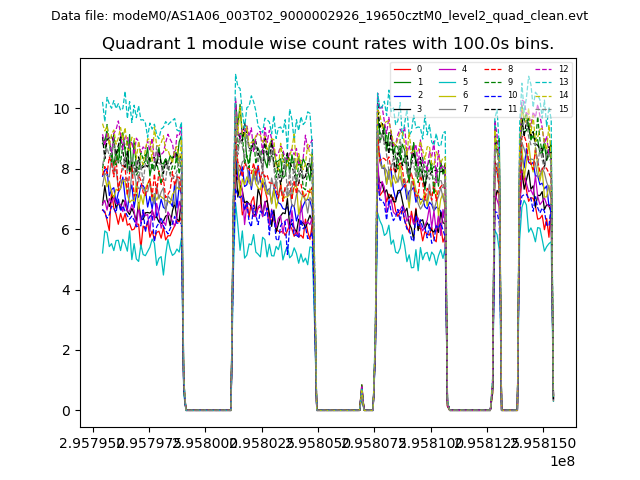 |
 |
| Module-wise count rates for Quadrant C Data is divided into 100 sec bins |
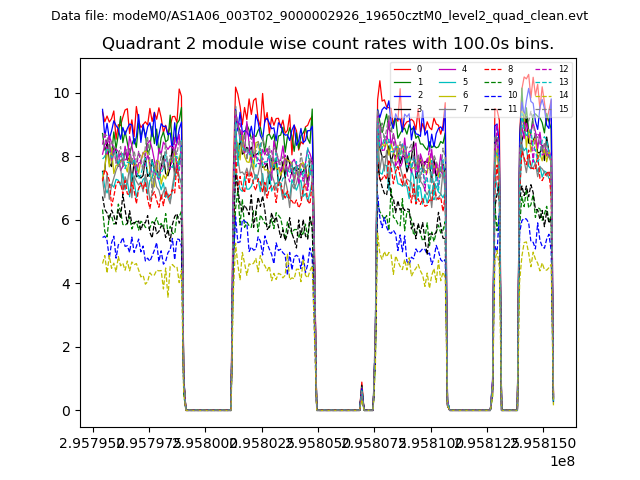 |
 |
| Module-wise count rates for Quadrant D Data is divided into 100 sec bins |
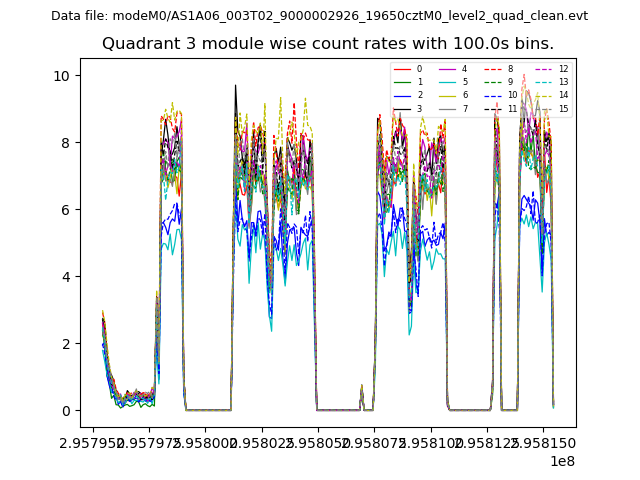 |
 |
| Parameter | Plot |
|---|---|
| CZT HV Monitor | 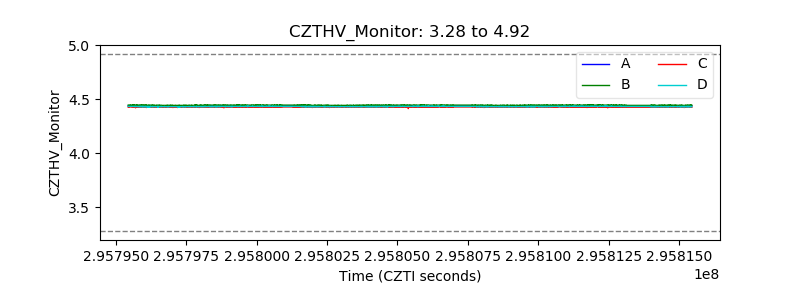 |
| D_VDD | 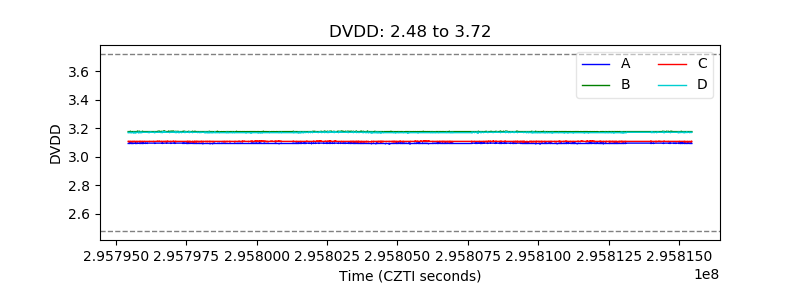 |
| Temperature 1 | 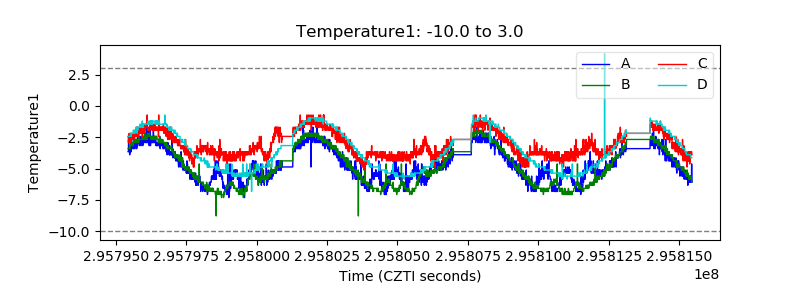 |
| Veto HV Monitor | 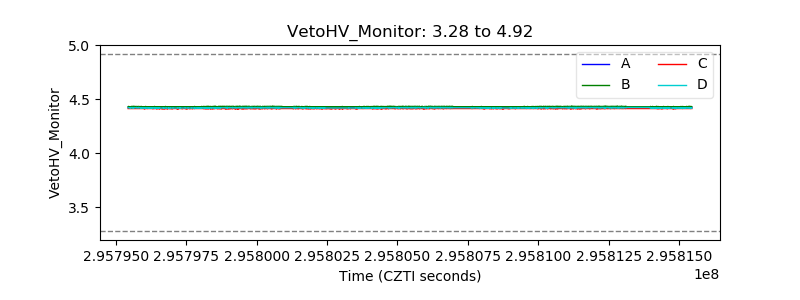 |
| Veto LLD | 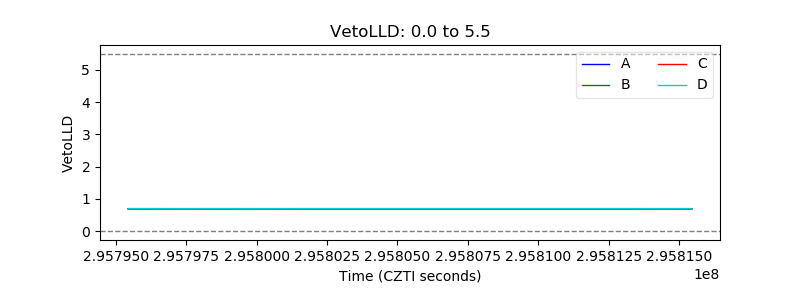 |
| Alpha Counter | 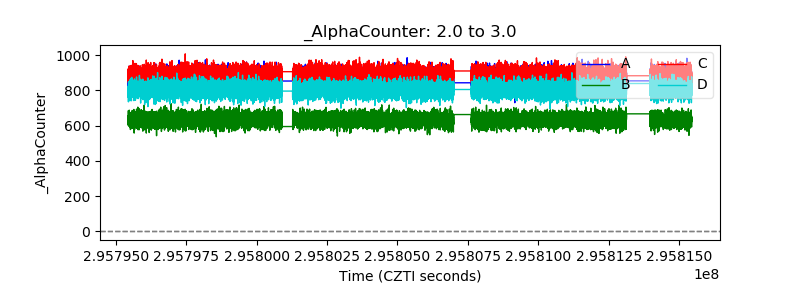 |
| _CPM_Rate | 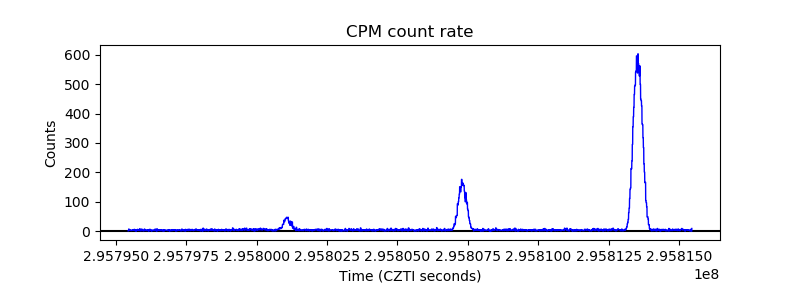 |
| CZT Counter |  |
| +2.5 Volts monitor |  |
| +5 Volts monitor |  |
| _ROLL_ROT | 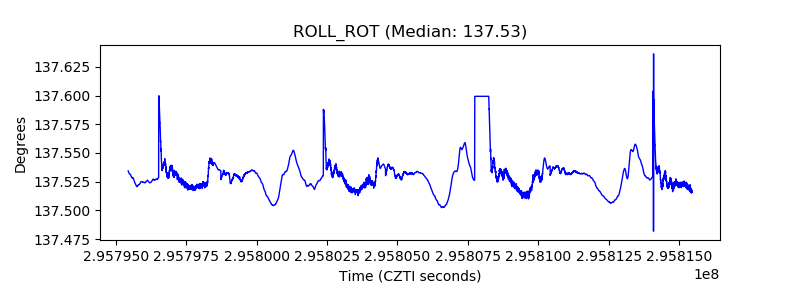 |
| _Roll_DEC | 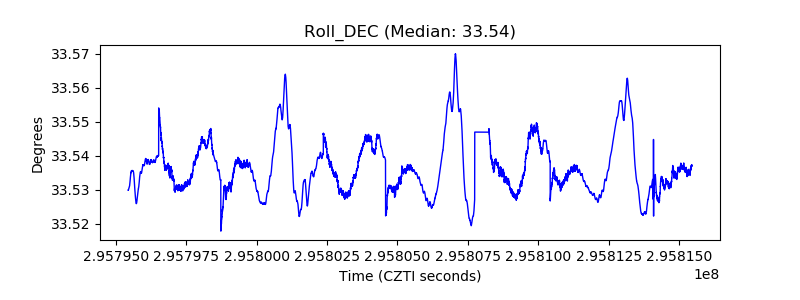 |
| _Roll_RA |  |
| Veto Counter | 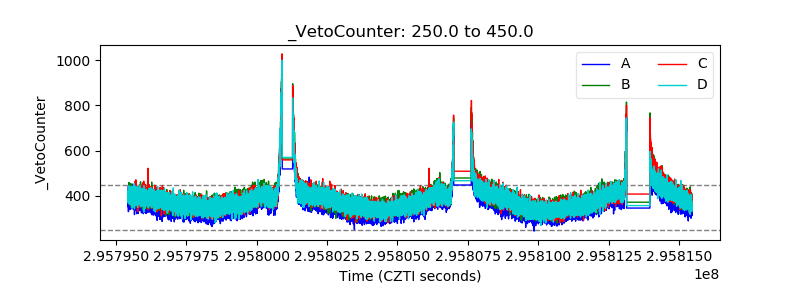 |