| Param | Original file | Final file |
|---|---|---|
| Filename | modeM0/AS1A06_003T02_9000002926_19651cztM0_level2.evt | modeM0/AS1A06_003T02_9000002926_19651cztM0_level2_quad_clean.evt |
| Size (bytes) | 584,265,600 | 91,762,560 |
| Size | 557.2 MB | 87.5 MB |
| Events in quadrant A | 3,066,821 | 602,930 |
| Events in quadrant B | 3,199,321 | 608,623 |
| Events in quadrant C | 3,161,098 | 583,150 |
| Events in quadrant D | 7,809,338 | 513,481 |
| Mode SS | |||
|---|---|---|---|
| Quadrant | BADHDUFLAG | Total packets | Discarded packets |
| A | 0 | 136 | 0 |
| B | 0 | 136 | 0 |
| C | 0 | 136 | 0 |
| D | 0 | 136 | 0 |
| Mode M9 | |||
|---|---|---|---|
| Quadrant | BADHDUFLAG | Total packets | Discarded packets |
| A | 0 | 15 | 0 |
| B | 0 | 16 | 0 |
| C | 0 | 16 | 0 |
| D | 0 | 16 | 0 |
| Mode M0 | |||
|---|---|---|---|
| Quadrant | BADHDUFLAG | Total packets | Discarded packets |
| A | 0 | 13781 | 2 |
| B | 0 | 14000 | 2 |
| C | 0 | 13858 | 2 |
| D | 0 | 27793 | 2 |
| Quadrant | Total seconds | Saturated seconds | Saturation percentage |
|---|---|---|---|
| A | 6753 | 36 | 0.533096% |
| B | 6753 | 45 | 0.666371% |
| C | 6753 | 59 | 0.873686% |
| D | 6753 | 1821 | 26.965793% |
Noise dominated data is calculated using 1-second bins in cleaned event files. If a bin has >2000 counts, and if more than 50% of those come from <1% of pixels, then it is considered to be noise-dominated and hence unusable.
| Quadrant | # 1 sec bins | Bins with >0 counts | Bins with >2000 counts | High rate bins dominated by noise | Noise dominated (total time) | Noise dominated (detector-on time) | Marked lightcurve |
|---|---|---|---|---|---|---|---|
| A | 7713 | 6753 | 0 | 0 | 0.00% | 0.00% | 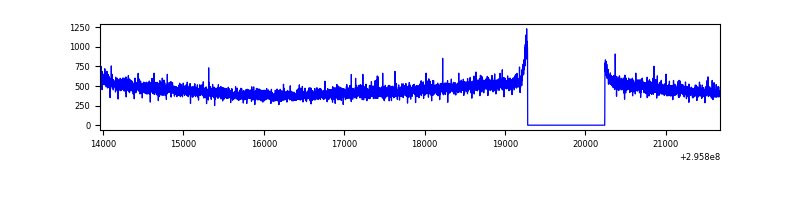 |
| B | 7713 | 6753 | 3 | 3 | 0.04% | 0.04% | 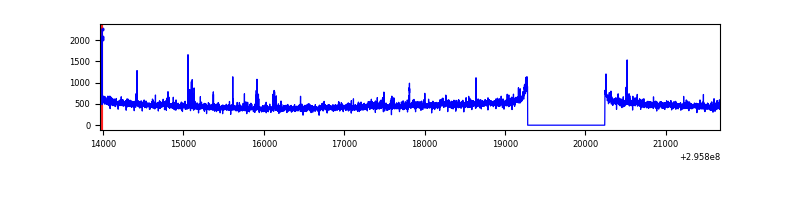 |
| C | 7713 | 6753 | 0 | 0 | 0.00% | 0.00% | 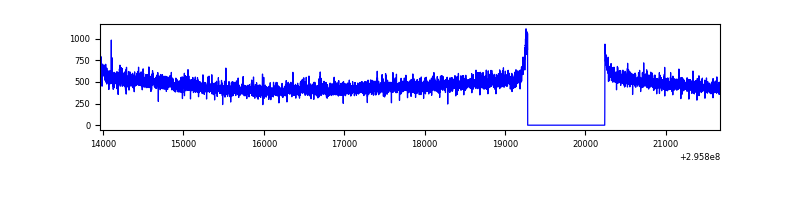 |
| D | 7713 | 6753 | 1686 | 1686 | 21.86% | 24.97% | 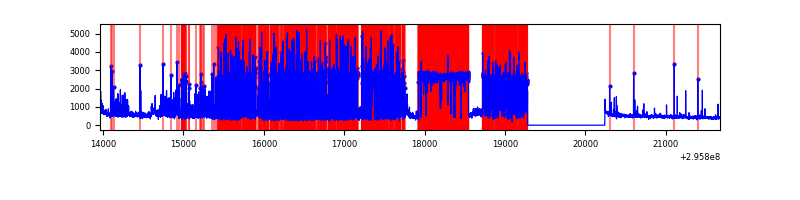 |
Top three noisy pixels from each quadrant. If the there are fewer than three noisy pixels in the level2.evt file, extra rows are filled as -1
| Pixel properties | Quadrant properties | ||||||
|---|---|---|---|---|---|---|---|
| Quadrant | DetID | PixID | Counts | Sigma | Mean | Median | Sigma |
| A | 0 | 226 | 6886 | 37.98 | 796 | 778 | 160.8 |
| A | 13 | 254 | 6883 | 37.96 | 796 | 778 | 160.8 |
| A | 3 | 137 | 6535 | 35.8 | 796 | 778 | 160.8 |
| B | 0 | 198 | 35118 | 224.91 | 795 | 775 | 152.7 |
| B | 7 | 220 | 21050 | 132.78 | 795 | 775 | 152.7 |
| B | 12 | 111 | 18109 | 113.52 | 795 | 775 | 152.7 |
| C | 14 | 238 | 118834 | 659.98 | 769 | 774 | 178.9 |
| C | 3 | 233 | 35050 | 191.61 | 769 | 774 | 178.9 |
| C | 9 | 221 | 11379 | 59.28 | 769 | 774 | 178.9 |
| D | 1 | 20 | 3746978 | 23976.43 | 643 | 625 | 156.3 |
| D | 1 | 52 | 1389594 | 8889.32 | 643 | 625 | 156.3 |
| D | 12 | 225 | 128687 | 819.59 | 643 | 625 | 156.3 |
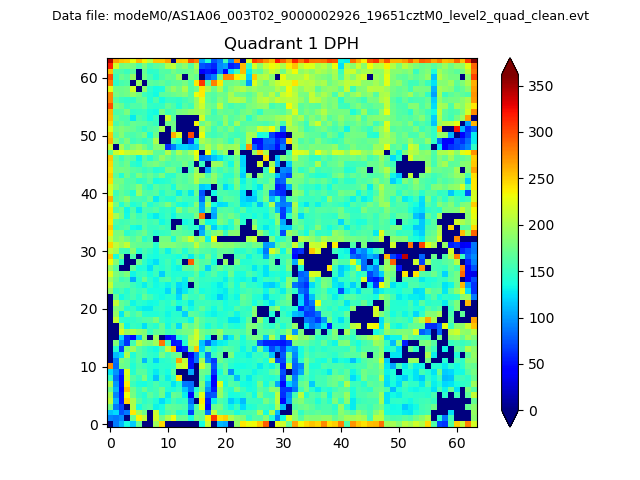
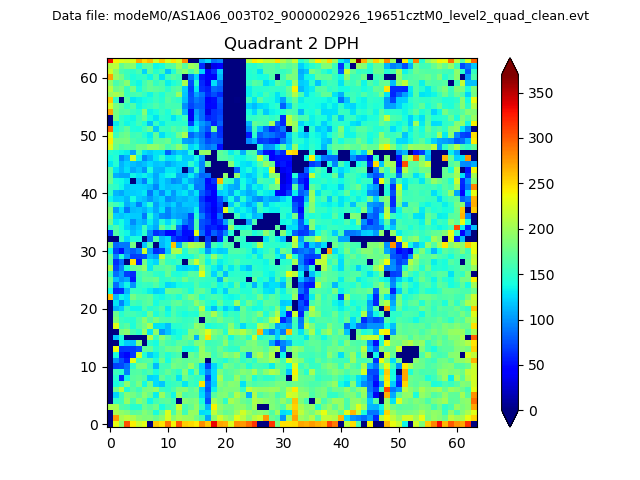
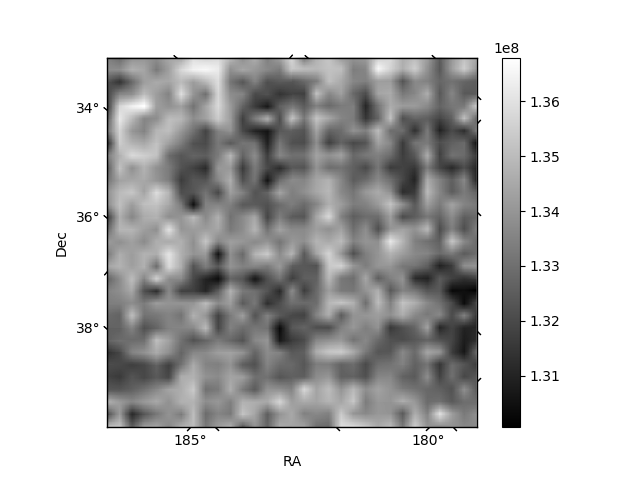
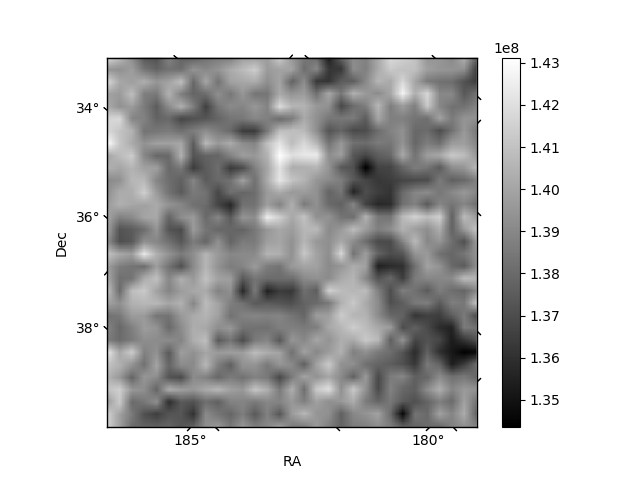
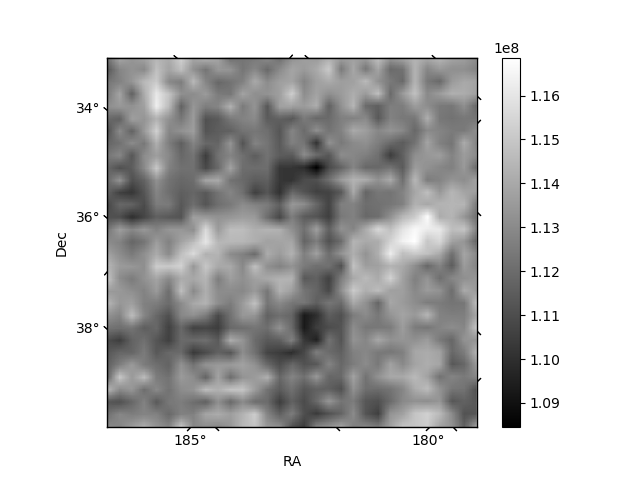
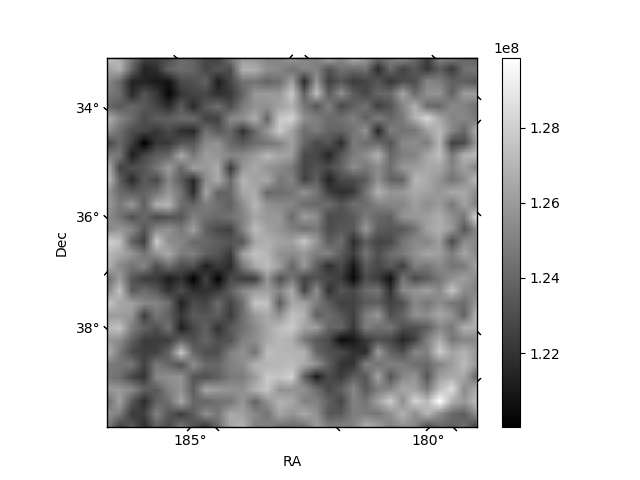
Histogram calculated using DETX and DETY for each event in the final _common_clean file
| Quadrant A |  |
 |
Quadrant B |
|---|---|---|---|
| Quadrant D | 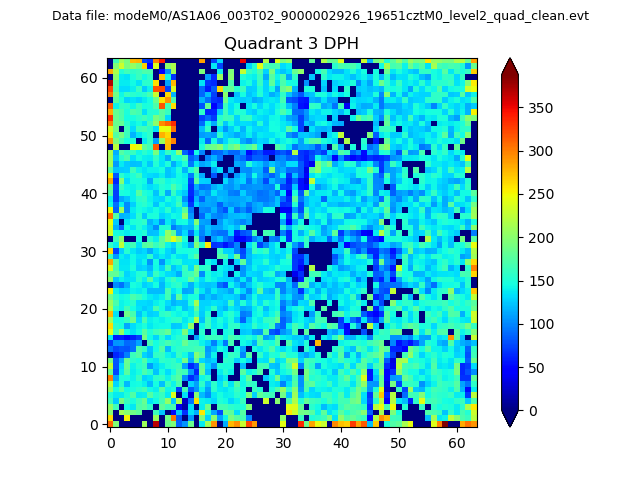 |
 |
Quadrant C |
| Plot type | Count rate plots | Images |
|---|---|---|
| Comparison with Poisson distribution Blue bars denote a histogram of data divided into 1 sec bins. Red curve is a Poisson curve with rate = median count rate of data. |
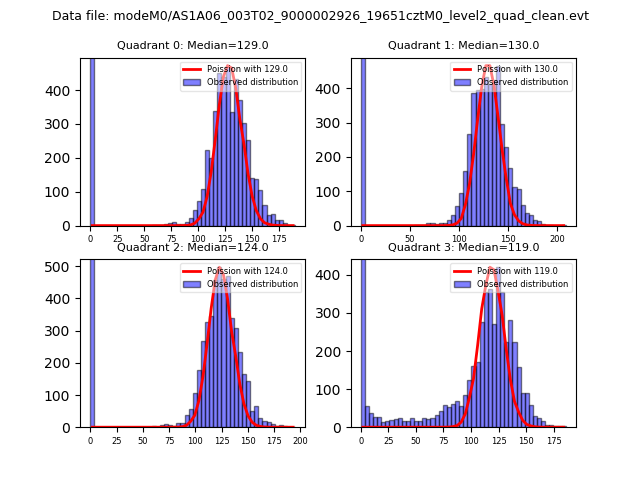 |
 |
| Quadrant-wise count rates Data is divided into 100 sec bins |
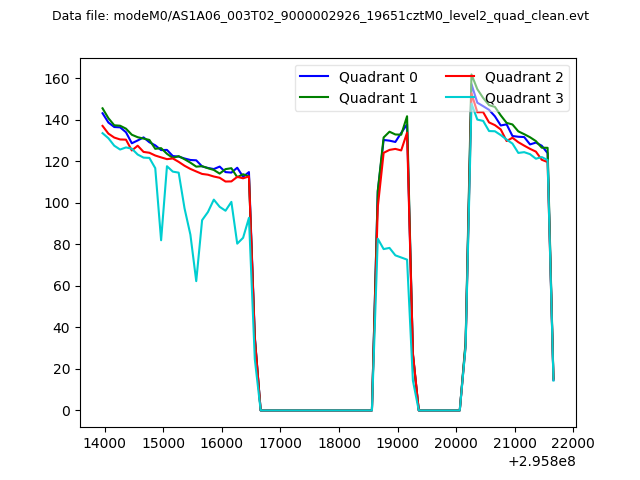 |
|
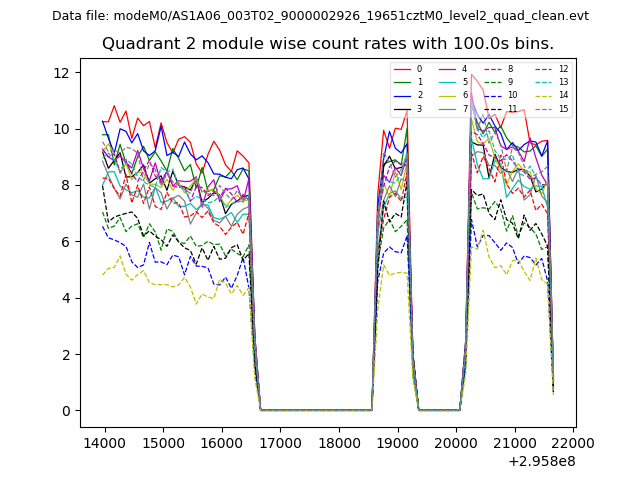
| Module-wise count rates for Quadrant A Data is divided into 100 sec bins |
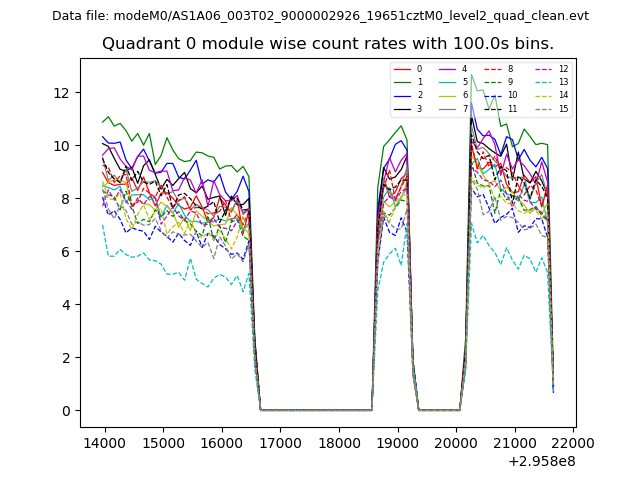 |
 |
| Module-wise count rates for Quadrant B Data is divided into 100 sec bins |
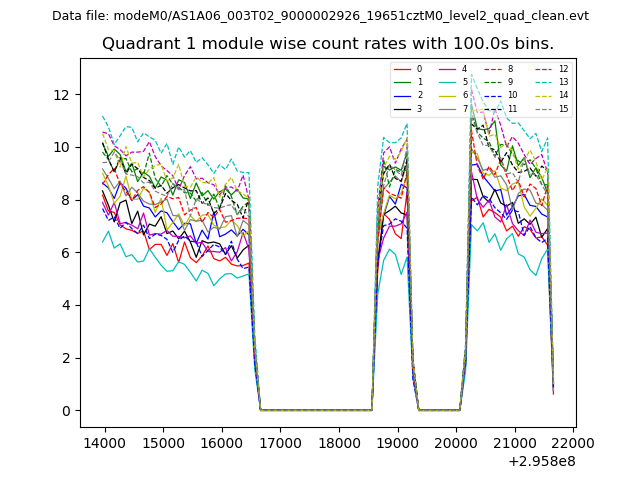 |
 |
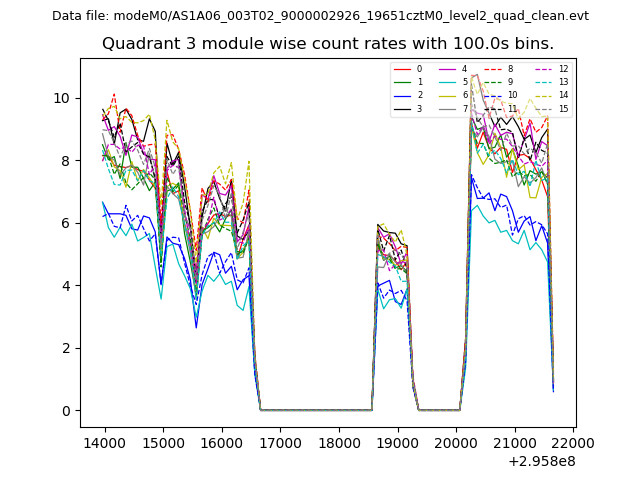
| Module-wise count rates for Quadrant C Data is divided into 100 sec bins |
 |
 |
| Module-wise count rates for Quadrant D Data is divided into 100 sec bins |
 |
 |
| Parameter | Plot |
|---|---|
| CZT HV Monitor | 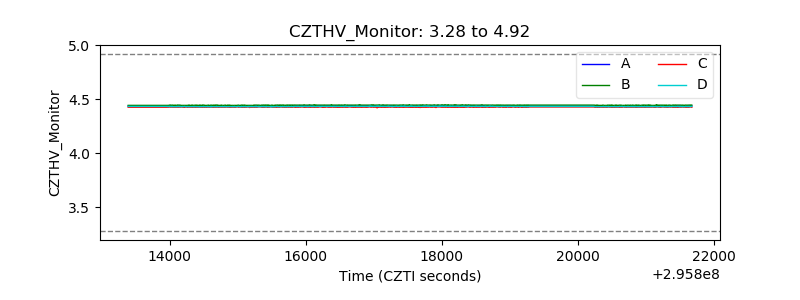 |
| D_VDD | 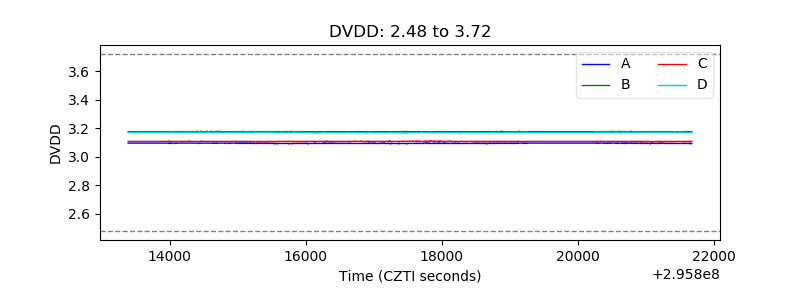 |
| Temperature 1 | 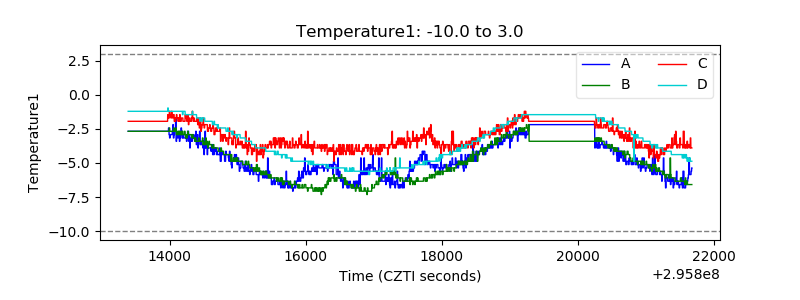 |
| Veto HV Monitor |  |
| Veto LLD |  |
| Alpha Counter | 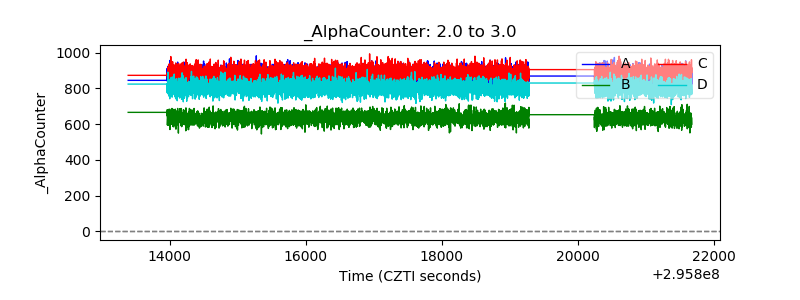 |
| _CPM_Rate | 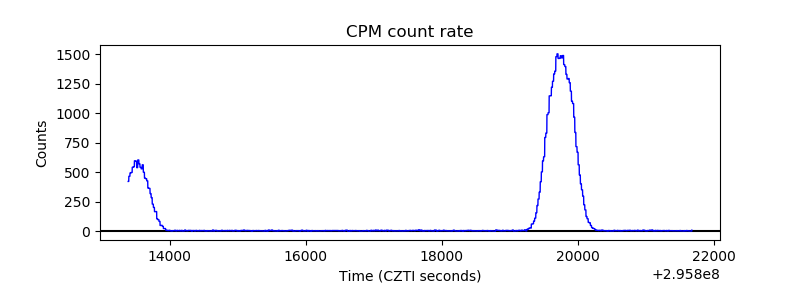 |
| CZT Counter | 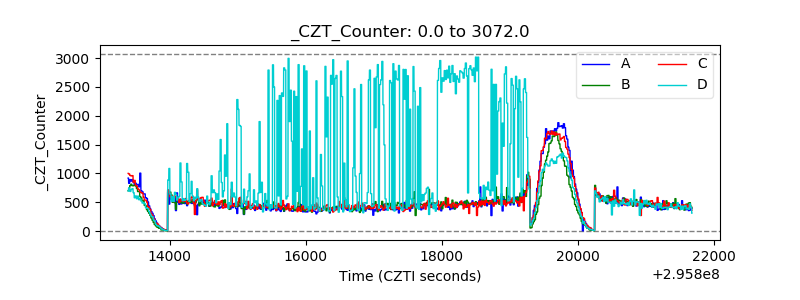 |
| +2.5 Volts monitor |  |
| +5 Volts monitor |  |
| _ROLL_ROT | 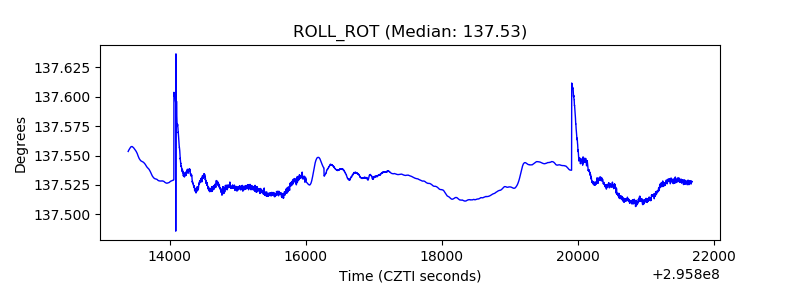 |
| _Roll_DEC | 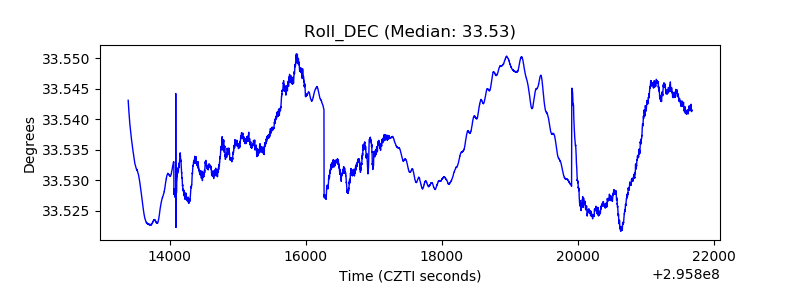 |
| _Roll_RA |  |
| Veto Counter | 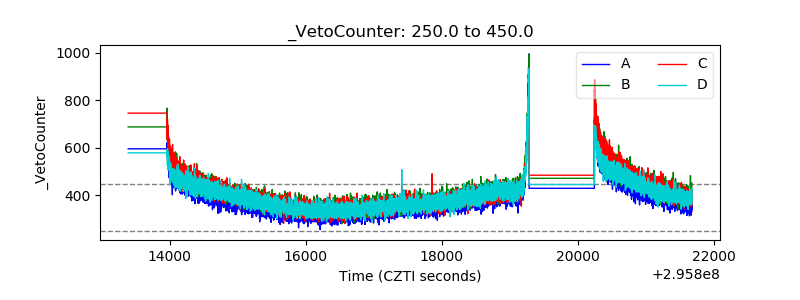 |