| Param | Original file | Final file |
|---|---|---|
| Filename | modeM0/AS1A06_003T02_9000002926_19653cztM0_level2.evt | modeM0/AS1A06_003T02_9000002926_19653cztM0_level2_quad_clean.evt |
| Size (bytes) | 2,007,426,240 | 317,810,880 |
| Size | 1.9 GB | 303.1 MB |
| Events in quadrant A | 11,385,339 | 2,113,021 |
| Events in quadrant B | 12,169,979 | 2,130,402 |
| Events in quadrant C | 11,473,087 | 2,041,070 |
| Events in quadrant D | 24,096,799 | 1,638,010 |
| Mode SS | |||
|---|---|---|---|
| Quadrant | BADHDUFLAG | Total packets | Discarded packets |
| A | 0 | 504 | 0 |
| B | 0 | 504 | 0 |
| C | 0 | 504 | 0 |
| D | 0 | 504 | 0 |
| Mode M9 | |||
|---|---|---|---|
| Quadrant | BADHDUFLAG | Total packets | Discarded packets |
| A | 0 | 30 | 0 |
| B | 0 | 30 | 0 |
| C | 0 | 31 | 0 |
| D | 0 | 31 | 0 |
| Mode M0 | |||
|---|---|---|---|
| Quadrant | BADHDUFLAG | Total packets | Discarded packets |
| A | 0 | 50960 | 5 |
| B | 0 | 52595 | 5 |
| C | 0 | 50765 | 5 |
| D | 0 | 88875 | 5 |
| Quadrant | Total seconds | Saturated seconds | Saturation percentage |
|---|---|---|---|
| A | 24732 | 276 | 1.115963% |
| B | 24733 | 395 | 1.597057% |
| C | 24733 | 354 | 1.431286% |
| D | 24733 | 4606 | 18.622892% |
Noise dominated data is calculated using 1-second bins in cleaned event files. If a bin has >2000 counts, and if more than 50% of those come from <1% of pixels, then it is considered to be noise-dominated and hence unusable.
| Quadrant | # 1 sec bins | Bins with >0 counts | Bins with >2000 counts | High rate bins dominated by noise | Noise dominated (total time) | Noise dominated (detector-on time) | Marked lightcurve |
|---|---|---|---|---|---|---|---|
| A | 37613 | 24736 | 22 | 22 | 0.06% | 0.09% | 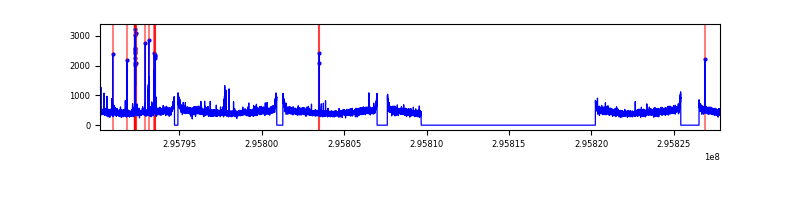 |
| B | 37614 | 24736 | 77 | 77 | 0.20% | 0.31% | 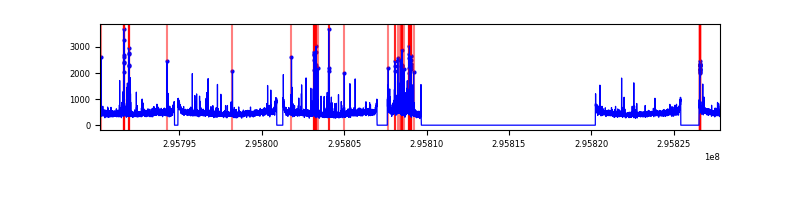 |
| C | 37614 | 24737 | 0 | 0 | 0.00% | 0.00% | 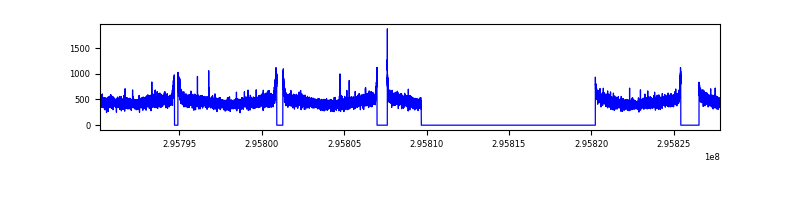 |
| D | 37614 | 24737 | 4204 | 4204 | 11.18% | 16.99% | 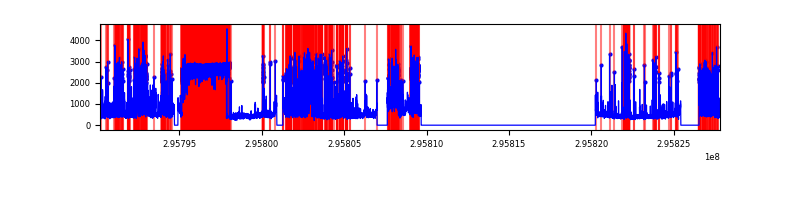 |
Top three noisy pixels from each quadrant. If the there are fewer than three noisy pixels in the level2.evt file, extra rows are filled as -1
| Pixel properties | Quadrant properties | ||||||
|---|---|---|---|---|---|---|---|
| Quadrant | DetID | PixID | Counts | Sigma | Mean | Median | Sigma |
| A | 5 | 16 | 130543 | 217.78 | 2918 | 2855 | 586.3 |
| A | 0 | 226 | 25172 | 38.06 | 2918 | 2855 | 586.3 |
| A | 3 | 137 | 23491 | 35.2 | 2918 | 2855 | 586.3 |
| B | 7 | 220 | 278425 | 499.97 | 2906 | 2833 | 551.2 |
| B | 3 | 112 | 241841 | 433.6 | 2906 | 2833 | 551.2 |
| B | 4 | 216 | 89225 | 156.73 | 2906 | 2833 | 551.2 |
| C | 14 | 238 | 435702 | 658.25 | 2815 | 2831 | 657.6 |
| C | 3 | 233 | 43313 | 61.56 | 2815 | 2831 | 657.6 |
| C | 13 | 61 | 19732 | 25.7 | 2815 | 2831 | 657.6 |
| D | 1 | 20 | 9000178 | 14757.1 | 2525 | 2450 | 609.7 |
| D | 1 | 52 | 2902232 | 4755.91 | 2525 | 2450 | 609.7 |
| D | 12 | 218 | 2049064 | 3356.63 | 2525 | 2450 | 609.7 |
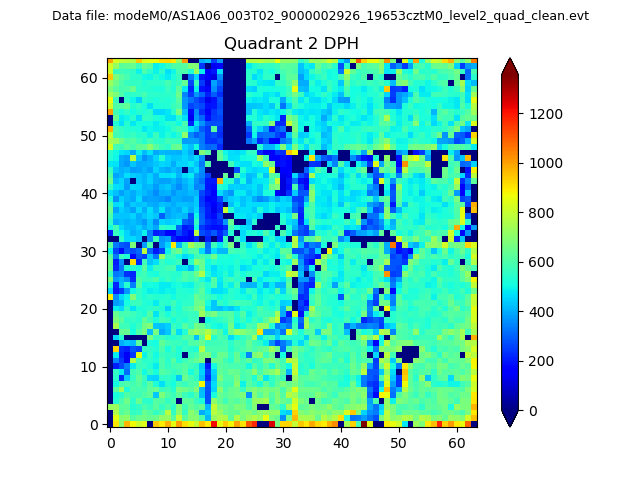
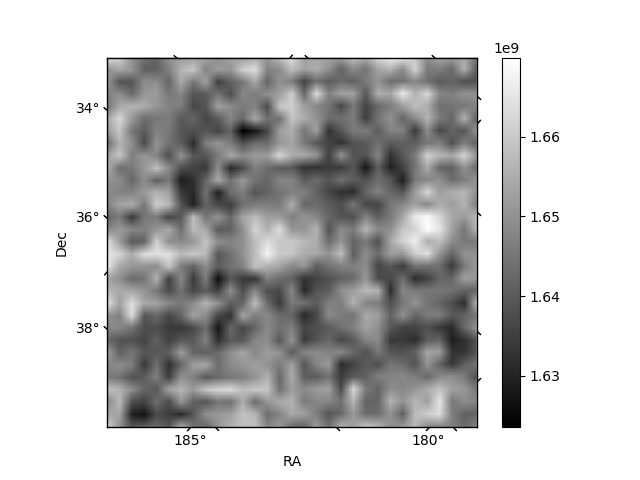
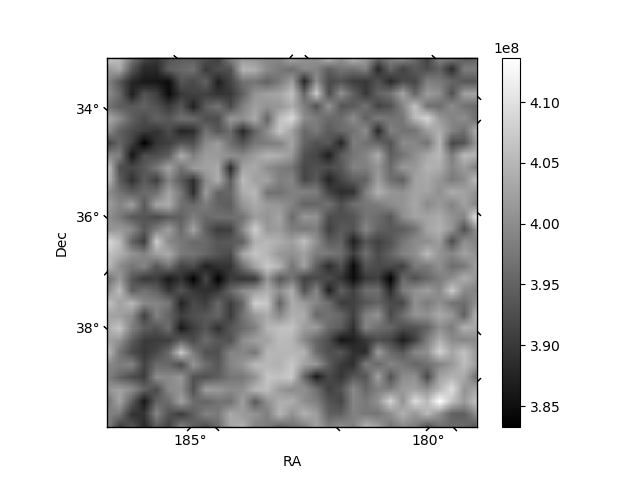
Histogram calculated using DETX and DETY for each event in the final _common_clean file
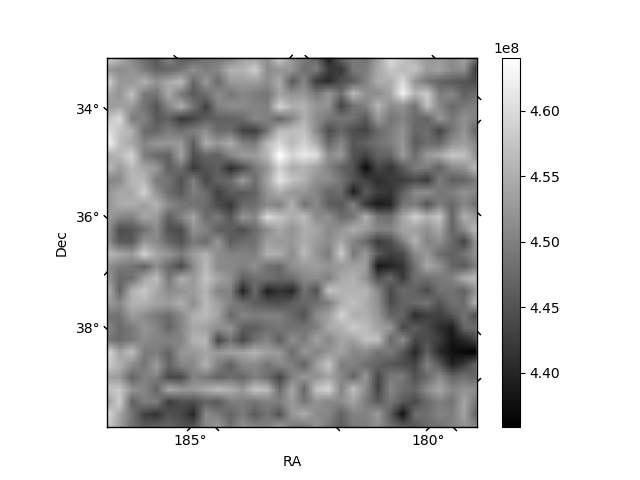
| Quadrant A | 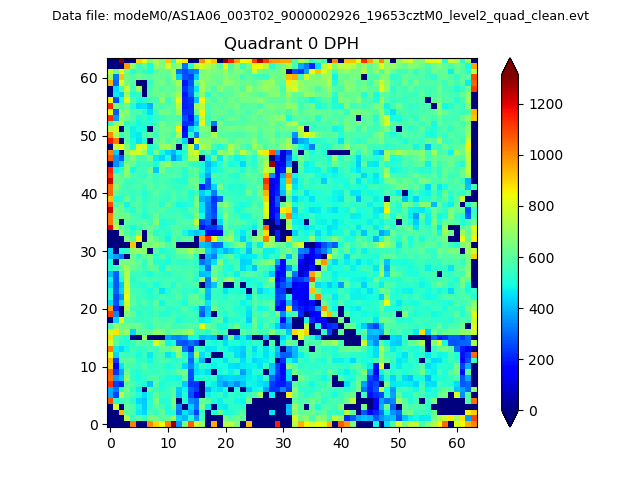 |
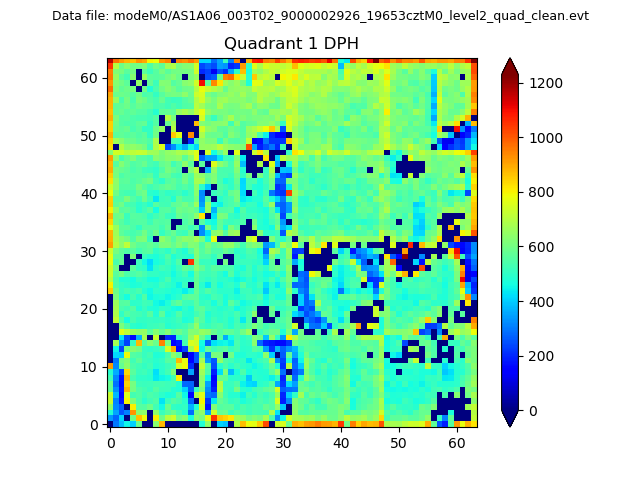 |
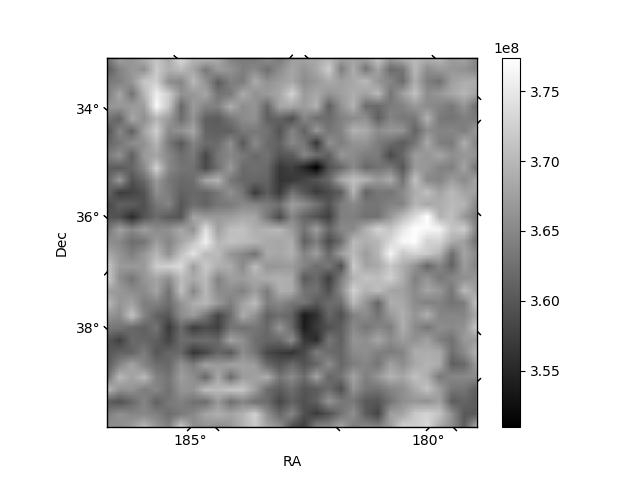
Quadrant B |
|---|---|---|---|
| Quadrant D | 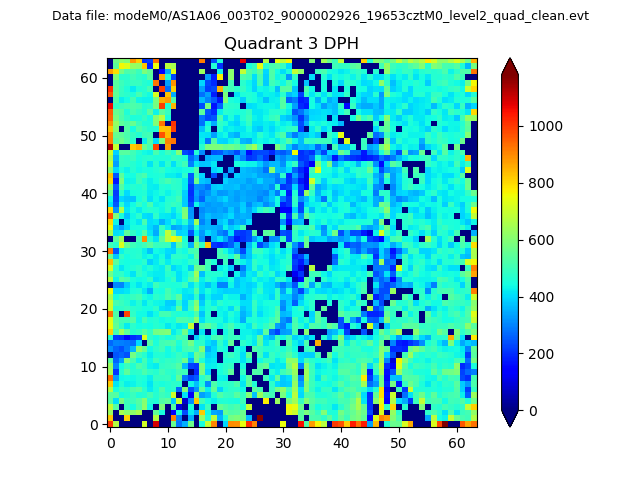 |
 |
Quadrant C |
| Plot type | Count rate plots | Images |
|---|---|---|
| Comparison with Poisson distribution Blue bars denote a histogram of data divided into 1 sec bins. Red curve is a Poisson curve with rate = median count rate of data. |
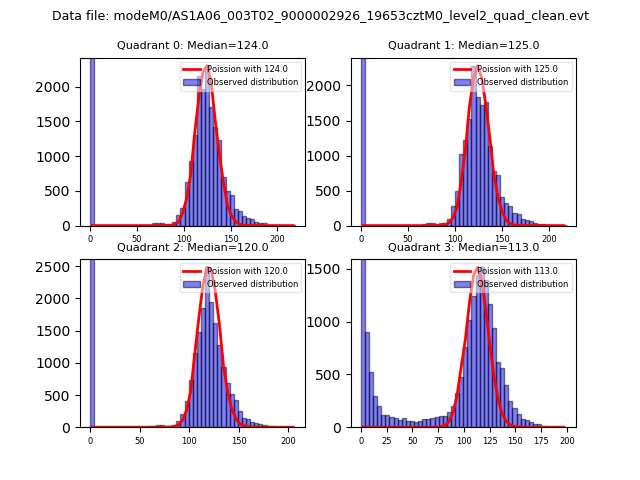 |
 |
| Quadrant-wise count rates Data is divided into 100 sec bins |
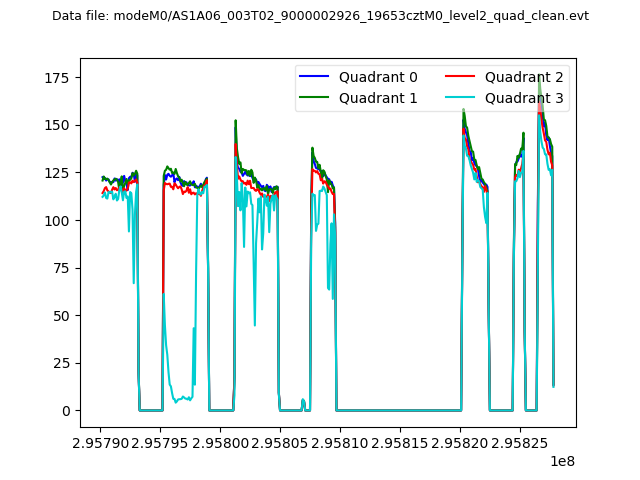 |
|
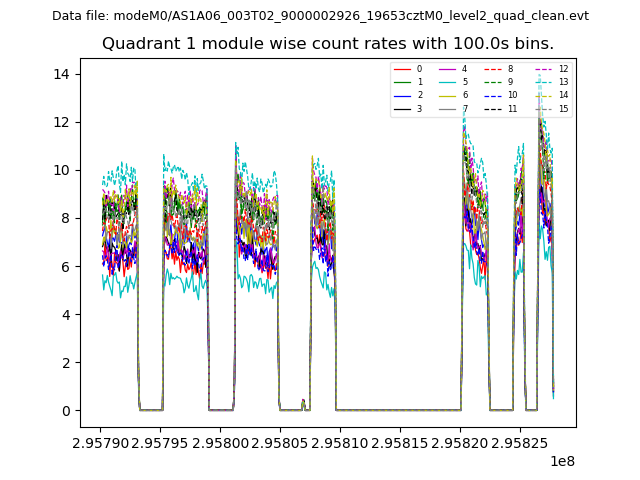
| Module-wise count rates for Quadrant A Data is divided into 100 sec bins |
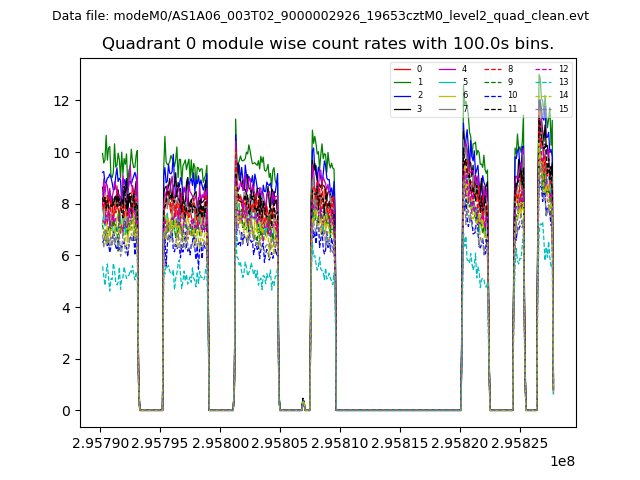 |
 |
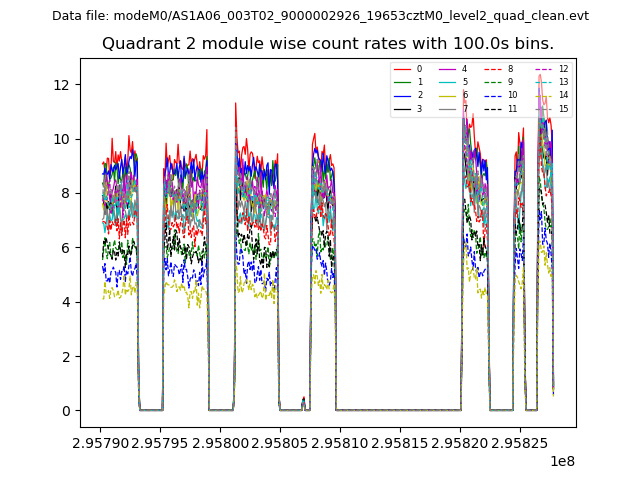
| Module-wise count rates for Quadrant B Data is divided into 100 sec bins |
 |
 |
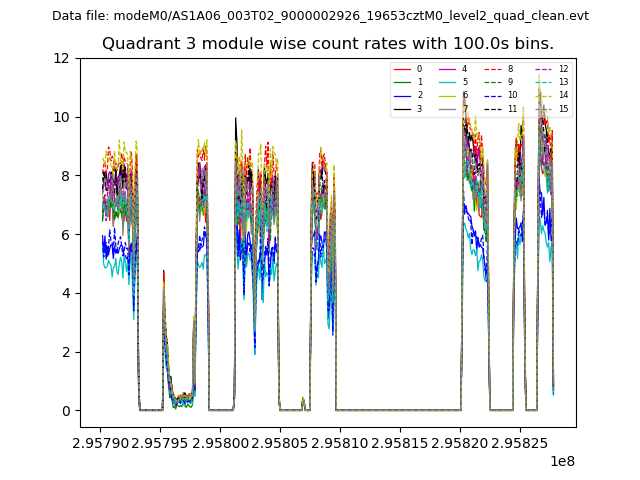
| Module-wise count rates for Quadrant C Data is divided into 100 sec bins |
 |
 |
| Module-wise count rates for Quadrant D Data is divided into 100 sec bins |
 |
 |
| Parameter | Plot |
|---|---|
| CZT HV Monitor | 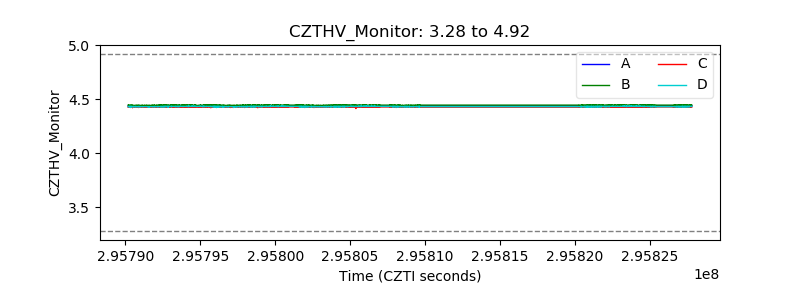 |
| D_VDD | 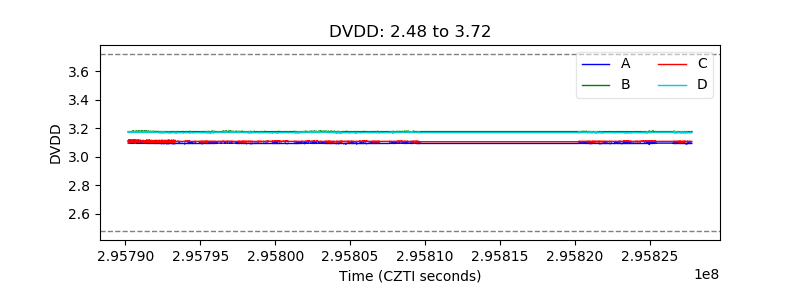 |
| Temperature 1 | 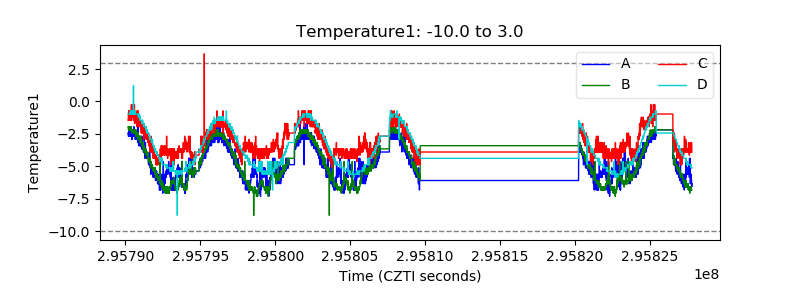 |
| Veto HV Monitor | 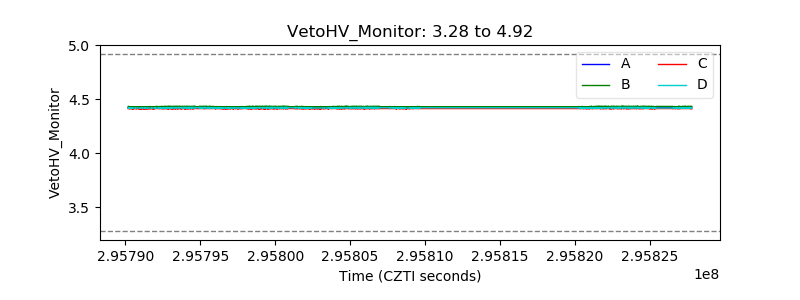 |
| Veto LLD | 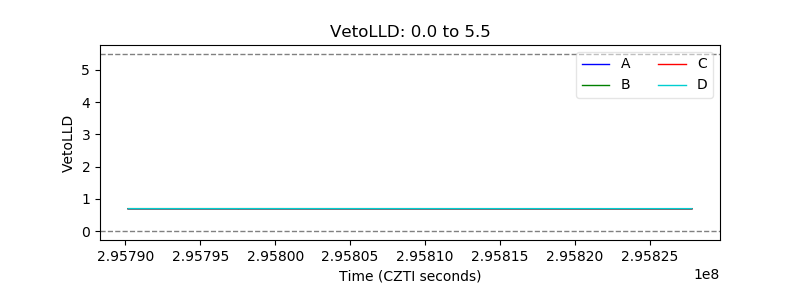 |
| Alpha Counter | 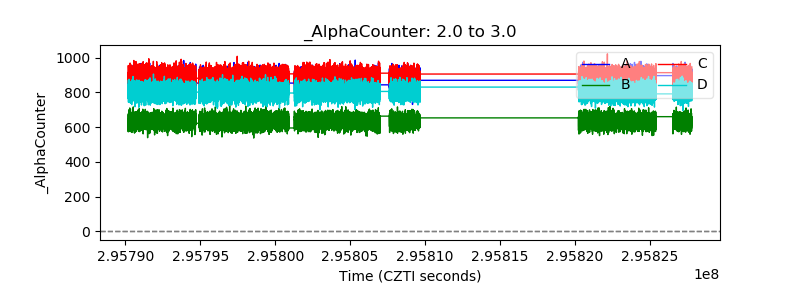 |
| _CPM_Rate | 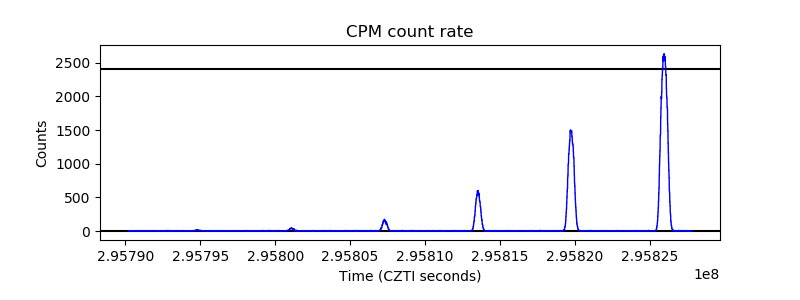 |
| CZT Counter | 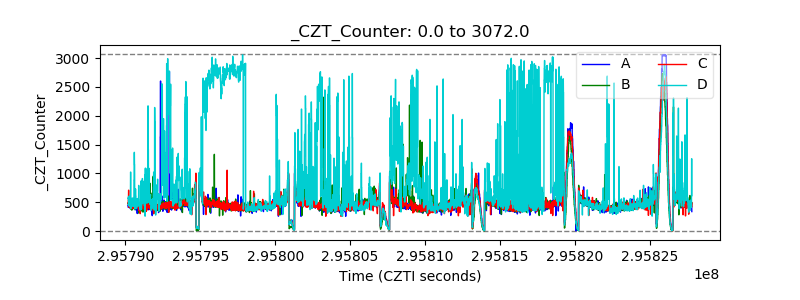 |
| +2.5 Volts monitor |  |
| +5 Volts monitor |  |
| _ROLL_ROT | 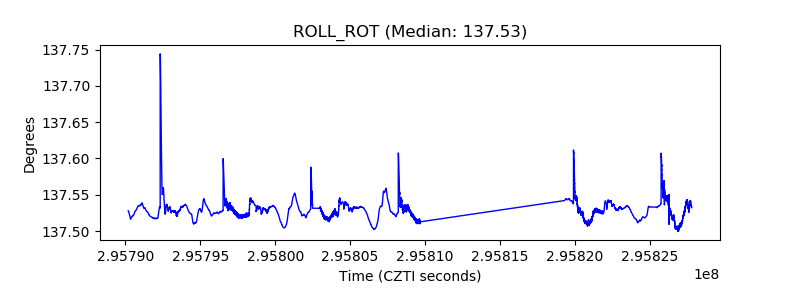 |
| _Roll_DEC |  |
| _Roll_RA | 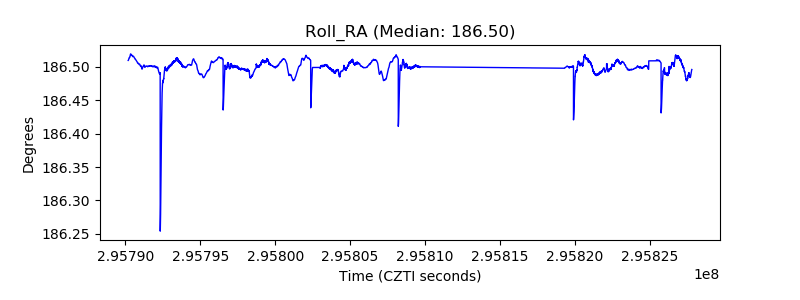 |
| Veto Counter | 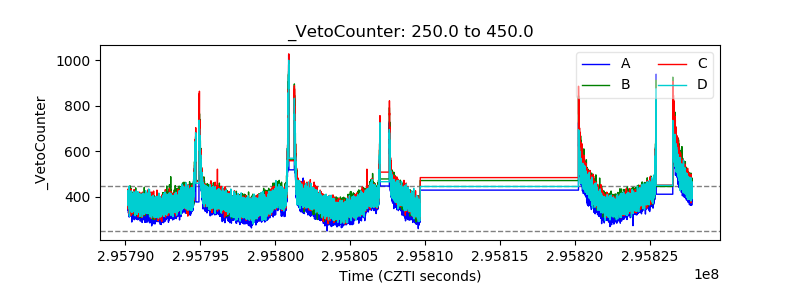 |